 Water Year 2013 CODOS Summary for Rabbit Ears Pass
Summary | Snowpack | Melt Rate | Stream Flows
Summary
Water Year 2013 entered late winter with dismal snowpack development at ten of eleven CODOS dust-on-snow monitoring sites, Rabbit Ears Pass being the single exception. Through March 2013, snowpack SWE totals at all other sites resembled or even fell short of the very dry winter of WY 2012, raising concerns about back-to-back drought seasons. That broadly consistent spatial pattern in scant precipitation began to diverge in April, 2013. CODOS sites in the northern Front Range and Colorado River headwaters benefitted most from a series of April and May winter storms that augmented snowpacks and eventually resulted in average or even above average peak SWE levels on average or later-than-average dates. In the southwestern mountains, fewer and/or smaller April/May storms failed to offset the dry beginning to WY2013 winter. CODOS sites in the San Juan Mountains experienced, for the second year, substantially sub-par peak SWE values, on near-average dates. In between, the Central Mountains, Grand Mesa, Park, and northern Gore ranges came closer to but still fell short of average snowpacks. The Rabbit Ears Pass CODOS site was among those sites where WY 2013 snowpack development and peak SWE fell short of average values but substantially exceeded WY 2012 levels.
At the CSAS Senator Beck Basin Study Area at Red Mountain Pass, the primary CODOS monitoring site, WY2013 produced a total of ten separate dust-on-snow events, a lower total count than in the past three seasons. However, the actual mass of dust deposited at Senator Beck Basin in WY 2013 was greater than in any prior season, including the “Martian Winter” of WY 2009. Dust season began at Senator Beck Basin in November with a single event, February and March delivered four additional events, but the vast majority of dust deposition occurred during events D6 on April 8th and the long-duration D8 event of April 15-17. As of late March, dust layers observed at Senator Beck Basin were either weak or not present at CODOS sites farther north and east, creating some hope that WY 2013 might be dust-free in parts of the state. Then, dust events D6 and D8 spelled the end to that possibility with significant depositions statewide near the top of the snowpack.
As at all CODOS sites, dust layers D6 and D8 played the principal role in very significantly reducing snowcover albedo in the Rabbit Ears Pass locale as they became exposed, merged, and remained exposed. Melt rates at the Rabbit Ears Pass Snotel site were sometimes briefly high, with merged layers D8/D6 exposed, but periods of unsettled weather and fresh snowfalls disrupted their maximum potential radiative forcing of snowmelt. Those periods of lower solar insolation, because of cloud cover, or higher albedo after fresh snowfalls often slowed or reversed stream flow surging and extended the runoff cycle.
SnowPack & Dust Discussion
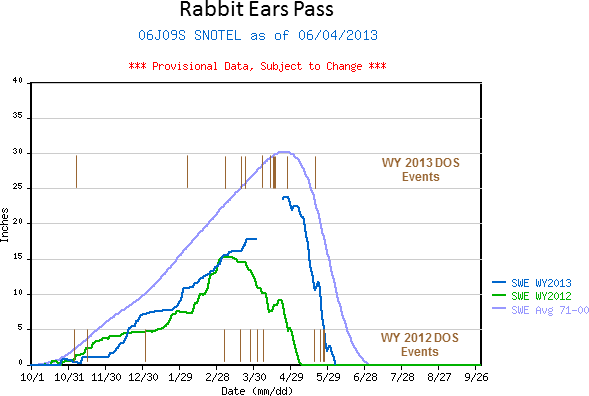
SWE accumulation and ablation for Water Years 2012 and 2013, with dust-on-snow events shown as brown bars, by date (as observed at the Senator Beck Basin Study Area). The long-duration D8 event of April 15-17, 2013, is shown as a heavier bar. Note that not all dust layers observed at Senator Beck Basin were also found at other CODOS sites.
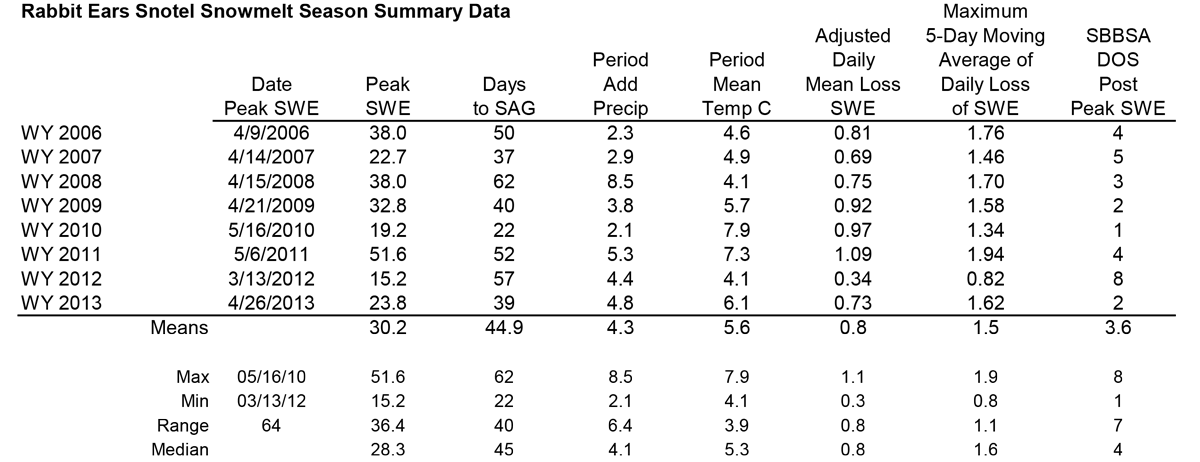
Snowpack formation at the Rabbit Ears Pass CODOS site and nearby Rabbit Ears Pass Snotel began very poorly, quickly falling well behind WY 2012 and then to extremely low levels barely within or outside the historic range of SWE values for the site. A period of stormy weather and SWE gains in December (CSAS Storms #4-8) pushed SWE ahead of WY 2012 but still within the lower quartile of the period of record. January saw almost no further gains until snow accumulations finally resumed during late January (CSAS Storms # 10, 11, 12). SWE accumulation proceeded during February and early March at a slightly slower-than-median rate. Despite having logged four dust-on-snow events at Senator Beck Basin by March 18, the March 20, 2013 snow profile at the Rabbit Ears Pass Pass CODOS site found only a single faintly discernible dust layer, perhaps corresponding to event D4, at that location, raising hopes that (at least) WY 2013 might be virtually dust-free at this northern site. That snow profile found some cold content remaining in the snowpack, at a mean snow temperature of -3.9° C.
Then, on April 8/9 a storm (CSAS Storm #19) delivered both fresh snow as well as dust event D6, clearly present in the April 12 snow profile (perhaps merged with layers D5 and D4). That profile presented a much warmer snowcover, virtually isothermal at a mean temperature of -0.6° C. Also observed was clear evidence of a recent snowmelt episode in and below the former snowpack surface containing merged dust layers D6/D5/D4 (since buried in new snow). That melt episode contributed to that recent snowpack warming.
Snotel data were not reported from April 2 to April 22. However, subsequent snow profiles showed that a winter storm on April 14/15 (CSAS Storm #20) delivered additional snow as well as the long-duration D8 dust event. By late April, SWE accumulation was just below median levels.
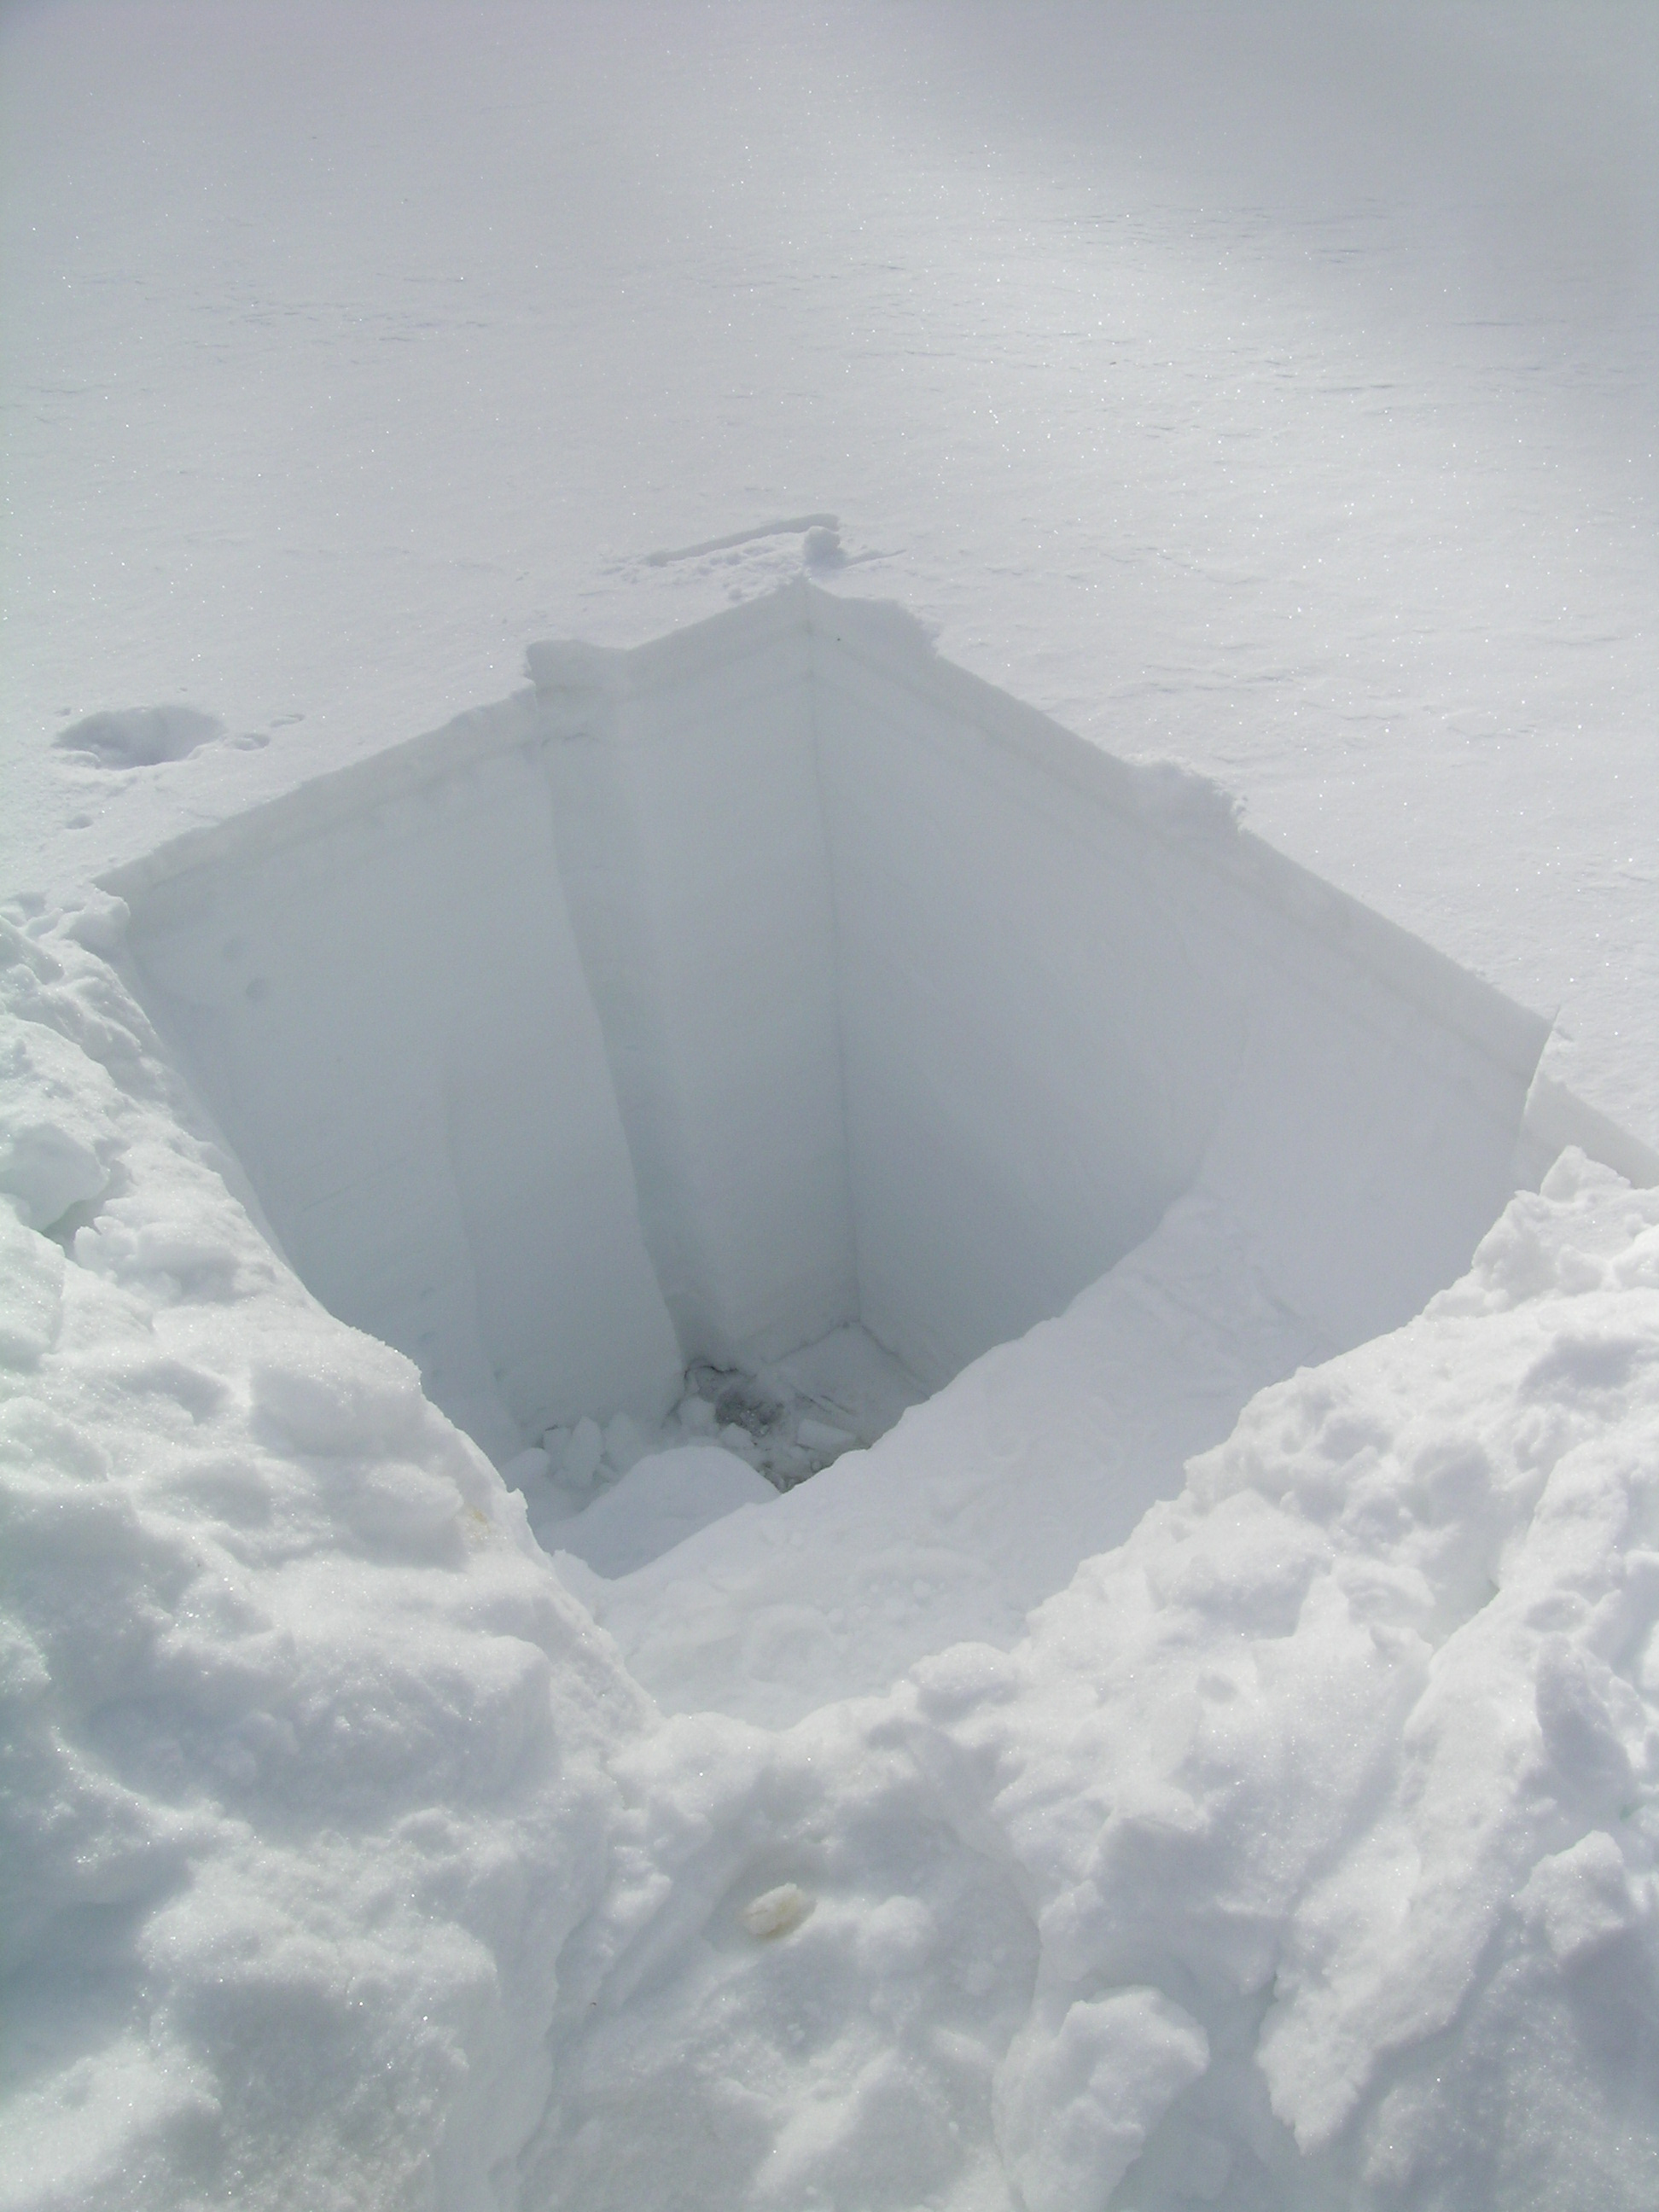
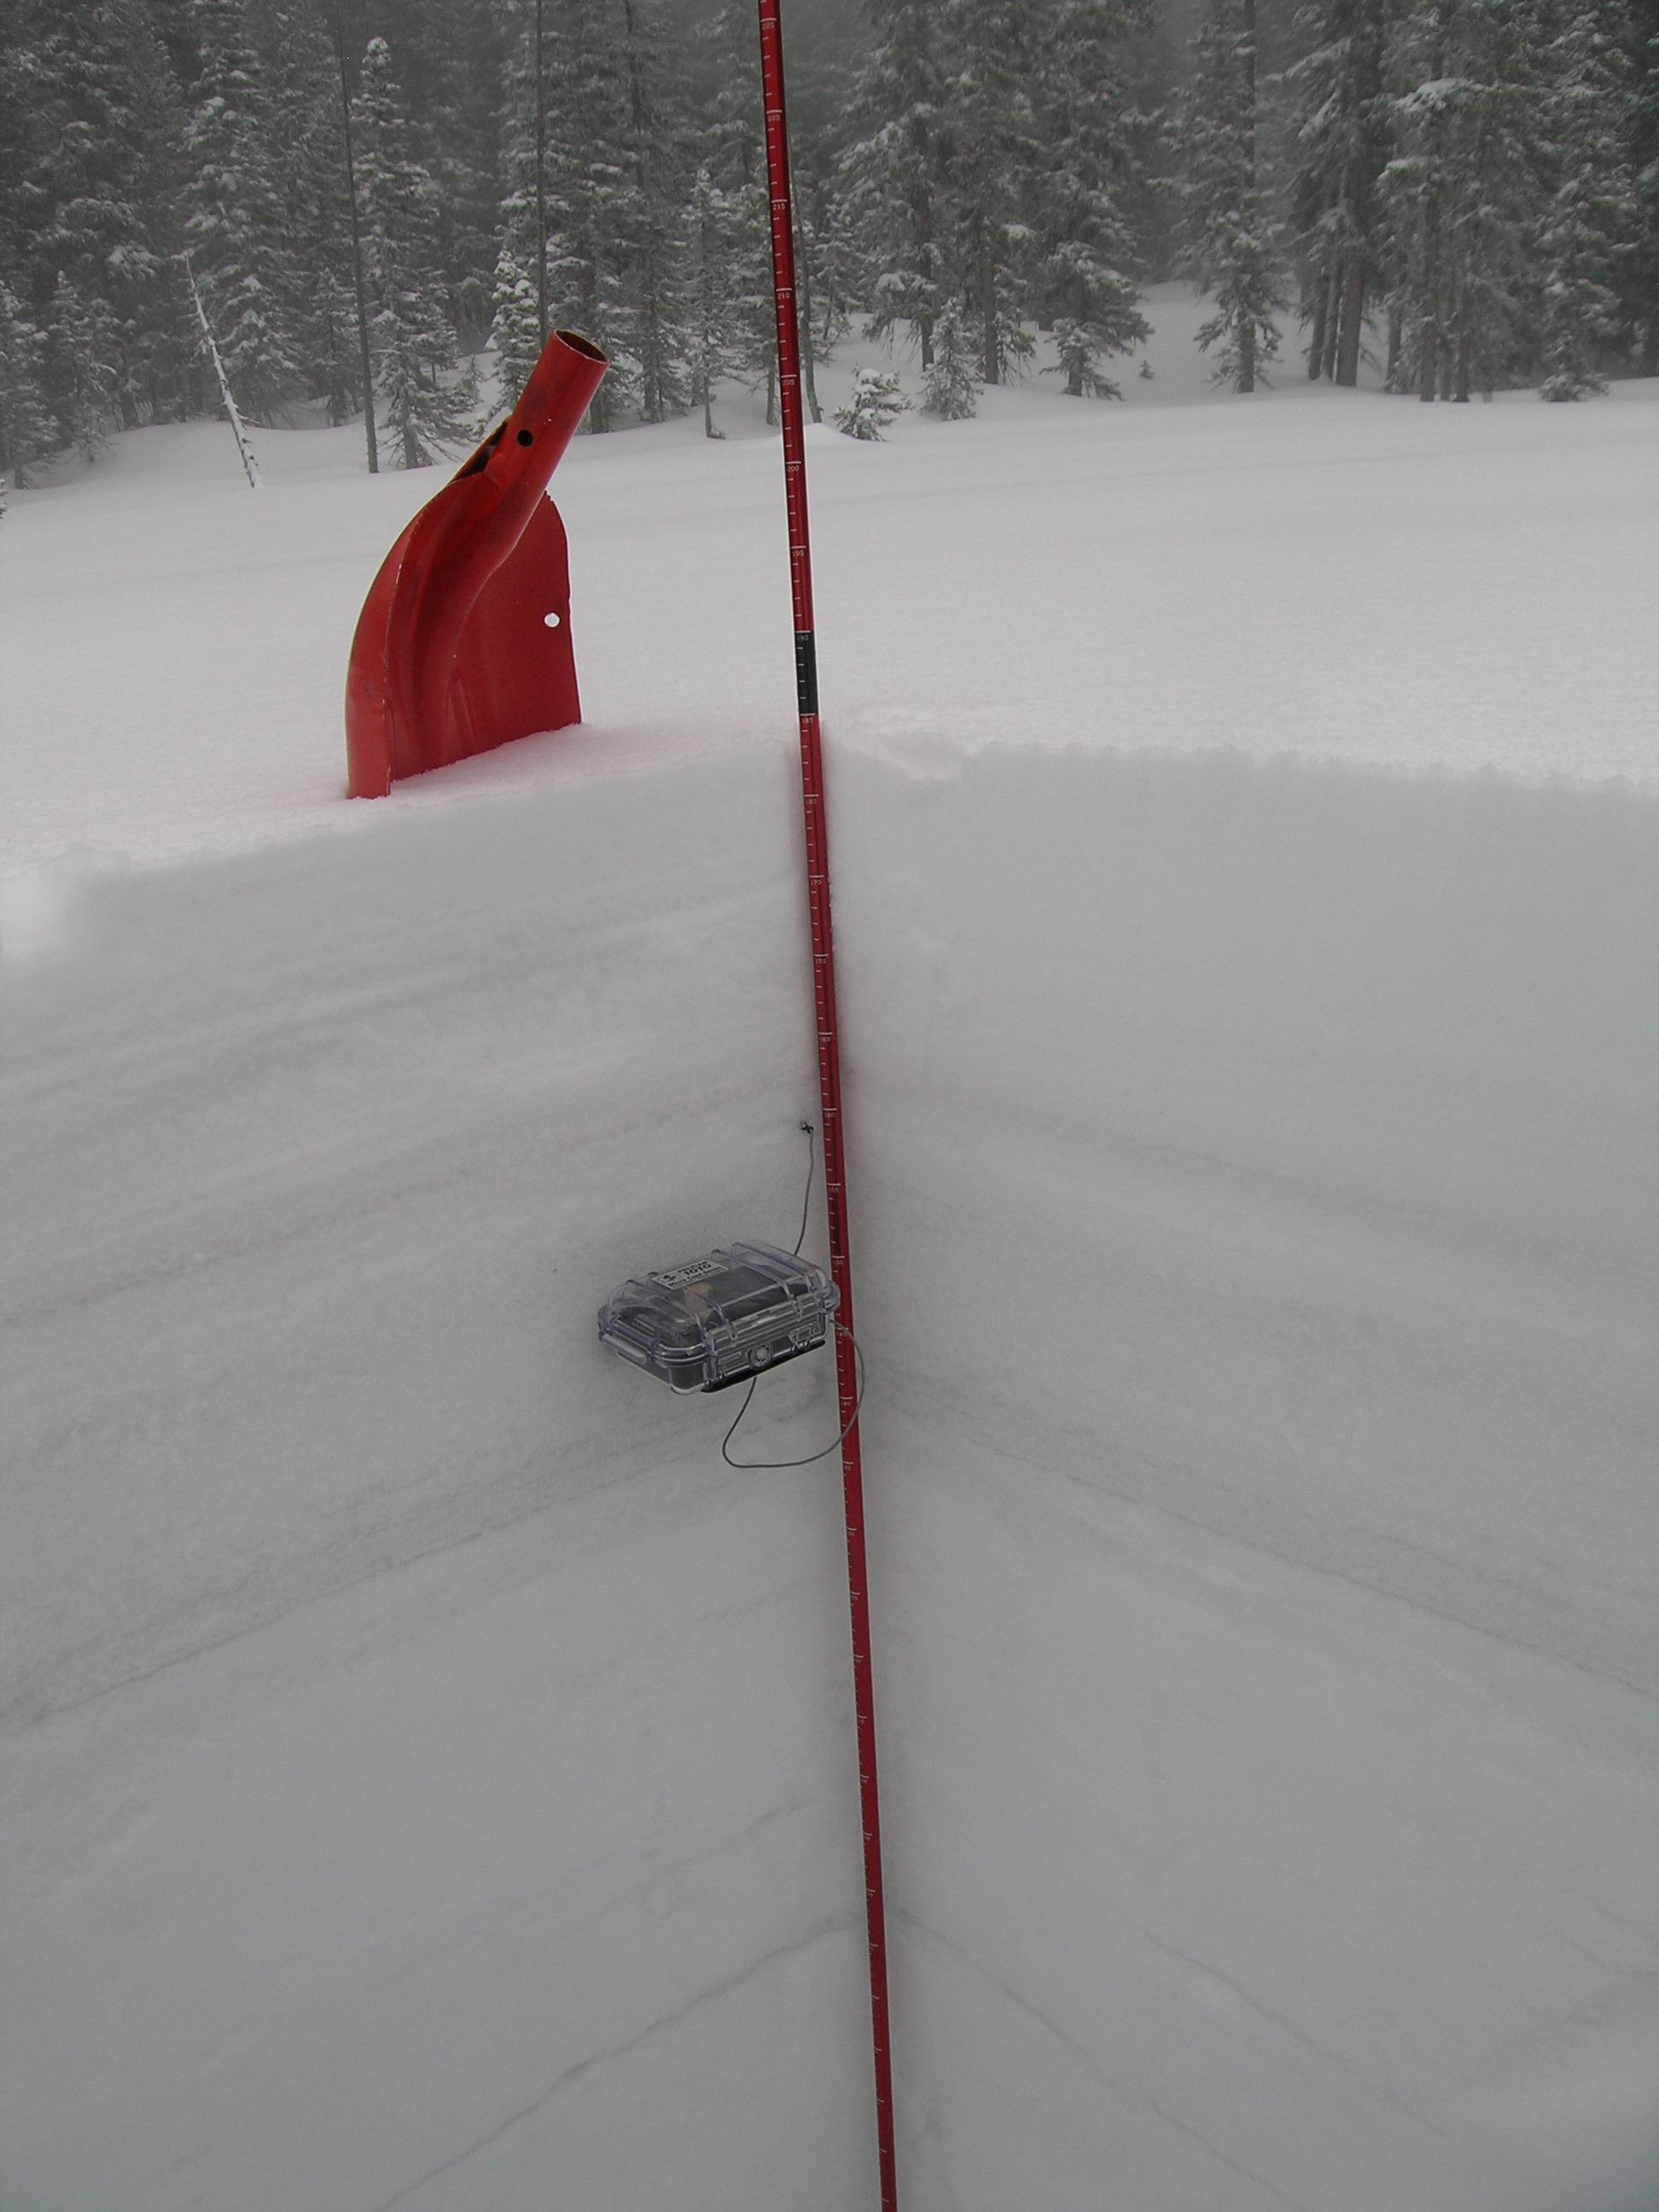
A final May 11 site visit found an isothermal and extremely “tough” snowpack. Overnight radiant cooling had refrozen the surface. Merged dust layers D8/D6/D5/D4 were exposed throughout the Rabbit Ears Pass plateau and on its flanks. Those merged dust layers had clearly been exposed for a period of time, forcing rapid surface melt and thoroughly wetting the entire snowpack. A concentrated sample of those merged dust layers was collected on a thawed south-facing slope near the CODOS site for chemical and other analyses by USGS.
Peak SWE at the Rabbit Ears Pass Snotel occurred on April 26 at 23.8”, 8.6” higher than the WY 2012 peak and only 2.3” short of the median peak SWE value of 26.1”. Peak SWE WY 2013 was two days earlier than the median date of Peak SWE (April 28) but over six weeks later than peak SWE in WY 2012. Snowpack ablation quickly followed peak SWE and reached “snow all gone” (SAG) on June 4.
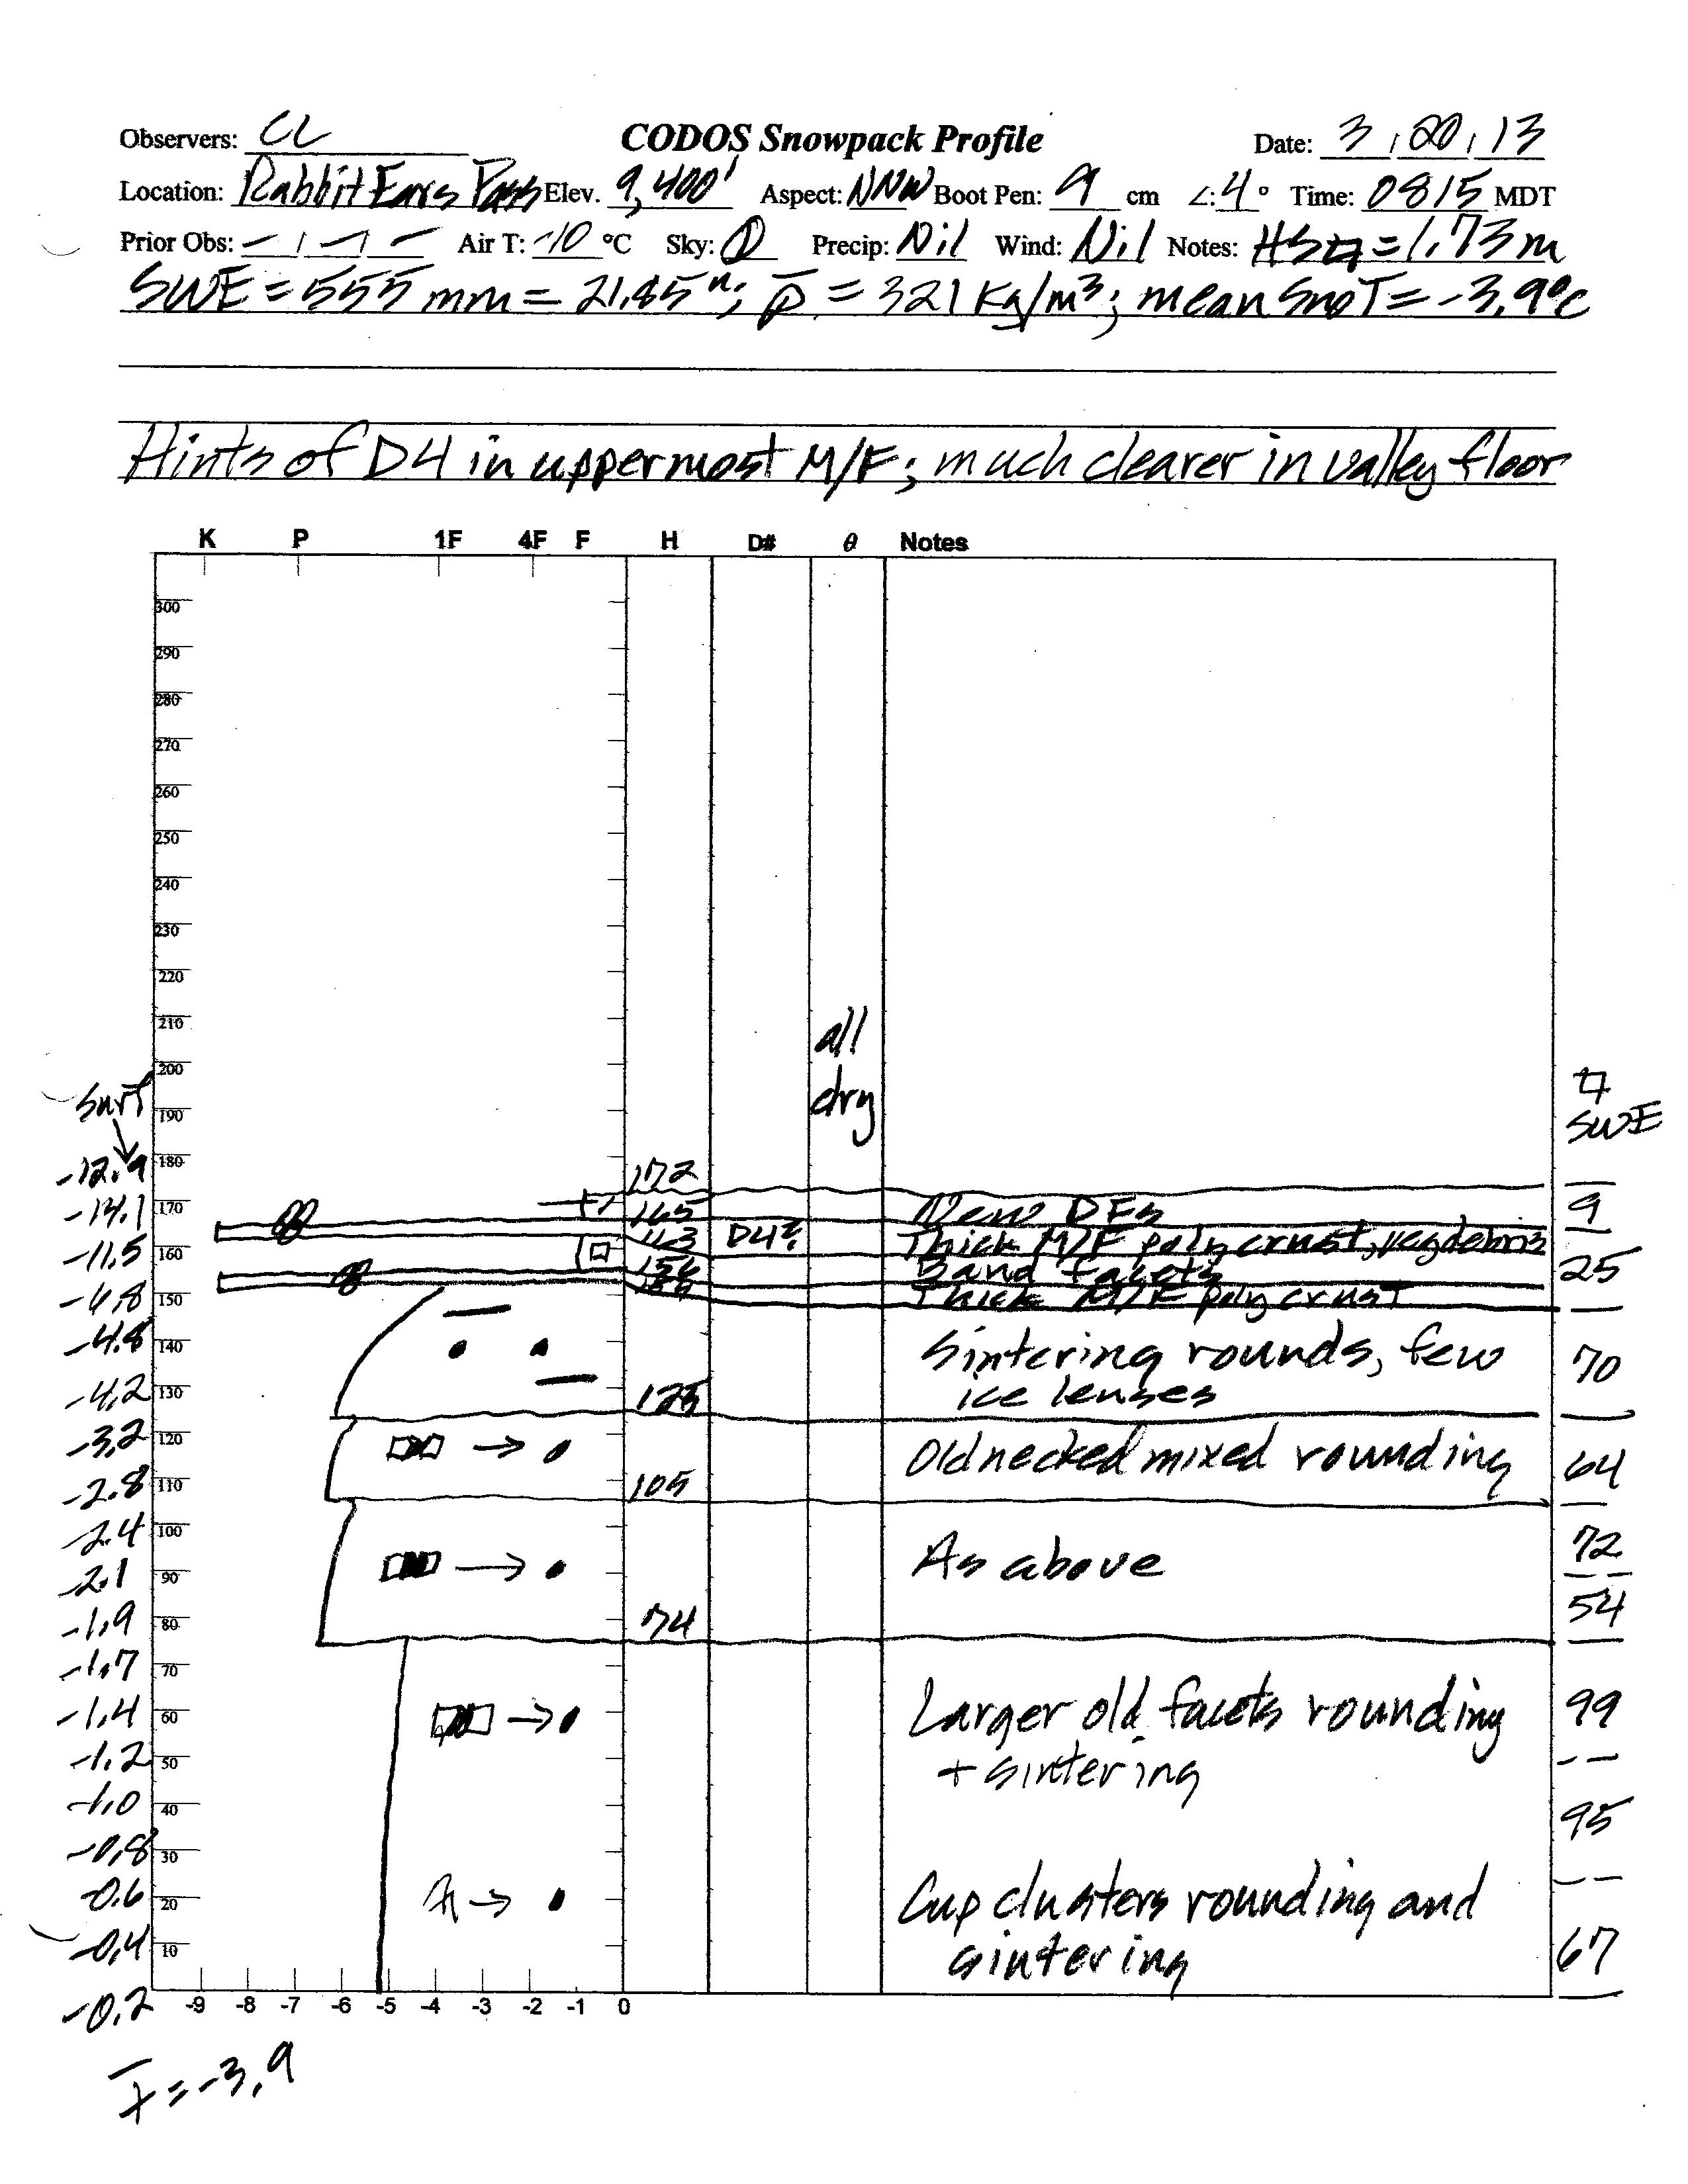
The March 20, 2013 snow profile at the Rabbit Ears Pass CODOS site. Only a very faint layer likely
representing
dust
event D4 was visible in the snow pit. Snow temperatures were cool at a mean of -3.9° C.
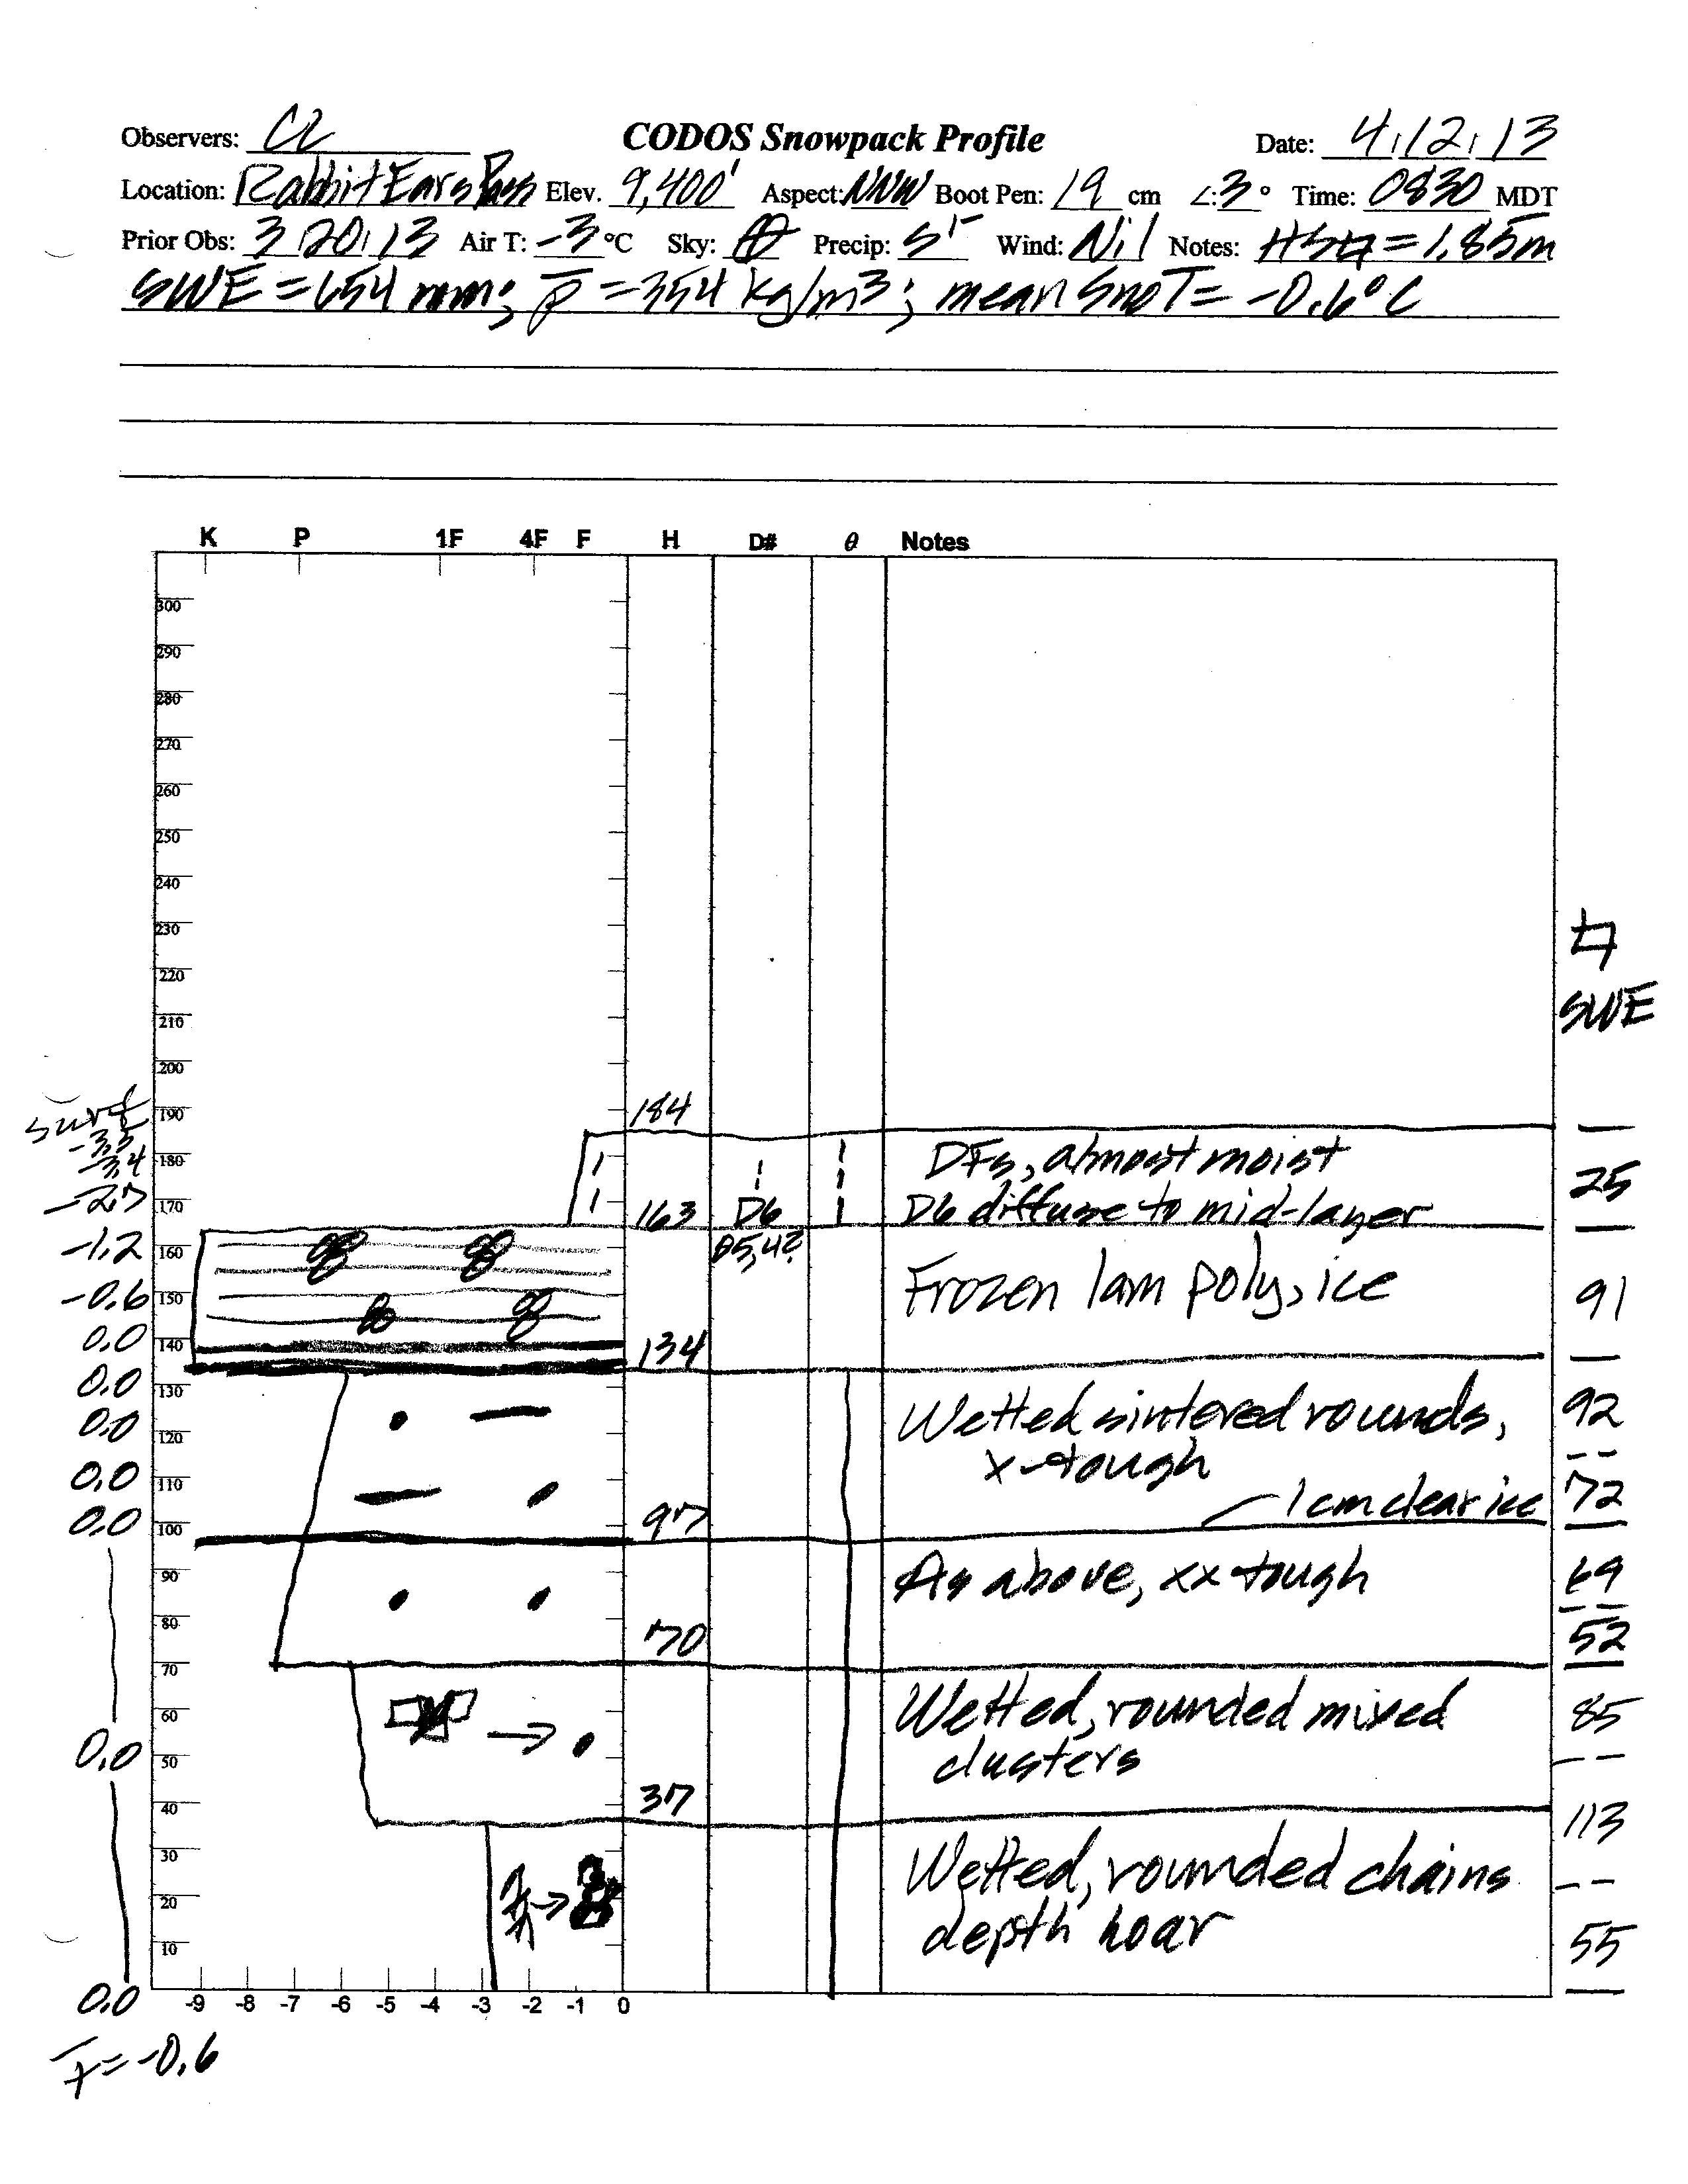
On April 12 dust layer D6 was strongly present in the Rabbit Ears pass CODOS site snow profile, buried 8” below the surface. D6 appeared to have merged with layers corresponding to events D5 and D4. Clear evidence of a surface melt episode was observed in the snow immediately below the merged D6/D5/D4 dust and snow temperatures had warmed from a mean of -3.9° C on March 20 to a near-isothermal mean of -0.6° C. All snow below the merged dust was at 0.0° C.

Snowpack ablation was well underway by May 11, with dust layers D8/D6/D5/D4 merged at the snowpack surface. The snowpack was effectively isothermal. A concentrated sample of merged layers D8-D5 dust was collected that day near the Rabbit Ears Pass CODOS site, at a more south-facing site where surface thaw was underway. That sample is undergoing chemical and other analyses by USGS.
Melt Rate
As was the case at Senator Beck Basin, layers D8 and D6 were the dominant dust-in-snow features in the Rabbit Ears Pass locale. Even though the heavy dust layers D8 and D6 were deposited high in the snow column, they were subsequently buried by additional clean snow and somewhat slow to emerge following peak SWE. Even once emerged, additional periods of unsettled weather sometimes reduced the maximum potential radiative forcing effects of the merged D8/D6 dust layers. Nonetheless, the snowpack ablation period was somewhat advanced, compared to the median for the site, until the final few days.
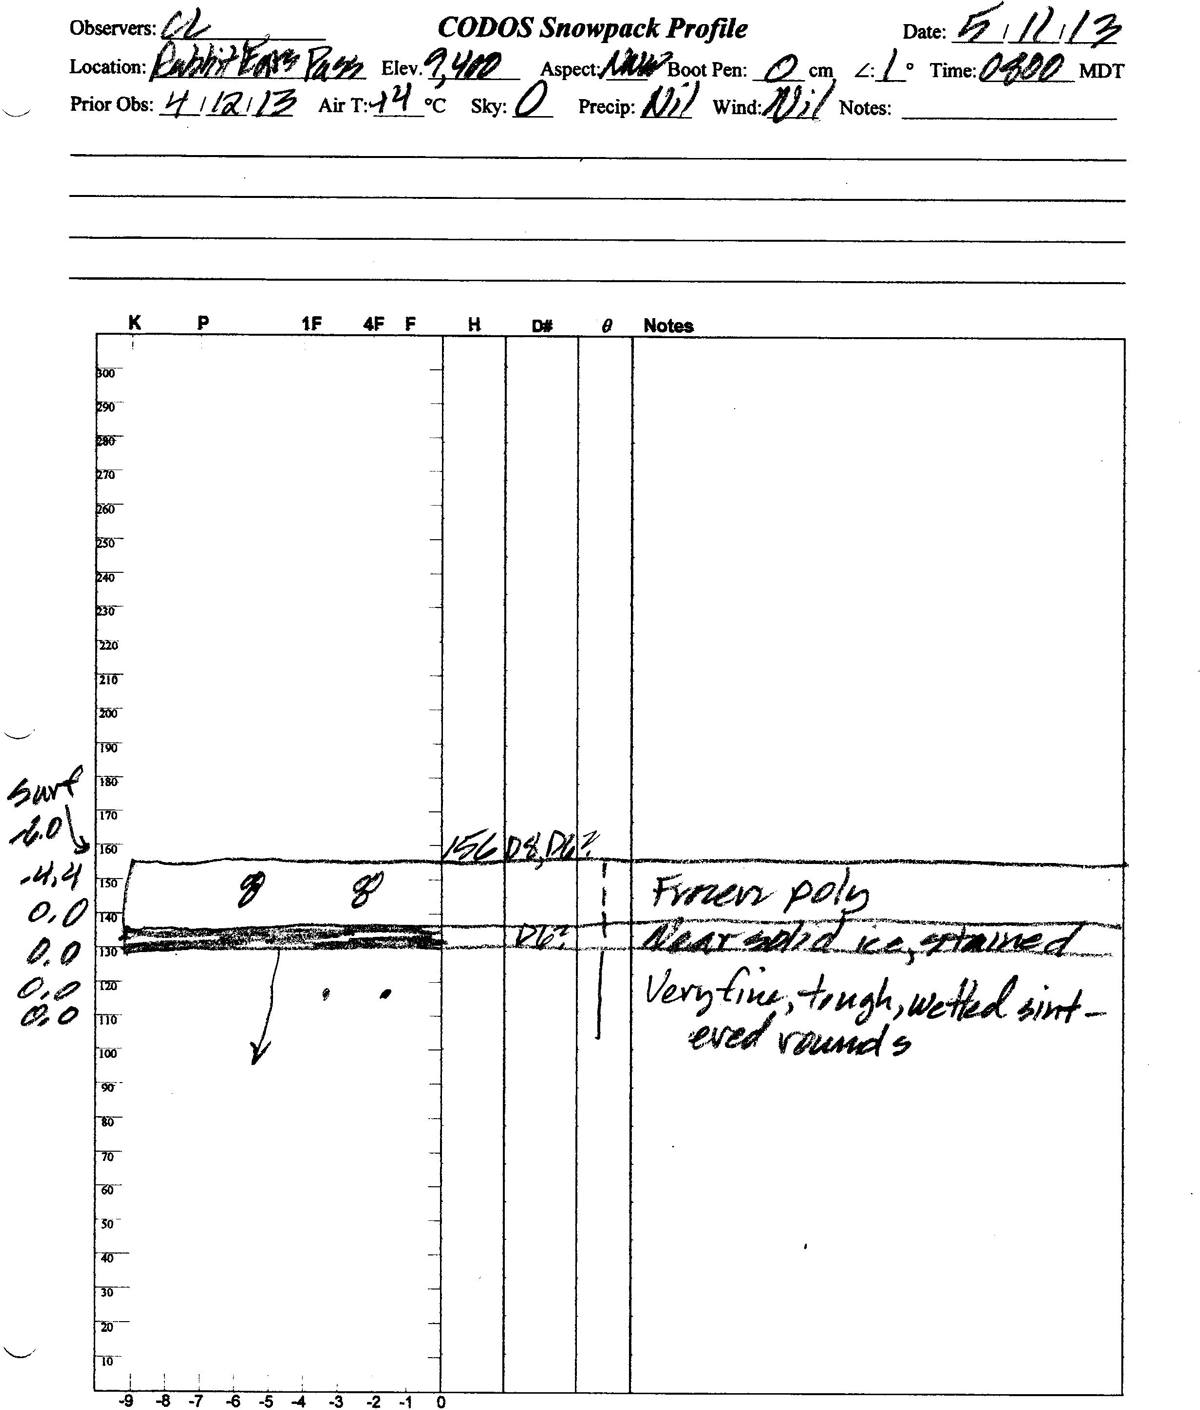
Analysis of the nearby Rabbit Ears Pass Snotel data for Water Years 2006-2013 snowmelt seasons showing date and quantity of peak SWE, days from peak SWE to “snow all gone” (SAG), total additional precipitation after the date of peak SWE, an “adjusted” mean daily rate of snowmelt adding the additional precipitation to the peak SWE total, the maximum five-day moving average of daily melt, and the mean air temperature over the entire snowmelt period, from peak SWE to SAG. The Rabbit Ears Pass Snotel site is substantially shaded by surrounding forest.
Following peak SWE at the Rabbit Ears Pass Snotel of 23.8” on April 26, 2013, an additional 4.8” of SWE was added to the snowpack during the ablation cycle for an adjusted total of 28.6” of SWE available to melt. Aided by the intensity of radiative forcing produced by merged dust layers D8 and D6, and under substantially warmer mean air temperatures than in spring 2012, when most snowmelt occurred in March, snowpack ablation to SAG took 39 days. Spring 2013 melt rates were as high as 2.0” SWE loss per day and the mean daily SWE loss over the entire snowmelt period was 0.73” per day, over double the rate in spring 2012.
Given the substantial precipitation following peak SWE, interruptions in radiative forcing described above were more frequent at the Rabbit Ears Pass site than at other CODOS sites where peak SWE occurred later. As a result, the maximum 5-day moving average daily melt rate was 1.62” SWE loss per day, somewhat lower than Water Years 2006 and 2008. SAG occurred at the Rabbit Ears Pass Snotel on June 4, very near the median date of SAG. In spring 2012, a lighter dust year, an adjusted total of 19.6” of SWE available for melt was ablated to SAG in 57 days at a mean rate of 0.34” of SWE loss per day.
WY 2013 SWE accumulation and ablation at the Rabbit Ears Pass Snotel station, with upper and lower quartiles of period of record shown in light grey, middle quartiles in dark grey, and the median trace for the period of record shown as a dashed line.
Stream Flows
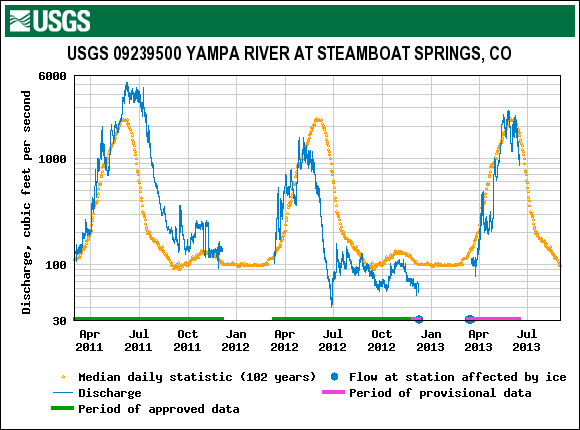
Comparison of WY 2011, 2012 and 2013 (in progress) hydrographs for the USGS Yampa River At Steamboat Springs gauge highlights variations in snowmelt runoff timing and volume over those three seasons. WY 2011 snowmelt runoff in the Yampa River watershed began a little bit early and oscillated as dust-in-snow was alternately exposed and reburied under relentless spring storms. Eventually, flows surged strongly to a far above-average peak somewhat later than the average date of peak discharge, as dust finally emerged and remained exposed. Flows then remained high for an extended period, well above median values on the descending limb, and remained well above median levels throughout the summer.
WY 2012 snowmelt runoff also began with a very strong surge as the gauge came on line, to well above median levels. Flows then oscillated but generally rose, closely tracking with median values. However, the very poor snowcover was quickly consumed. Very early peak flows fell well short of median values and then quickly declined at the end of snowmelt runoff, just when normal peak flow would occur. WY 2012 total snowmelt runoff yields were very far short of average yields.
This season, thanks to stormy March and April weather, onset of snowmelt runoff in the Yampa River watershed was slightly delayed past median timing. Once underway, flows at the gauge quickly reached median levels. As of this writing (June 17, 2013), the Yampa River has surged to an above-average peak with near-average timing and begun the descending limb. With summer solstice approaching, sustained radiative forcing of snowmelt in the merged D8/D6 dust is likely to maintain very high melt rates in the remaining snowcover in the Yampa River watershed until all snowcover is ablated. As a result, WY 2013 may produce a steeper-than-normal descending limb on the Yampa River At Steamboat Springs gauge hydrograph.