 Water Year 2013 CODOS Summary for McClure Pass
Summary | Snowpack | Melt Rate | Stream Flows
Summary
Water Year 2013 entered late winter with dismal snowpack development at ten of eleven CODOS dust-on-snow monitoring sites, Willow Creek Pass being the single exception. Through March 2013, snowpack SWE totals at all other sites resembled or even fell short of the very dry winter of WY 2012, raising concerns about back-to-back drought seasons. That broadly consistent spatial pattern in scant precipitation began to diverge in April, 2013. CODOS sites in the northern Front Range and Colorado River headwaters benefitted most from a series of April and May winter storms that augmented snowpacks and eventually resulted in average or even above average peak SWE levels on average or later-than-average dates. In the southwestern mountains, fewer and/or smaller April/May storms failed to offset the dry beginning to WY2013 winter. CODOS sites in the San Juan Mountains experienced, for the second year, substantially sub-par peak SWE values, on near-average dates. In between, the Central Mountains, Grand Mesa, Park, and northern Gore ranges came closer to but still fell short of average snowpacks. The McClure Pass CODOS site was among the latter sites, falling short of average peak SWE, in a ‘double peak’ straddling the average date of peak SWE, and only slightly exceeding peak SWE in WY 2012. The nearby Schofield Pass Snotel, on the other hand, recorded a substantially higher peak SWE this season than in WY 2012, on a near-average date.
At the CSAS Senator Beck Basin Study Area at Red Mountain Pass, the primary CODOS monitoring site, WY2013 produced a total of ten separate dust-on-snow events, a lower total count than in the past three seasons. However, the actual mass of dust deposited at Senator Beck Basin in WY 2013 was greater than in any prior season, including the “Martian Winter” of WY 2009. Dust season began at Senator Beck Basin in November with a single event, February and March delivered four additional events, but the vast majority of dust deposition occurred during events D6 on April 8th and the long-duration D8 event of April 15-17. As of late March, dust layers observed at Senator Beck Basin were either weak or not present at CODOS sites farther north and east, creating some hope that WY 2013 might be dust-free in parts of the state. Then, dust events D6 and D8 spelled the end to that possibility with significant depositions statewide near the top of the snowpack.
As at all CODOS sites, dust layers D6 and D8 played the principal role in very significantly reducing snowcover albedo at McClure Pass, and in the Schofield Pass locale, as they became exposed, merged, and remained exposed. Although dust-enhanced melt rates were sometimes high, periods of unsettled weather and fresh snowfalls frequently interrupted those periods of radiative forcing, slowing or reversing stream flow surging and more effectively prolonging the runoff cycle in the higher elevation, north-facing Crystal River watershed than in the lower elevation, southwest facing Muddy Creek watershed.


SWE accumulation and ablation for Water Years 2012 and 2013, with dust-on-snow events shown as brown bars, by date (as observed at the Senator Beck Basin Study Area). The long-duration D8 event of April 15-17, 2013, is shown as a heavier bar. Note that not all dust layers observed at Senator Beck Basin were also found at other CODOS sites.
SnowPack & DUST Discussion
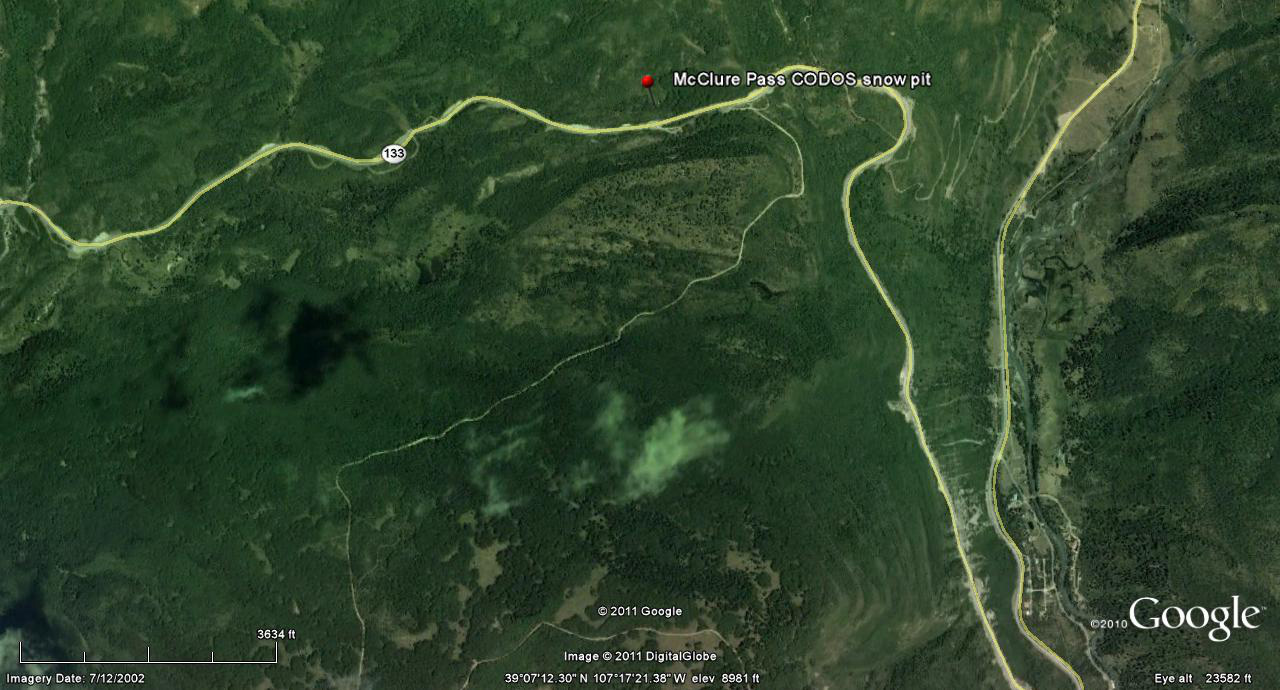
Snowpack formation at McClure and Schofield Passes began late, in early November, soon stalled for nearly a month, and then resumed in mid-December. Following a sharp rise in SWE during a period of stormy weather at the end of December (CSAS Storms #4-8), snowpack formation once again stalled during early and mid-January before another series of storms produced improvement (CSAS Storms #10, 11, and 12). Still, Feb 1 SWE values were well below the median at both Snotels and closely matched those of WY 2012. Dust layer D2 was deposited overnight on February 8/9, with snow (CSAS Storm #13), and was clearly seen in our March 20, 2013 snow profile at the McClure Pass CODOS snow pit site adjacent to the Snotel.
SWE accumulation continued at a near-median rate during much of February but fell behind the median rate of accumulation during the first half of March. The McClure Pass Snotel recorded a ‘first peak’ in SWE of 13.8” on March 24 before a short period of SWE losses initiated by exposure of dust layers D4 (March 17/18) and D5 (March 21/22) in conjunction with very warm temperatures sustaining overnight thaw conditions. SWE accumulation resumed on April 8 with a winter storm (CSAS Storm #19) delivering both fresh snow as well as dust event D6, clearly present in our April 13 snow profile. That profile presented an isothermal snowcover, with all snow temperatures at 0.0° C, with very wet snow throughout. During this late March and early April period the much higher Schofield Pass Snotel site either held steady or continued to accumulate SWE.
The McClure Pass Snotel then recorded a second ‘peak SWE’ on April 21 at 13.7”, sixteen days later than the median date of Peak SWE (April 5) and 2.6” below the median peak SWE value of 16.3”. Another winter storm (CSAS Storm #20), coinciding with the long-duration D8 dust event of April 15-17, contributed to that peak SWE. Snowpack ablation quickly followed, initially enhanced by the rapid emergence of dust layer D8 and soon by the merging of layer D8 with layer D6. Snowmelt rates were sometimes rapid and the McClure Pass Snotel recorded “snow all gone” (SAG) on May 15, slightly earlier than the median date of SAG and 22 days later than SAG in WY 2012. The Schofield Pass Snotel recorded a single peak SWE of 30.5” on April 25, nine days later and 3.2” short of the medians for the site.
Our final McClure Pass CODOS site visit on April 30 found our CODOS snow profile site melted out but a shallow, very dirty snowcover remaining next to the Snotel station. For the duration of snowcover, merged dust layers D8/D6 substantially reduced snow albedo, whenever exposed, and produced significant radiative forcing and acceleration of snowmelt at McClure Pass and in the surrounding terrain. See the Melt Rate discussion below.
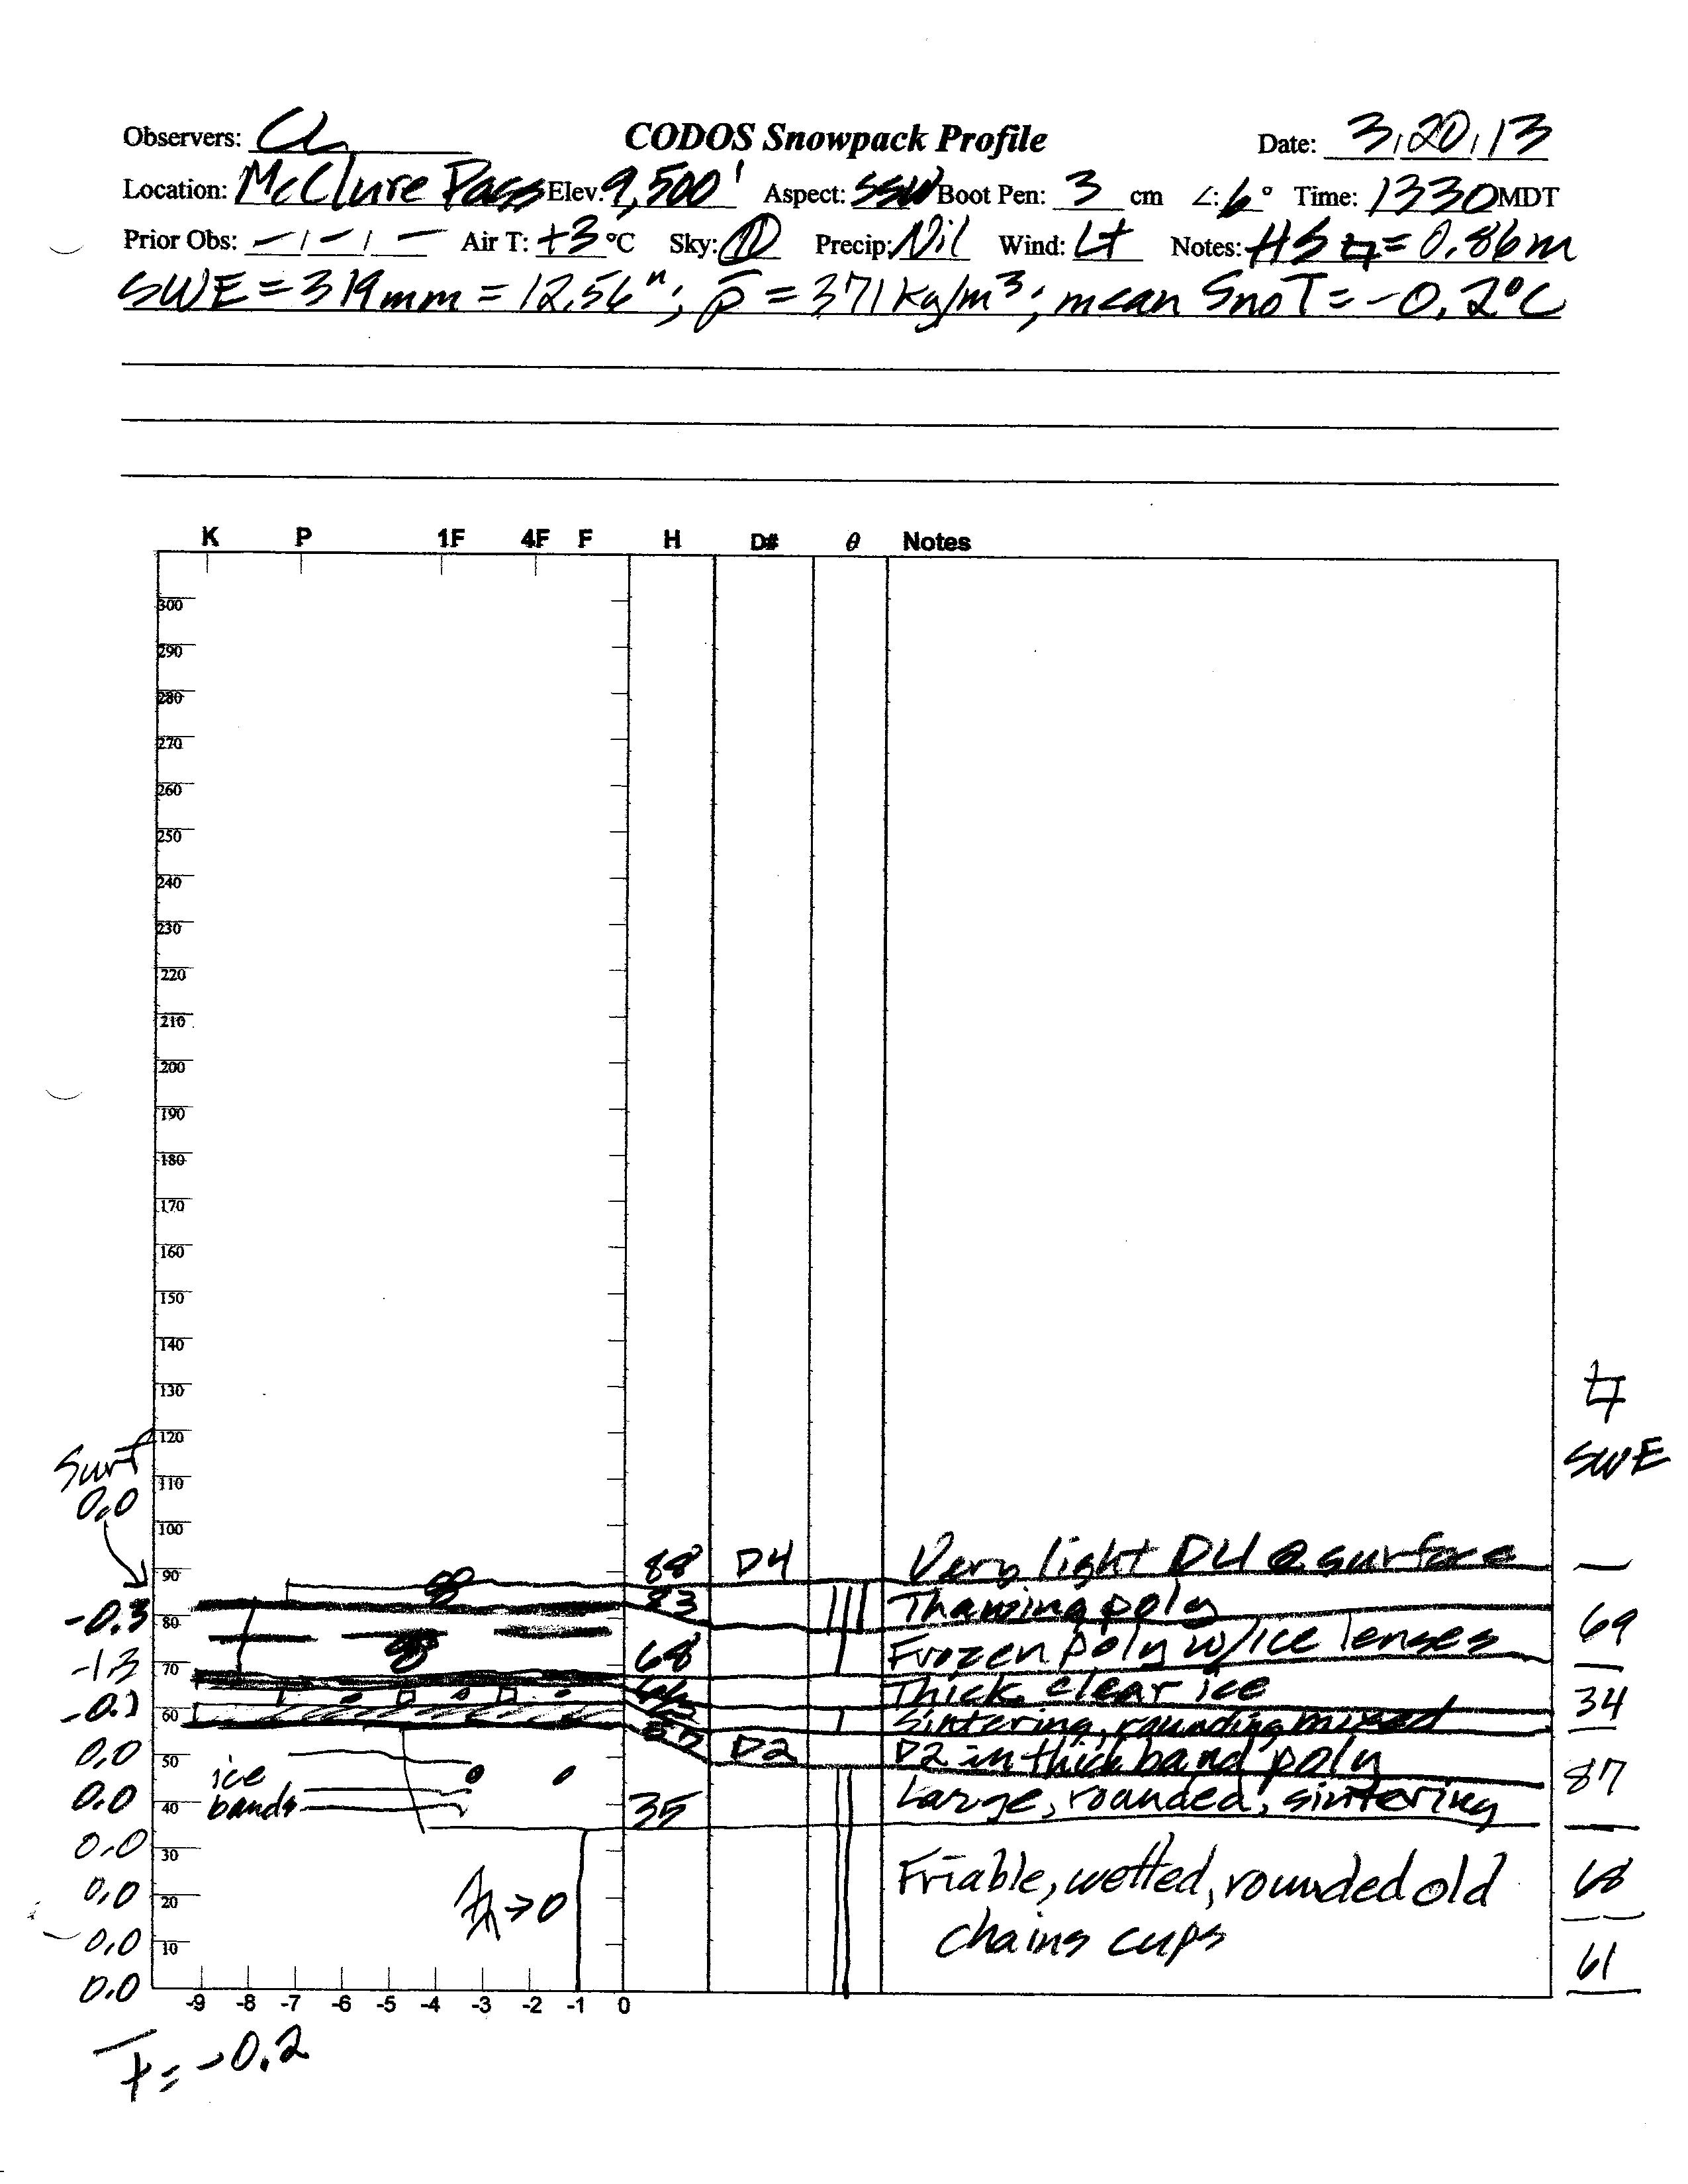
The March 20, 2013 snow profile at the McClure Pass CODOS site. Dust layer D2 was present mid-pack and event D4 was at the surface.
This profile revealed an effectively isothermal snowpack, the first CODOS site to become isothermal.
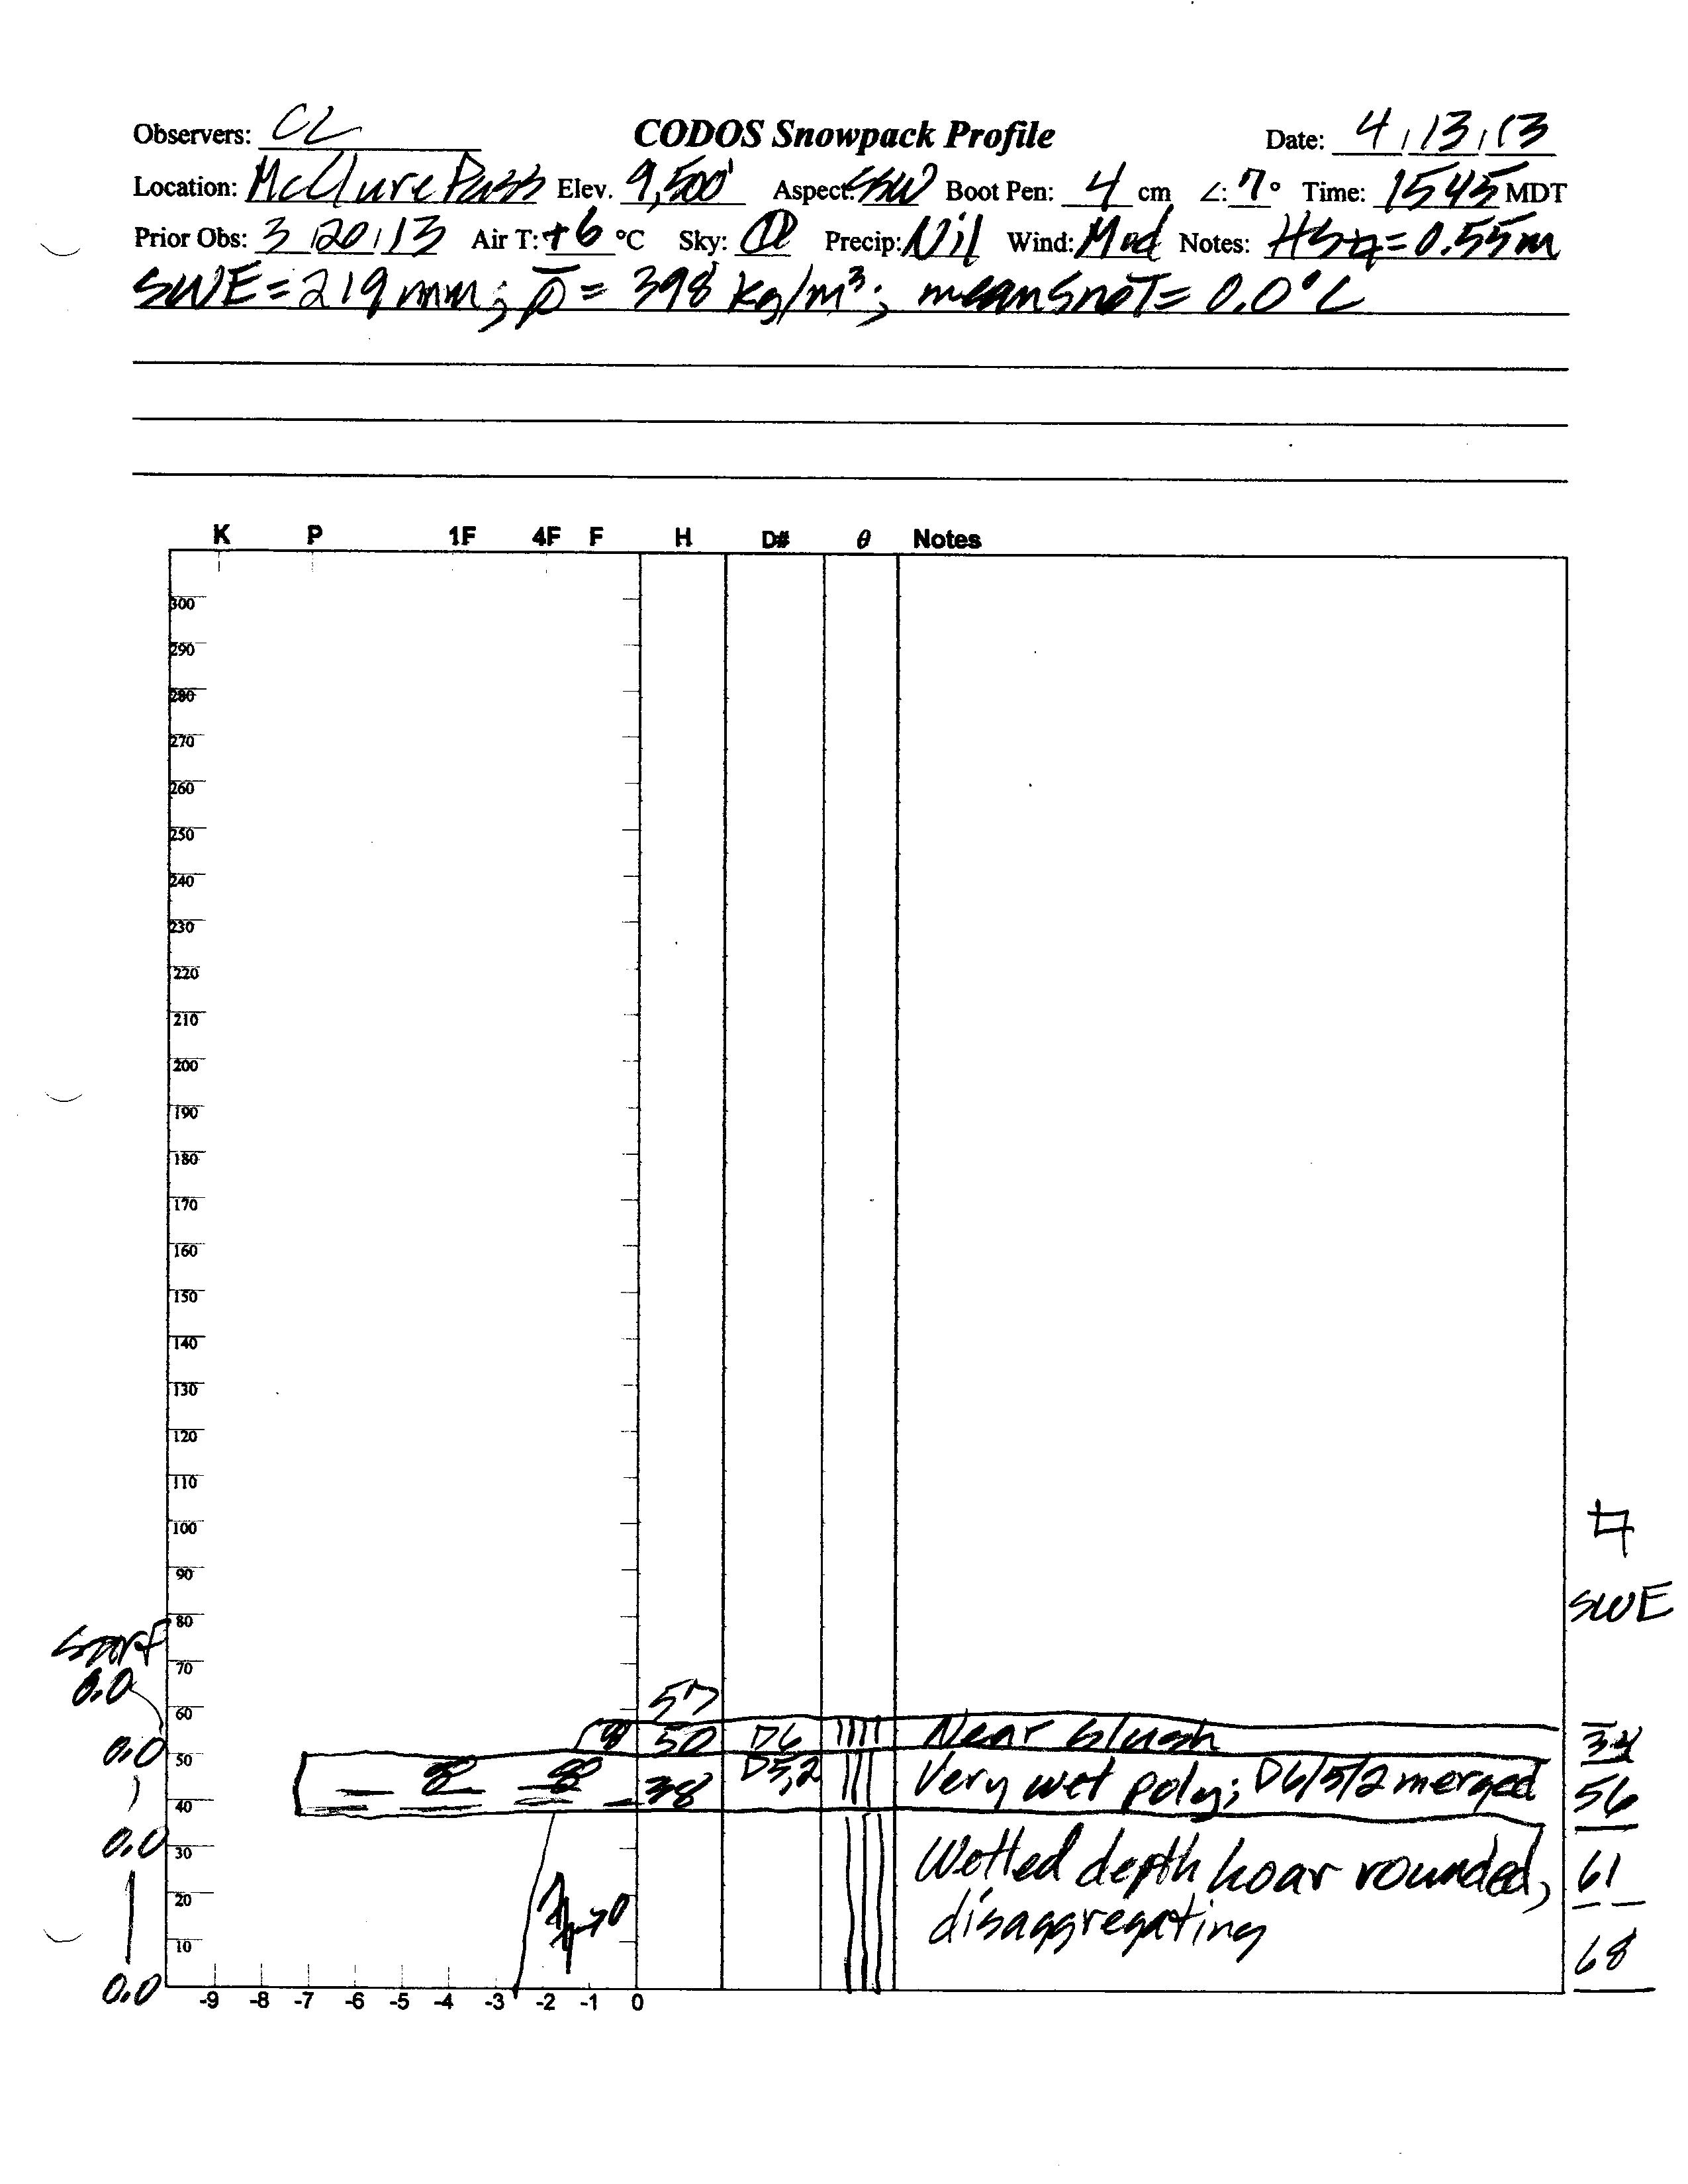
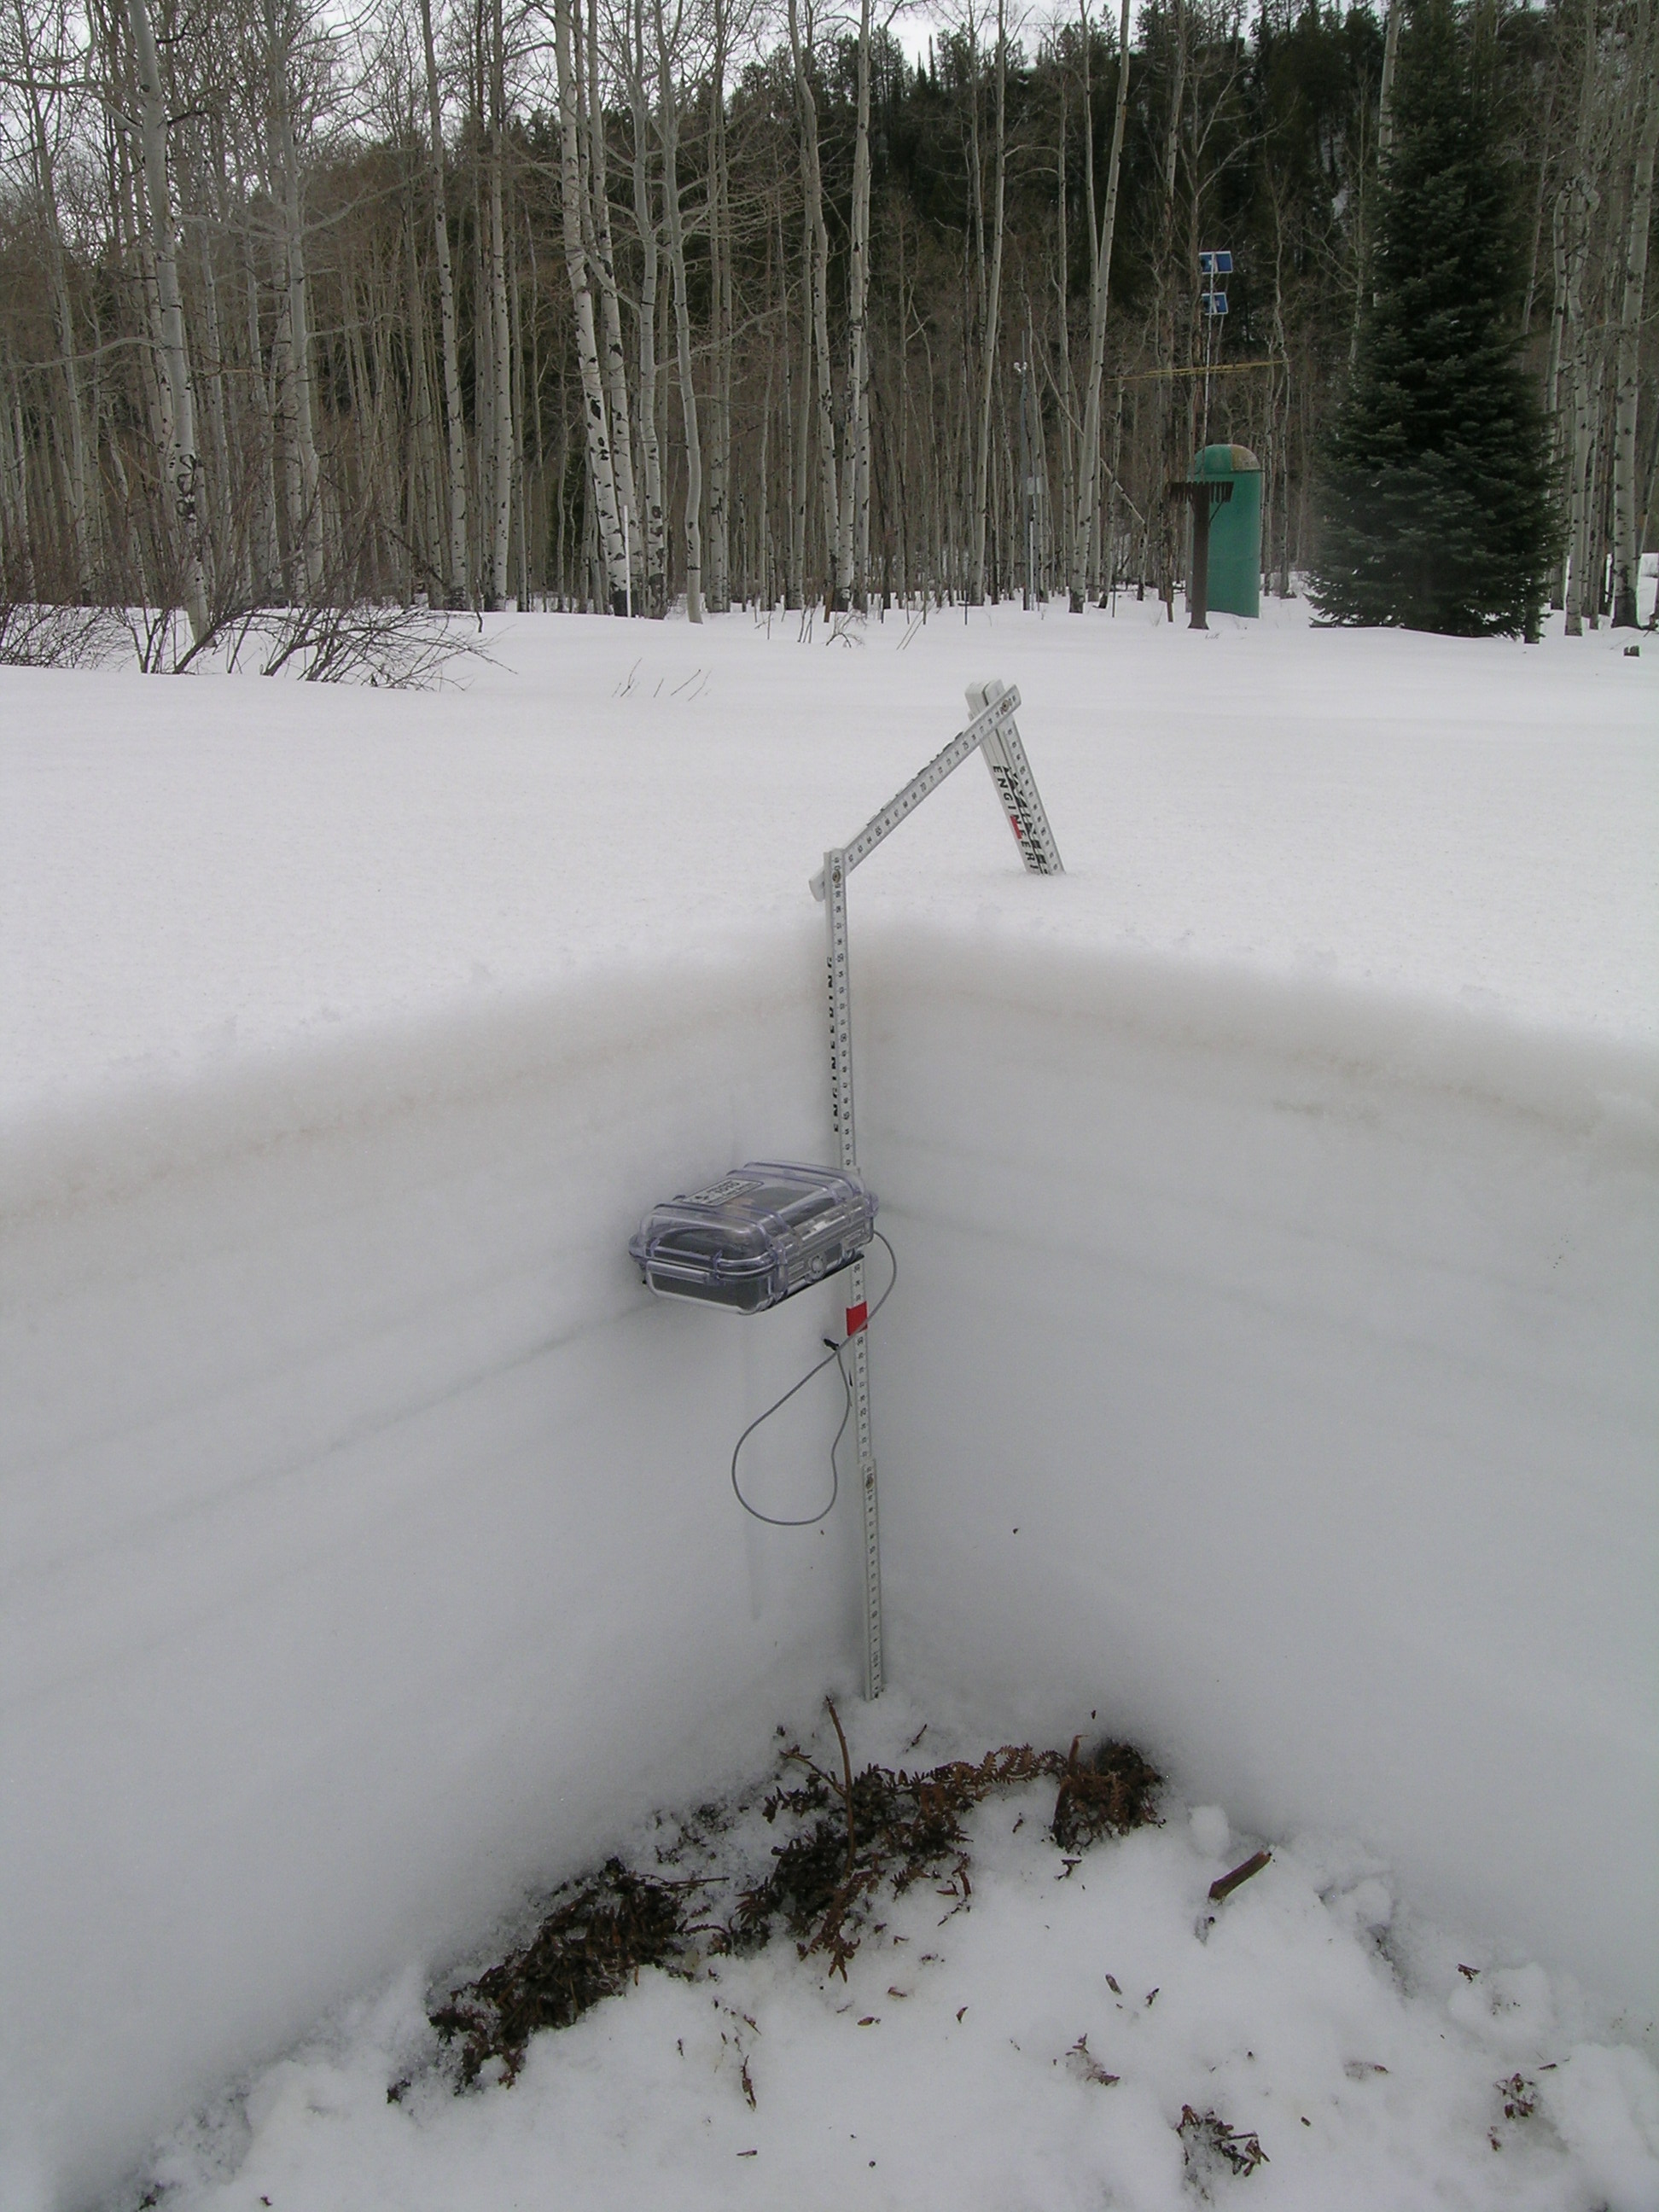
On April 13 dust layer D6 was strongly present, merged with layers D4/5 and D2. Very active snowmelt was underway and the entire snowpack was classified as very wet.
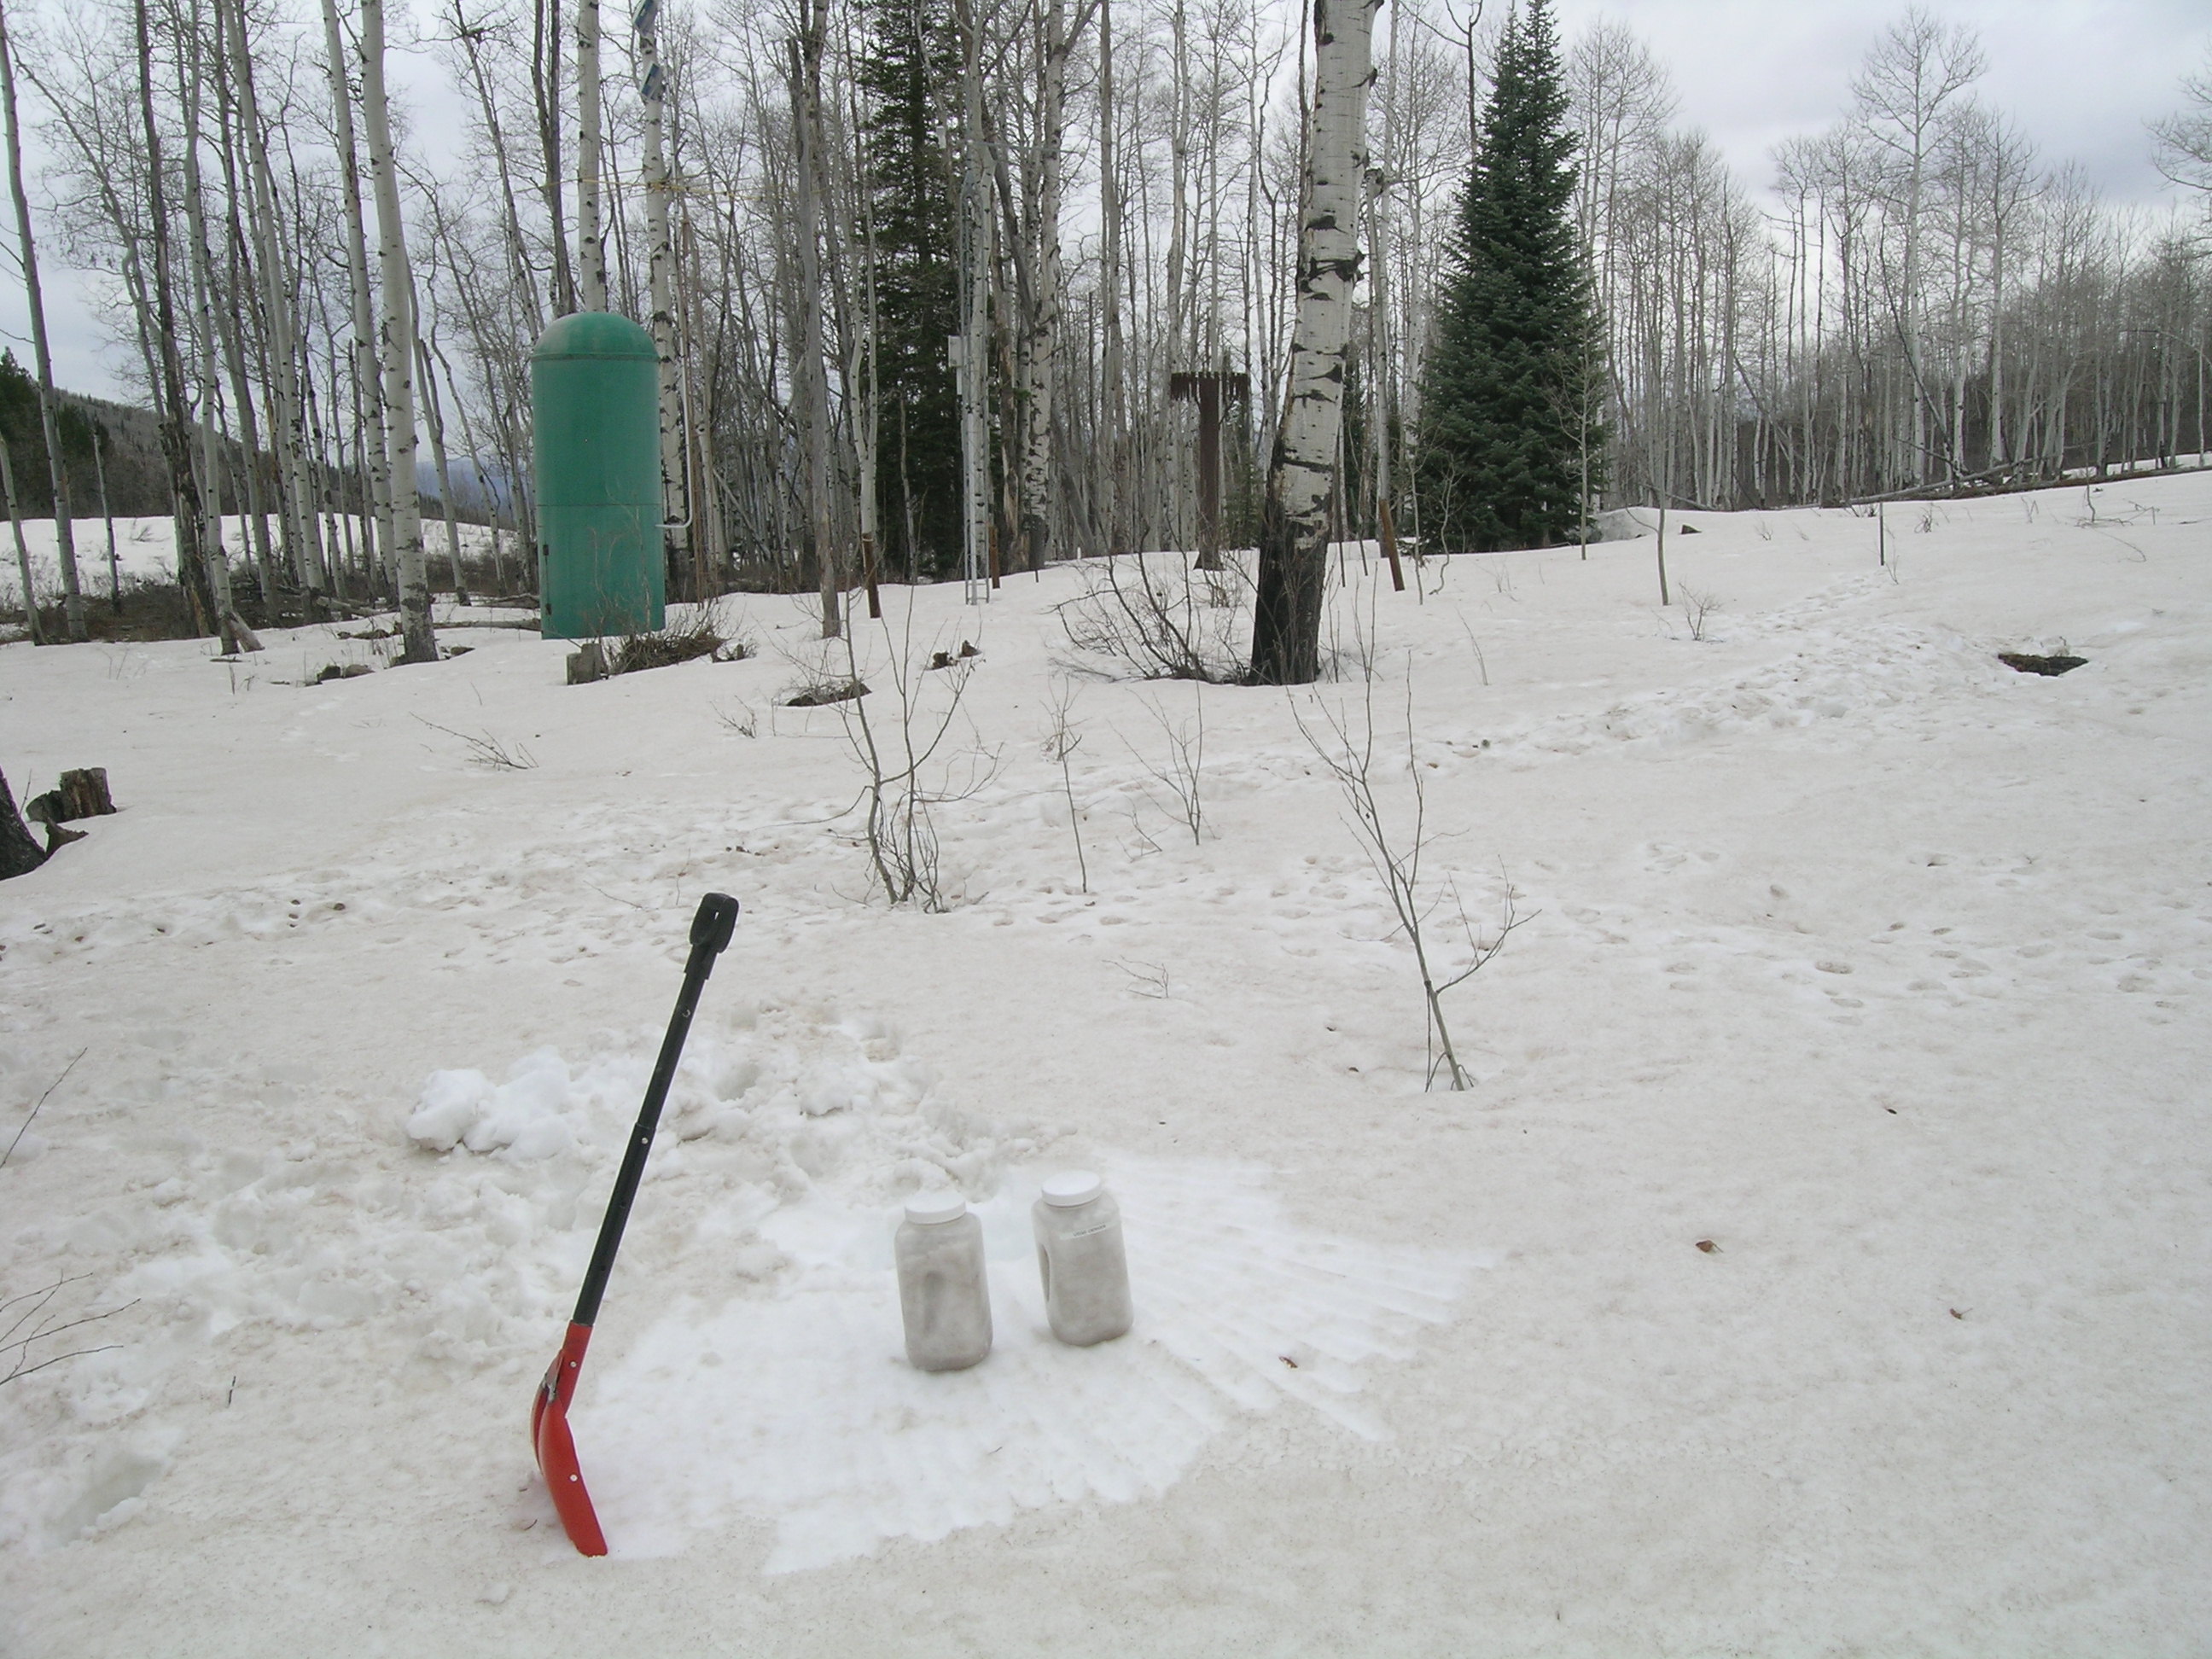
Snowpack ablation and snowmelt runoff was well advanced by early May, with dust layers D8-D2 merged and exposed at the snowpack surface and
the CODOS snow pit site melted off. A concentrated sample of all merged dust layers was collected from the thin remaining snowcover adjacent to the
Snotel station, for chemical and other analyses by USGS.
Melt Rate
As was the case at Senator Beck Basin, dust layers D8 and D6 were the dominant dust-in-snow features in the McClure Pass locale, including the upper Crystal River watershed. Even though those dust layers were deposited high in the snow column, and were quick to emerge following peak SWE, periods of unsettled weather in the McClure Pass locale often reduced the potential maximum radiative forcing effects of the merged D8/D6 (and lower) dust layers. Once merged, those layers did experience short periods of sustained exposure under clear, sunny skies. However, frequent periods of cloud cover often reduced solar insolation onto the exposed D8/D6 layer and/or minor amounts of fresh snow temporarily restored a higher albedo to the remaining snowpack and incrementally slowed melt rates at McClure Pass. These effects on radiative forcing in dust are somewhat mitigated by shading from aspen trees (only) at the McClure Pass Snotel site. The Schofield Pass Snotel site has perhaps slightly better solar access, particularly to the southwest and west.
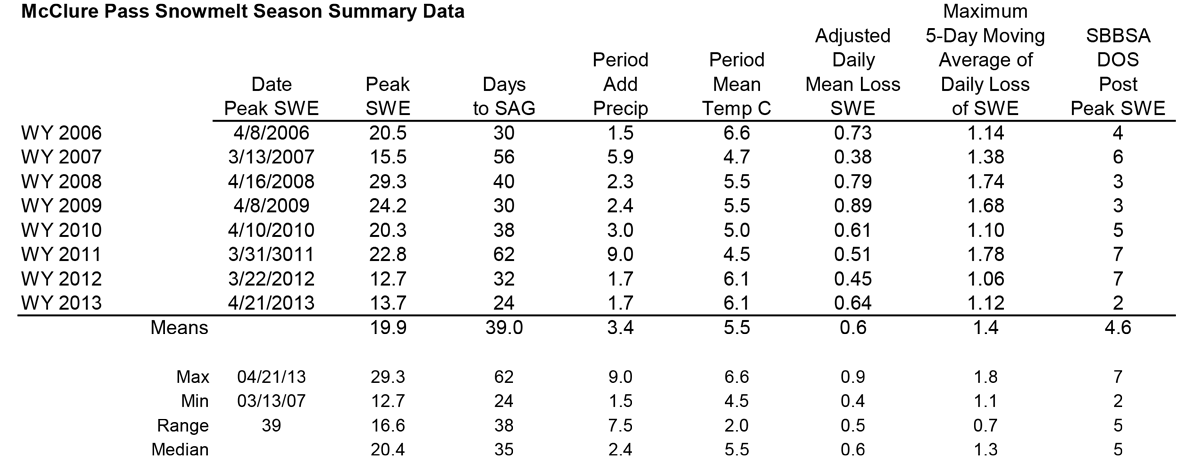
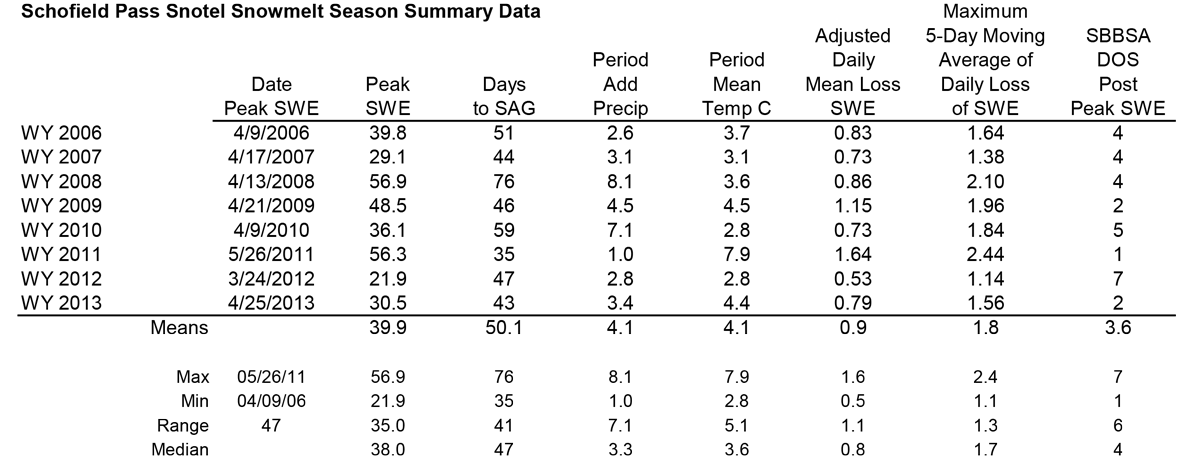
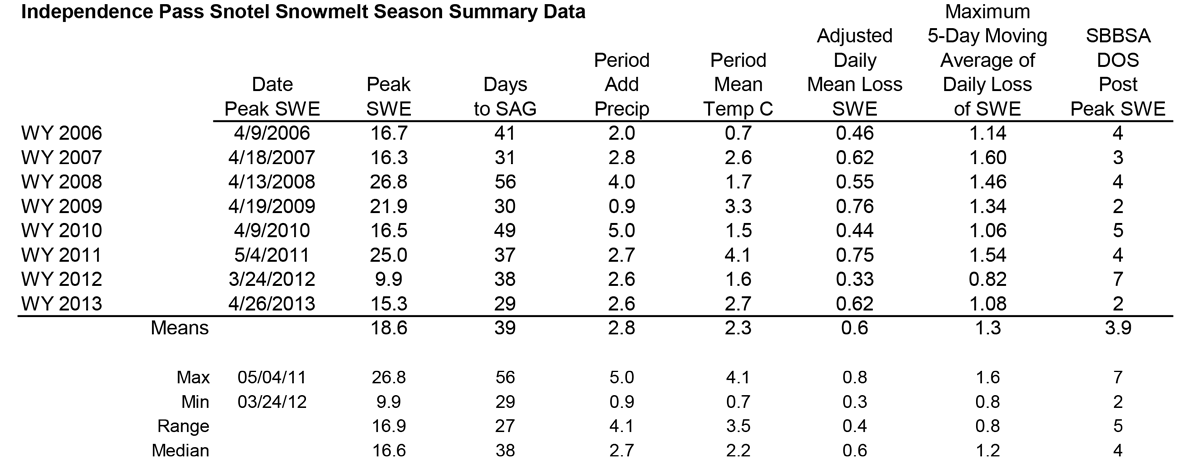
Analyses of McClure Pass, Schofield Pass, and Independence Pass Snotel data for Water Years 2006-2013 snowmelt seasons showing date and quantity of peak SWE, days from peak SWE to “snow all gone” (SAG), total additional precipitation after the date of peak SWE, an “adjusted” mean daily rate of snowmelt adding the additional precipitation to the peak SWE total, the maximum five-day moving average of daily melt, and the mean air temperature over the entire snowmelt period, from peak SWE to SAG.
Following the ‘second’ peak SWE at the McClure Pass Snotel of 13.7” on April 21, 2013, an additional 1.7” of SWE was added to the snowpack during the ablation cycle for an adjusted total of 15.4” of SWE available to melt. Aided by the intensity of radiative forcing produced by merged dust layers D8 and D6, and under the same mean air temperatures recorded in spring 2012, snowcover ablation to SAG took just 24 days. In spring 2012, a lighter dust year, an adjusted total of 14.4” of SWE was ablated to SAG in 32 days. Spring 2013 melt rates were as high as 1.5” SWE loss per day and the mean daily SWE loss over the entire snowmelt period was 0.64” per day, versus 0.45” per day the year before. However, because of the interruptions in radiative forcing described above, the maximum 5-day moving average daily melt rate was only slightly higher in WY 2013 than in WY 2012, at 1.12” per day in spring 2013 versus 1.06” per day in spring 2012. In the end, SAG occurred only a few days earlier than the median date of SAG at McClure Pass.
At the nearby Schofield Pass Snotel, located in the Crystal River headwaters some 14 miles southeast of and 1,200’ higher than the McClure Pass Snotel, peak SWE of 30.5” occurred on April 25. After April 25, an additional 3.4” of SWE was added to the Schofield Pass Snotel snowpack during the ablation cycle for an adjusted total of 33.9” of SWE available to melt. Then, over the 43 days from peak SWE to SAG, 9.2” more SWE was melted (to SAG) in 4 fewer days than in spring 2012, under somewhat warmer mean air temperatures. That more rapid snowmelt was driven by the intensity of radiative forcing produced by merged dust layers D8 and D6. Melt rates were as high as 1.8” SWE loss per day, the mean daily SWE loss was 0.79” per day, and the maximum 5-day moving average daily melt rate of 1.56” loss per day was substantially higher than the 1.14” loss per day observed in WY 2012. In the end, WY 2013 SAG on June 7 at Schofield Pass occurred very near the median date of SAG, but almost a month later than in WY 2012. Even farther east, the Independence Pass Snotel snowpack ablation pattern closely matched Schofield Pass, with SAG very near the median date.

WY 2013 SWE accumulation and ablation at the McClure Pass, Schofield Pass, and Independence Pass Snotel stations, with upper and lower quartiles of period of record shown in light grey, middle quartiles in dark grey, and the median trace for the period of record shown as a dashed line.
Stream Flows

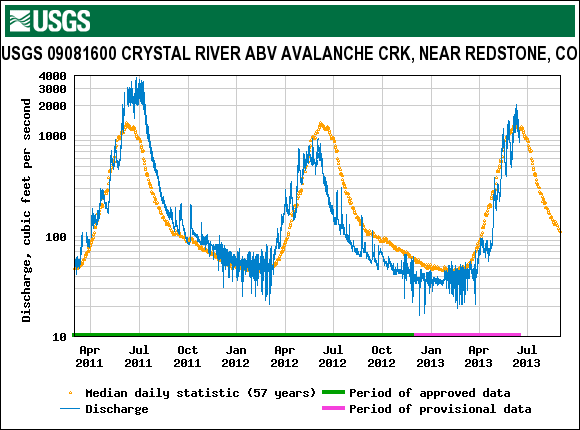
Comparison of WY 2011, 2012 and 2013 (in progress) hydrographs for the Muddy Creek Above Paonia Reservoir and the Crystal River Near Redstone gauges highlight variations in snowmelt runoff timing and volumes over those three seasons, in the watersheds east and west of McClure Pass. WY 2011 snowmelt runoff in both the Muddy Creek and Crystal River watersheds began the ascending limb with normal timing, in March, then criss-crossed the gauge’s respective medians in a series of surges, as dust-in-snow was alternately exposed and reburied under relentless spring storms. Very large snowpacks combined with more sustained exposure of dust in late May and early June drove the ascending limb well beyond the usual peak level to above-average peaks well beyond the average date of peak discharge. Flows then descended at a normal rate for much of the remainder of the snowmelt runoff cycle, with discharge levels remaining above the respective gauge medians for the entire summer and into the fall.
Snowmelt runoff began slightly earlier in March in WY 2012, at both gauges, as precipitation stopped and enabled recent dust layers to emerge. Muddy Creek runoff began with a very sharp surge to the season’s peak discharge before being interrupted by the only storm of the month. Flows subsequently resumed and began another series of somewhat smaller surges as dry and sunny weather alternated with brief and small spring storms until the very sharp descending limb began in late April. WY 2012 runoff fell very far short of Muddy Creek’s normal peak level and total runoff volume. On the Crystal, the early onset of runoff more closely matched the median hydrograph but with a clear shift to the left and with a lower total volume. Both gauges recorded flows far below their median levels throughout the spring, summer, and into the fall of 2012.
This season, the onset of WY 2013 snowmelt runoff was delayed, at both sites, by unsettled March and April weather. Very low April flows were slightly better on the Crystal River but neither gauge reported any significant runoff until late April, when both sites recorded strong surges driven by the emergence and merger of dust layers D8 and D6. Those surges were cut short by additional spring snowfall and flows retreated somewhat before surging again and ratcheting discharge levels past the prior surge’s peak. On the Crystal River, that ratcheting behavior produced oscillating flows that, in their ‘mean’ were parallel to but just below median levels. A final surge in early June exceeded the median peak discharge level, very near the normal date of peak flow. Both the higher average elevation (receiving more snow with winter and spring storms) and generally north aspect of that watershed served to mitigate dust effects and prolong runoff more effectively than the lower elevations and generally southwest aspect of the Muddy Creek watershed.
Because of those geographic differences, the same weather produced proportionally larger early surges in Muddy Creek runoff consuming a much larger share of the (typically) much smaller amount of available SWE in that watershed, as compared to the upper Crystal River watershed. Subsequent ratcheting flows in the Muddy Creek watershed never attained median levels along the ascending limb and the peak in flows, although occurring just a few days ahead of the median, fell far short of the median level. Muddy Creek then began a steep descending limb in mid-May as the scant remaining snowcover was rapidly consumed, with snowmelt accelerated by sustained radiative forcing in very heavy dust layers D8/D6. By early June, just as the much higher elevation and more northerly upper Crystal River watershed was producing an above-average peak flow, Muddy Creek flows had declined close to the levels seen in early June 2012, to roughly 25% of median levels. As the Crystal River begins its descending limb, sustained radiative forcing in very heavy D8/D6 dust may eventually also result in a steeper-than-normal decline in its flows and below-average flows for the duration of WY 2013.