 Water Year 2013 CODOS Summary
for Spring Creek Pass
Summary | Snowpack & Dust | Melt Rates | Stream Flows
Summary
Water Year 2013 entered late winter with dismal snowpack development at ten of eleven CODOS dust-on-snow monitoring sites, Willow Creek Pass being the single exception. Through March 2013, snowpack SWE totals at all other sites resembled or even fell short of the very dry winter of WY 2012, raising concerns about back-to-back drought seasons. That broadly consistent spatial pattern in scant precipitation began to diverge in April, 2013. CODOS sites in the northern Front Range and Colorado River headwaters benefitted most from a series of April and May winter storms that augmented snowpacks and eventually resulted in average or even above average peak SWE levels on average or later-than-average dates. In the southwestern mountains, fewer and/or smaller April/May storms failed to offset the dry beginning to WY2013 winter. CODOS sites in the San Juan Mountains experienced, for the second year, substantially sub-par peak SWE values, on near-average dates. In between, the Central Mountains, Grand Mesa, Park, and northern Gore ranges came closer to but still fell short of average snowpacks. The Slumgullion and Beartown Snotel sites near the Spring Creek Pass CODOS site were among San Juan Mountain range sites where WY 2013 peak SWE fell far short of average values, extending the severe shortfalls in snowpack and SWE experienced in WY 2012.
At the CSAS Senator Beck Basin Study Area at Red Mountain Pass, the primary CODOS monitoring site, WY2013 produced a total of ten separate dust-on-snow events, a lower total count than in the past three seasons. However, the actual mass of dust deposited at Senator Beck Basin in WY 2013 was greater than in any prior season, including the “Martian Winter” of WY 2009. Dust season began at Senator Beck Basin in November with a single event, February and March delivered four additional events, but the vast majority of dust deposition occurred during events D6 on April 8th and the long-duration D8 event of April 15-17. As of late March, dust layers observed at Senator Beck Basin were either weak or not present at CODOS sites farther north and east, creating some hope that WY 2013 might be dust-free in parts of the state. Then, dust events D6 and D8 spelled the end to that possibility with significant depositions statewide near the top of the snowpack. As at all CODOS sites, dust layers D6 and D8 played the principal role in very significantly reducing snowcover albedo at Spring Creek Pass and throughout the Rio Grande watershed as they became exposed, merged, and remained exposed. Although dust-enhanced melt rates at the nearby, Slumgullion and Beartown Snotel sites were sometimes moderate or rapid, periods of unsettled weather and fresh snowfalls frequently interrupted those periods of radiative forcing, slowing or reversing stream flow surging and somewhat prolonging what was nevertheless another very poor runoff cycle in the Rio Grande River basin.
SnowPack & DusT
SWE accumulation and ablation for Water Years 2012 and 2013, with dust-on-snow events shown as brown bars, by date (as observed at the Senator Beck Basin Study Area). The long-duration D8 event of April 15-17, 2013, is shown as a heavier bar. Note that not all dust layers observed at Senator Beck Basin were also found at other CODOS sites.
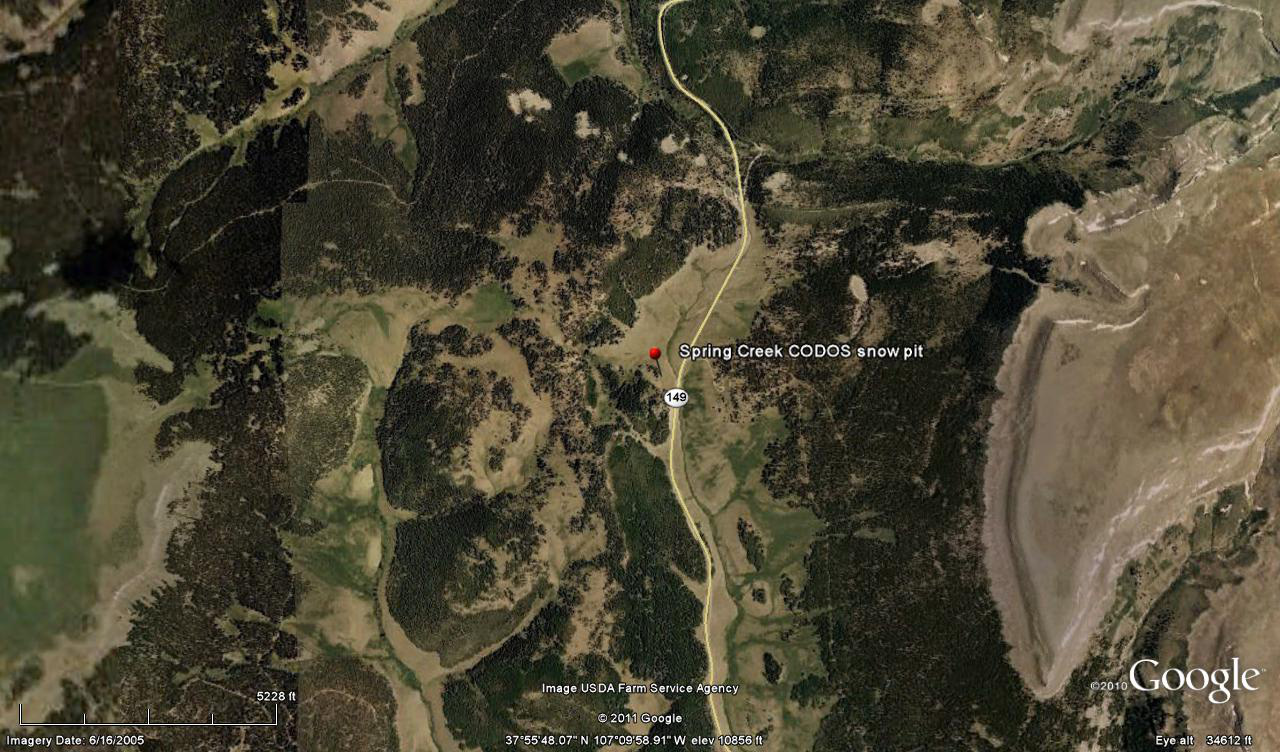
Snowpack formation at the Spring Creek Pass CODOS site and nearby Slumgullion Snotel began very slowly and late, in early November, soon stalled for several weeks, and then resumed in December. Despite a period of stormy weather in the western San Juan Mountains at the end of December (CSAS Storms #4-8), by February 1, 2013 snowpack SWE at Slumgullion was verging on the lowest value recorded for that date and lagging far behind WY 2012. Dust layer D2, deposited overnight on February 8/9, was barely discernible in our March 23, 2013 snow profile. That snow profile revealed a shallow, very cold, and extremely weak, “depth hoar” snowpack.
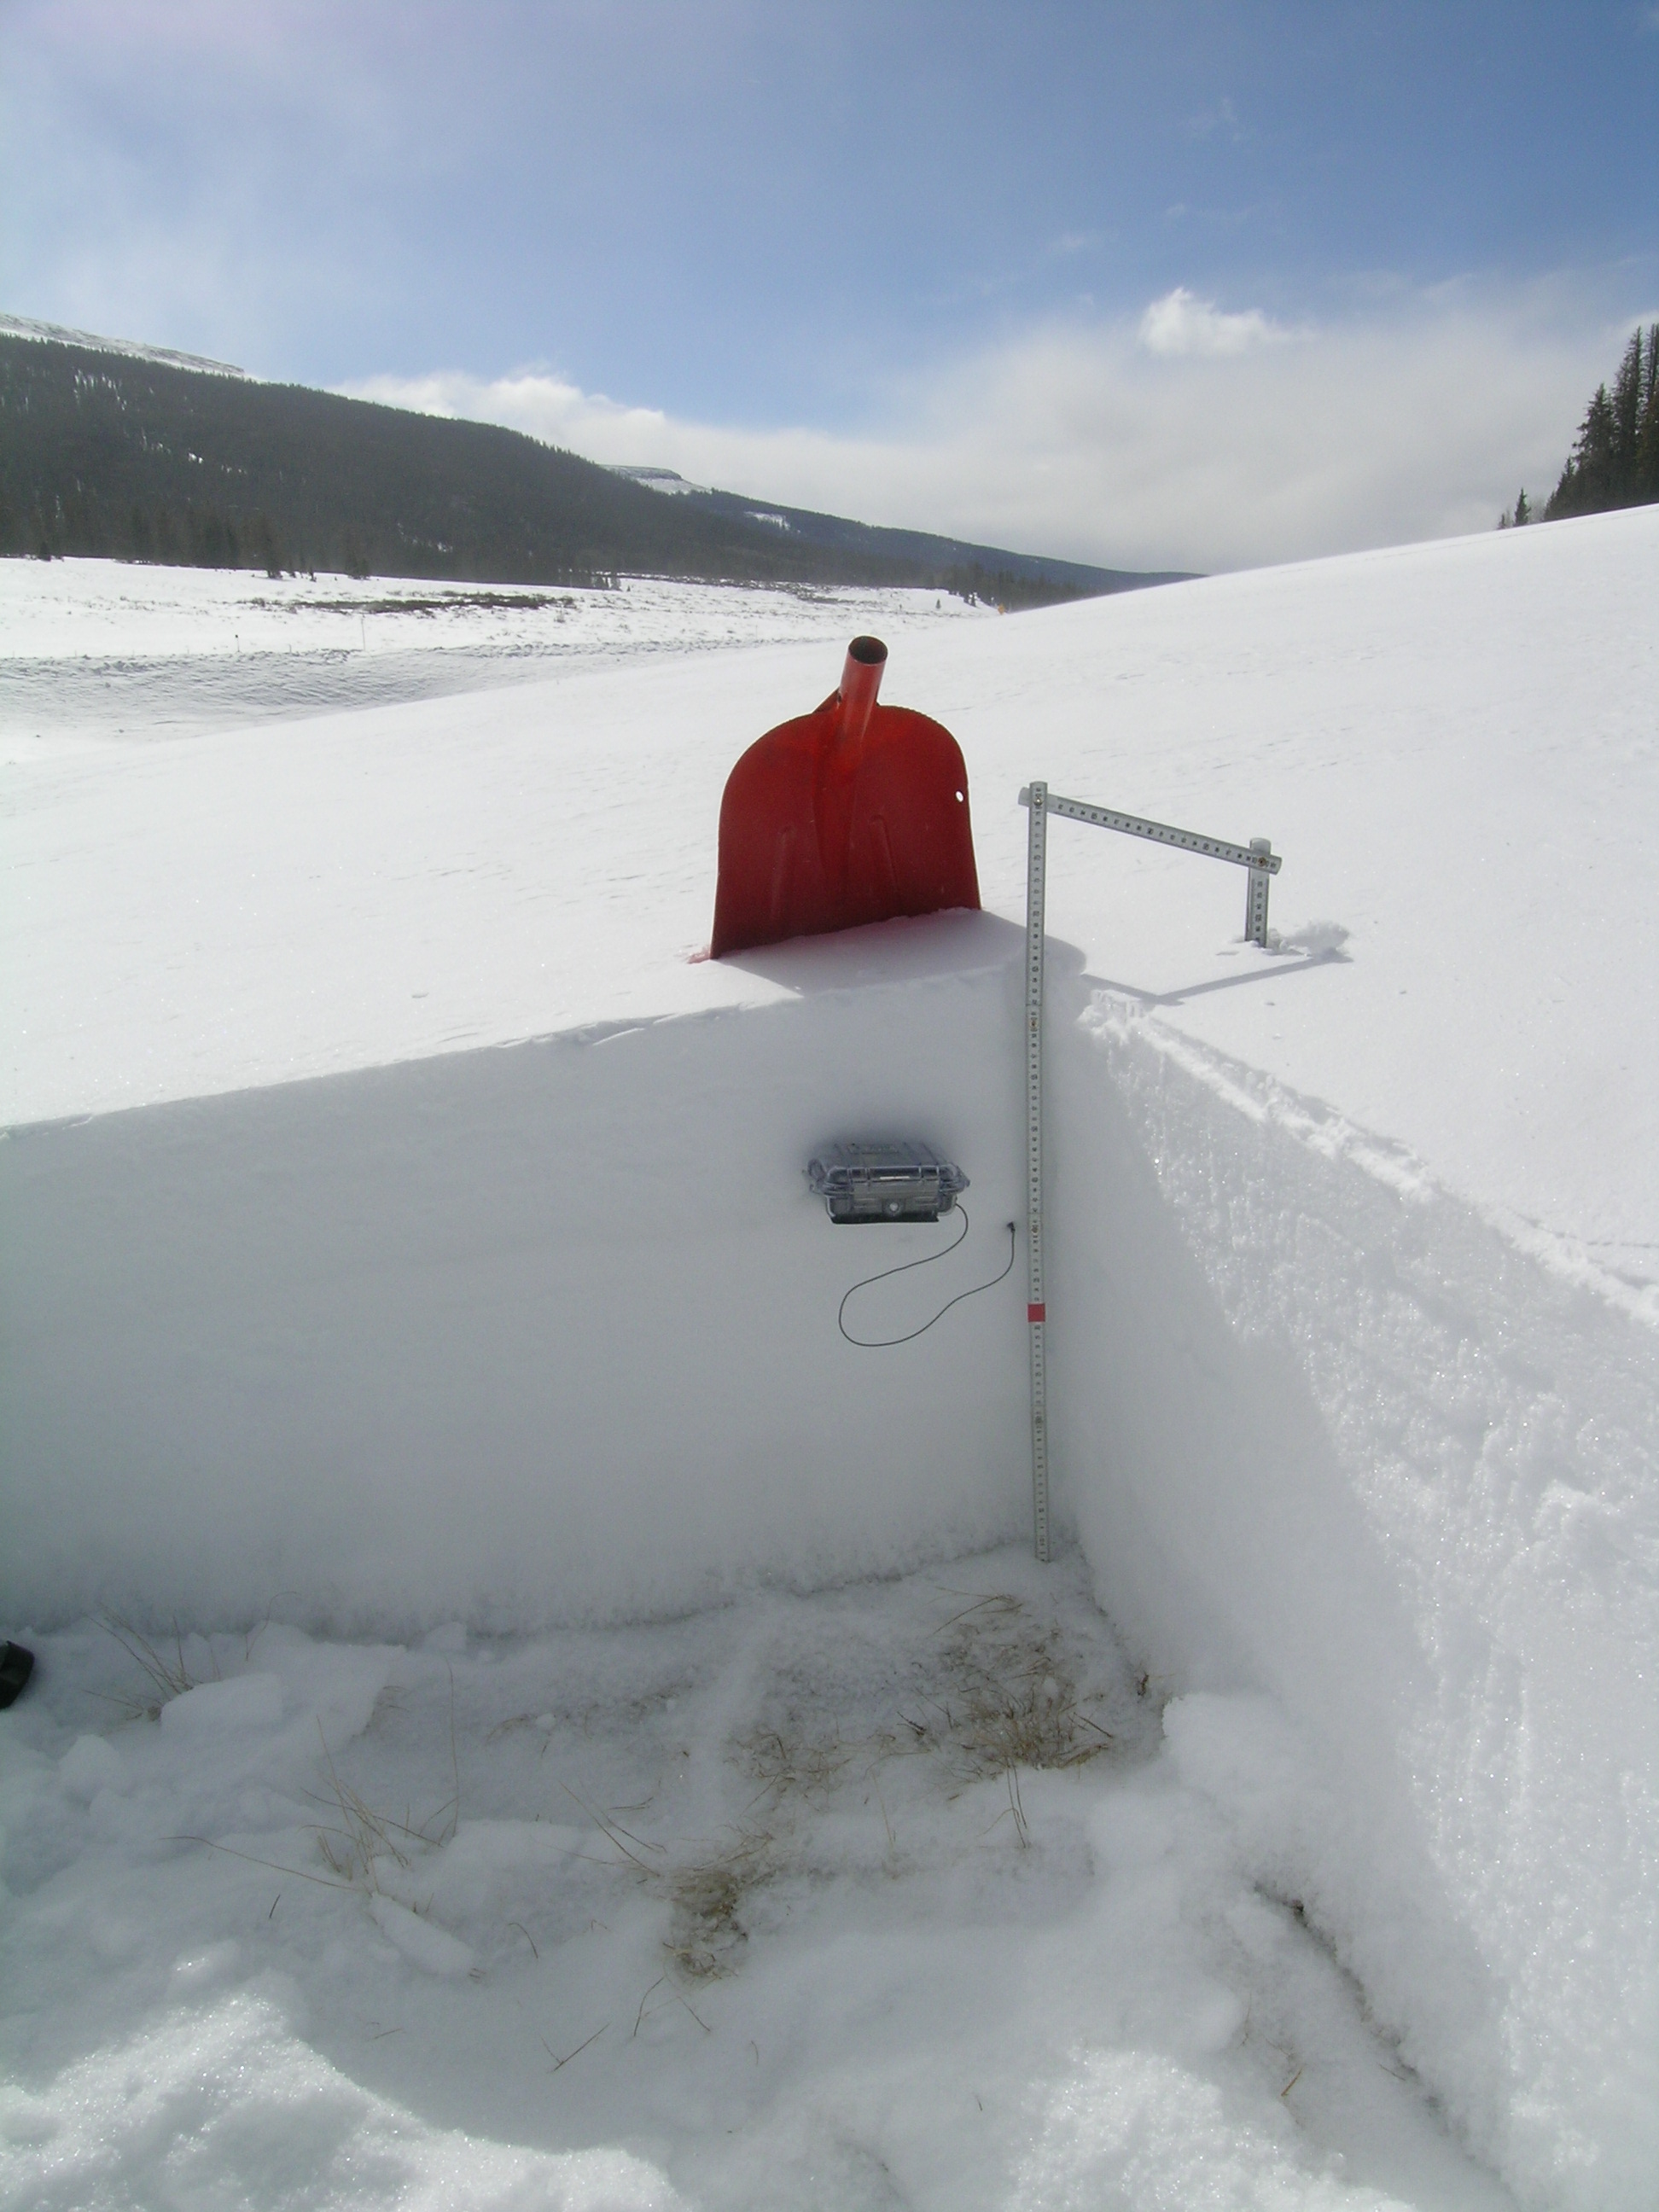
After a brief surge in late January (CSAS Storms # 10, 11, 12), SWE accumulation then proceeded during February and early March at a rate comparable to the median rate of accumulation but at still extremely low actual values, due to the very poor start to the season. On April 8 a storm (CSAS Storm #19) delivered both fresh snow as well as dust event D6, clearly present in our April 12 snow profile. That profile presented a warmer snowcover than the prior profile, but still contained some cold content at a mean temperature of -3.0° C. Nonetheless, we did observe clear evidence of recent melt episodes in former snowpack surfaces, one in conjunction with dust layer D6 while it was exposed at the surface (since buried in new snow). That melt episode contributed to the 4.0° C of snowpack warming since March 23.
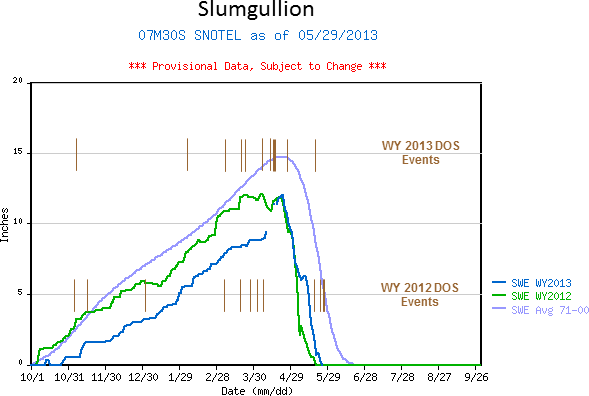
Peak SWE at the nearby Slumgullion Snotel followed on April 23 (at 12.0”), six days later than the median date of Peak SWE (April 17) and 2.7” below the median peak SWE value (14.7”). That peak SWE date was preceded by another winter storm (CSAS Storm #20) and the long-duration D8 dust event of April 15-17. Snowpack ablation quickly followed peak SWE, initially enhanced by the rapid emergence of dust layer D8 and soon by the merging of layer D8 with layer D6. Aside from a minor rebound in mid-May, snowmelt was rapid and the Slumgullion Snotel recorded “snow all gone” (SAG) on May 25.
Our final site visit on May 1 found large areas of open ground in our CODOS snow profile site, with merged dust layers D8 and D6 substantially reducing snow albedo on the remaining patches of snowcover and producing significant radiative forcing and acceleration of snowmelt in the surrounding snow covered terrain. See the Melt Rate discussion below.
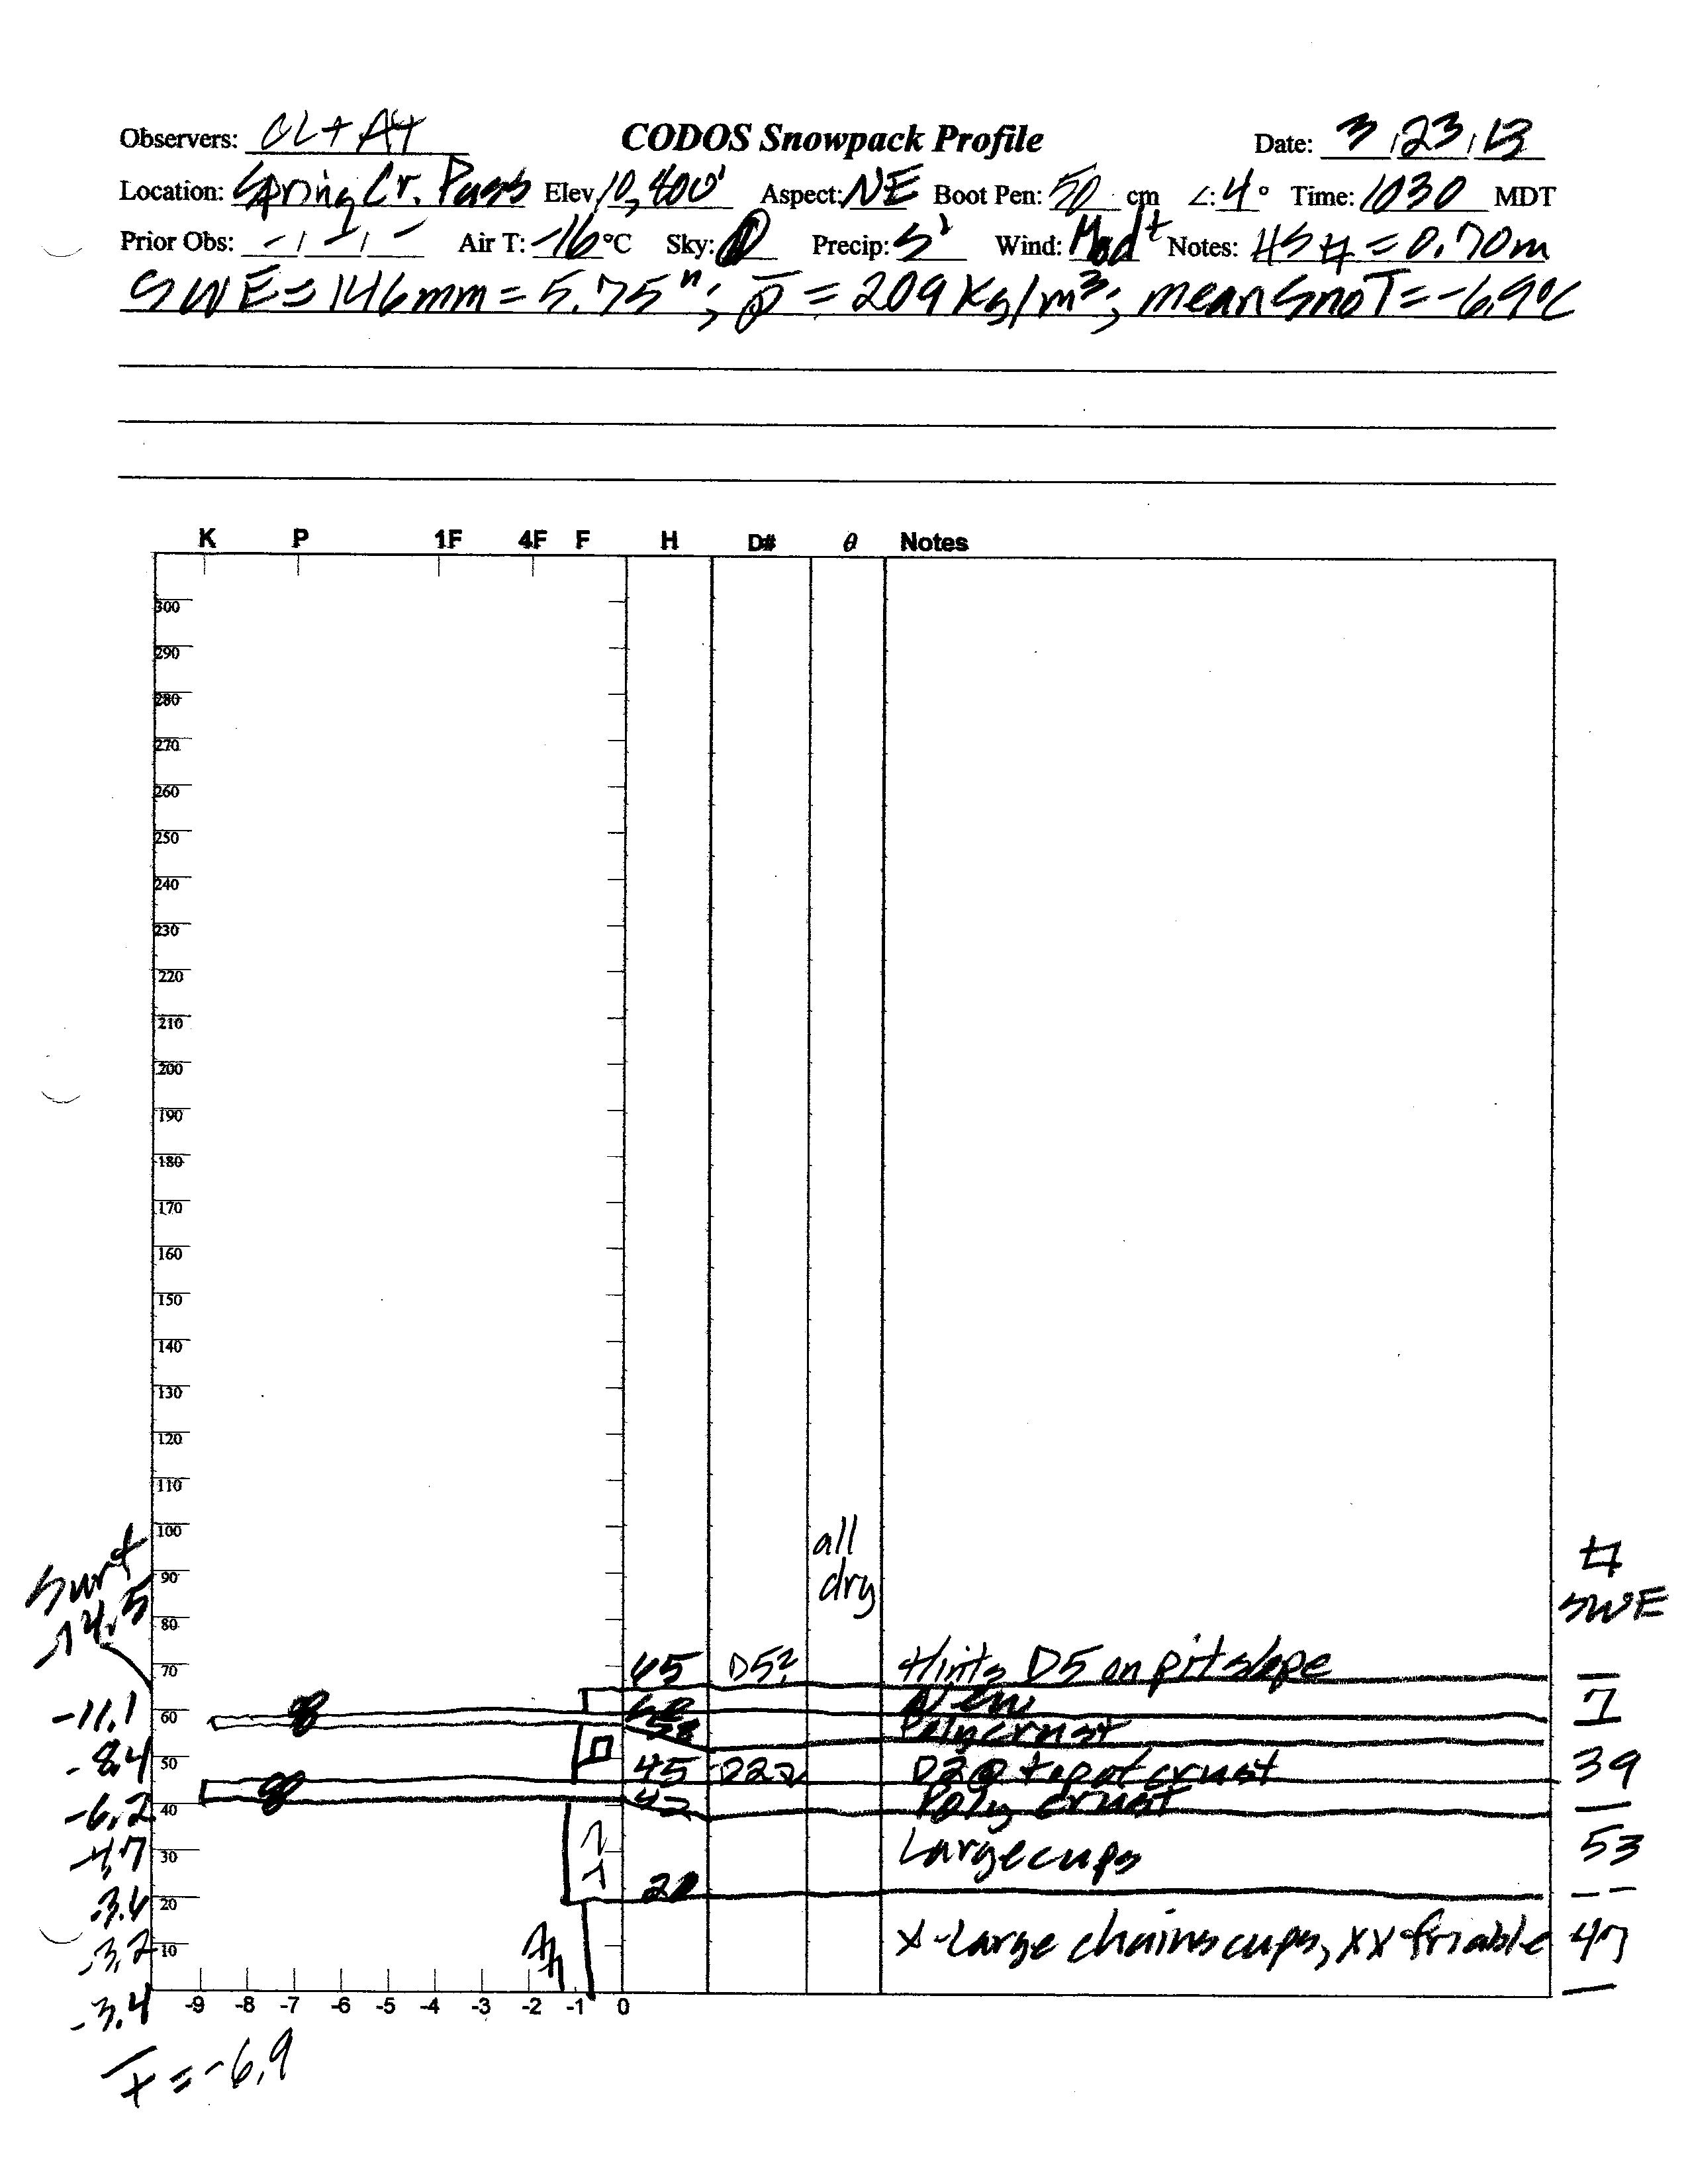
The March 23, 2013 snow profile at the Spring Creek Pass CODOS site. A weak dust layer D2 was present
mid-
pack and
strong hints of event D5
were at/in the surface and that event was verified farther down valley.
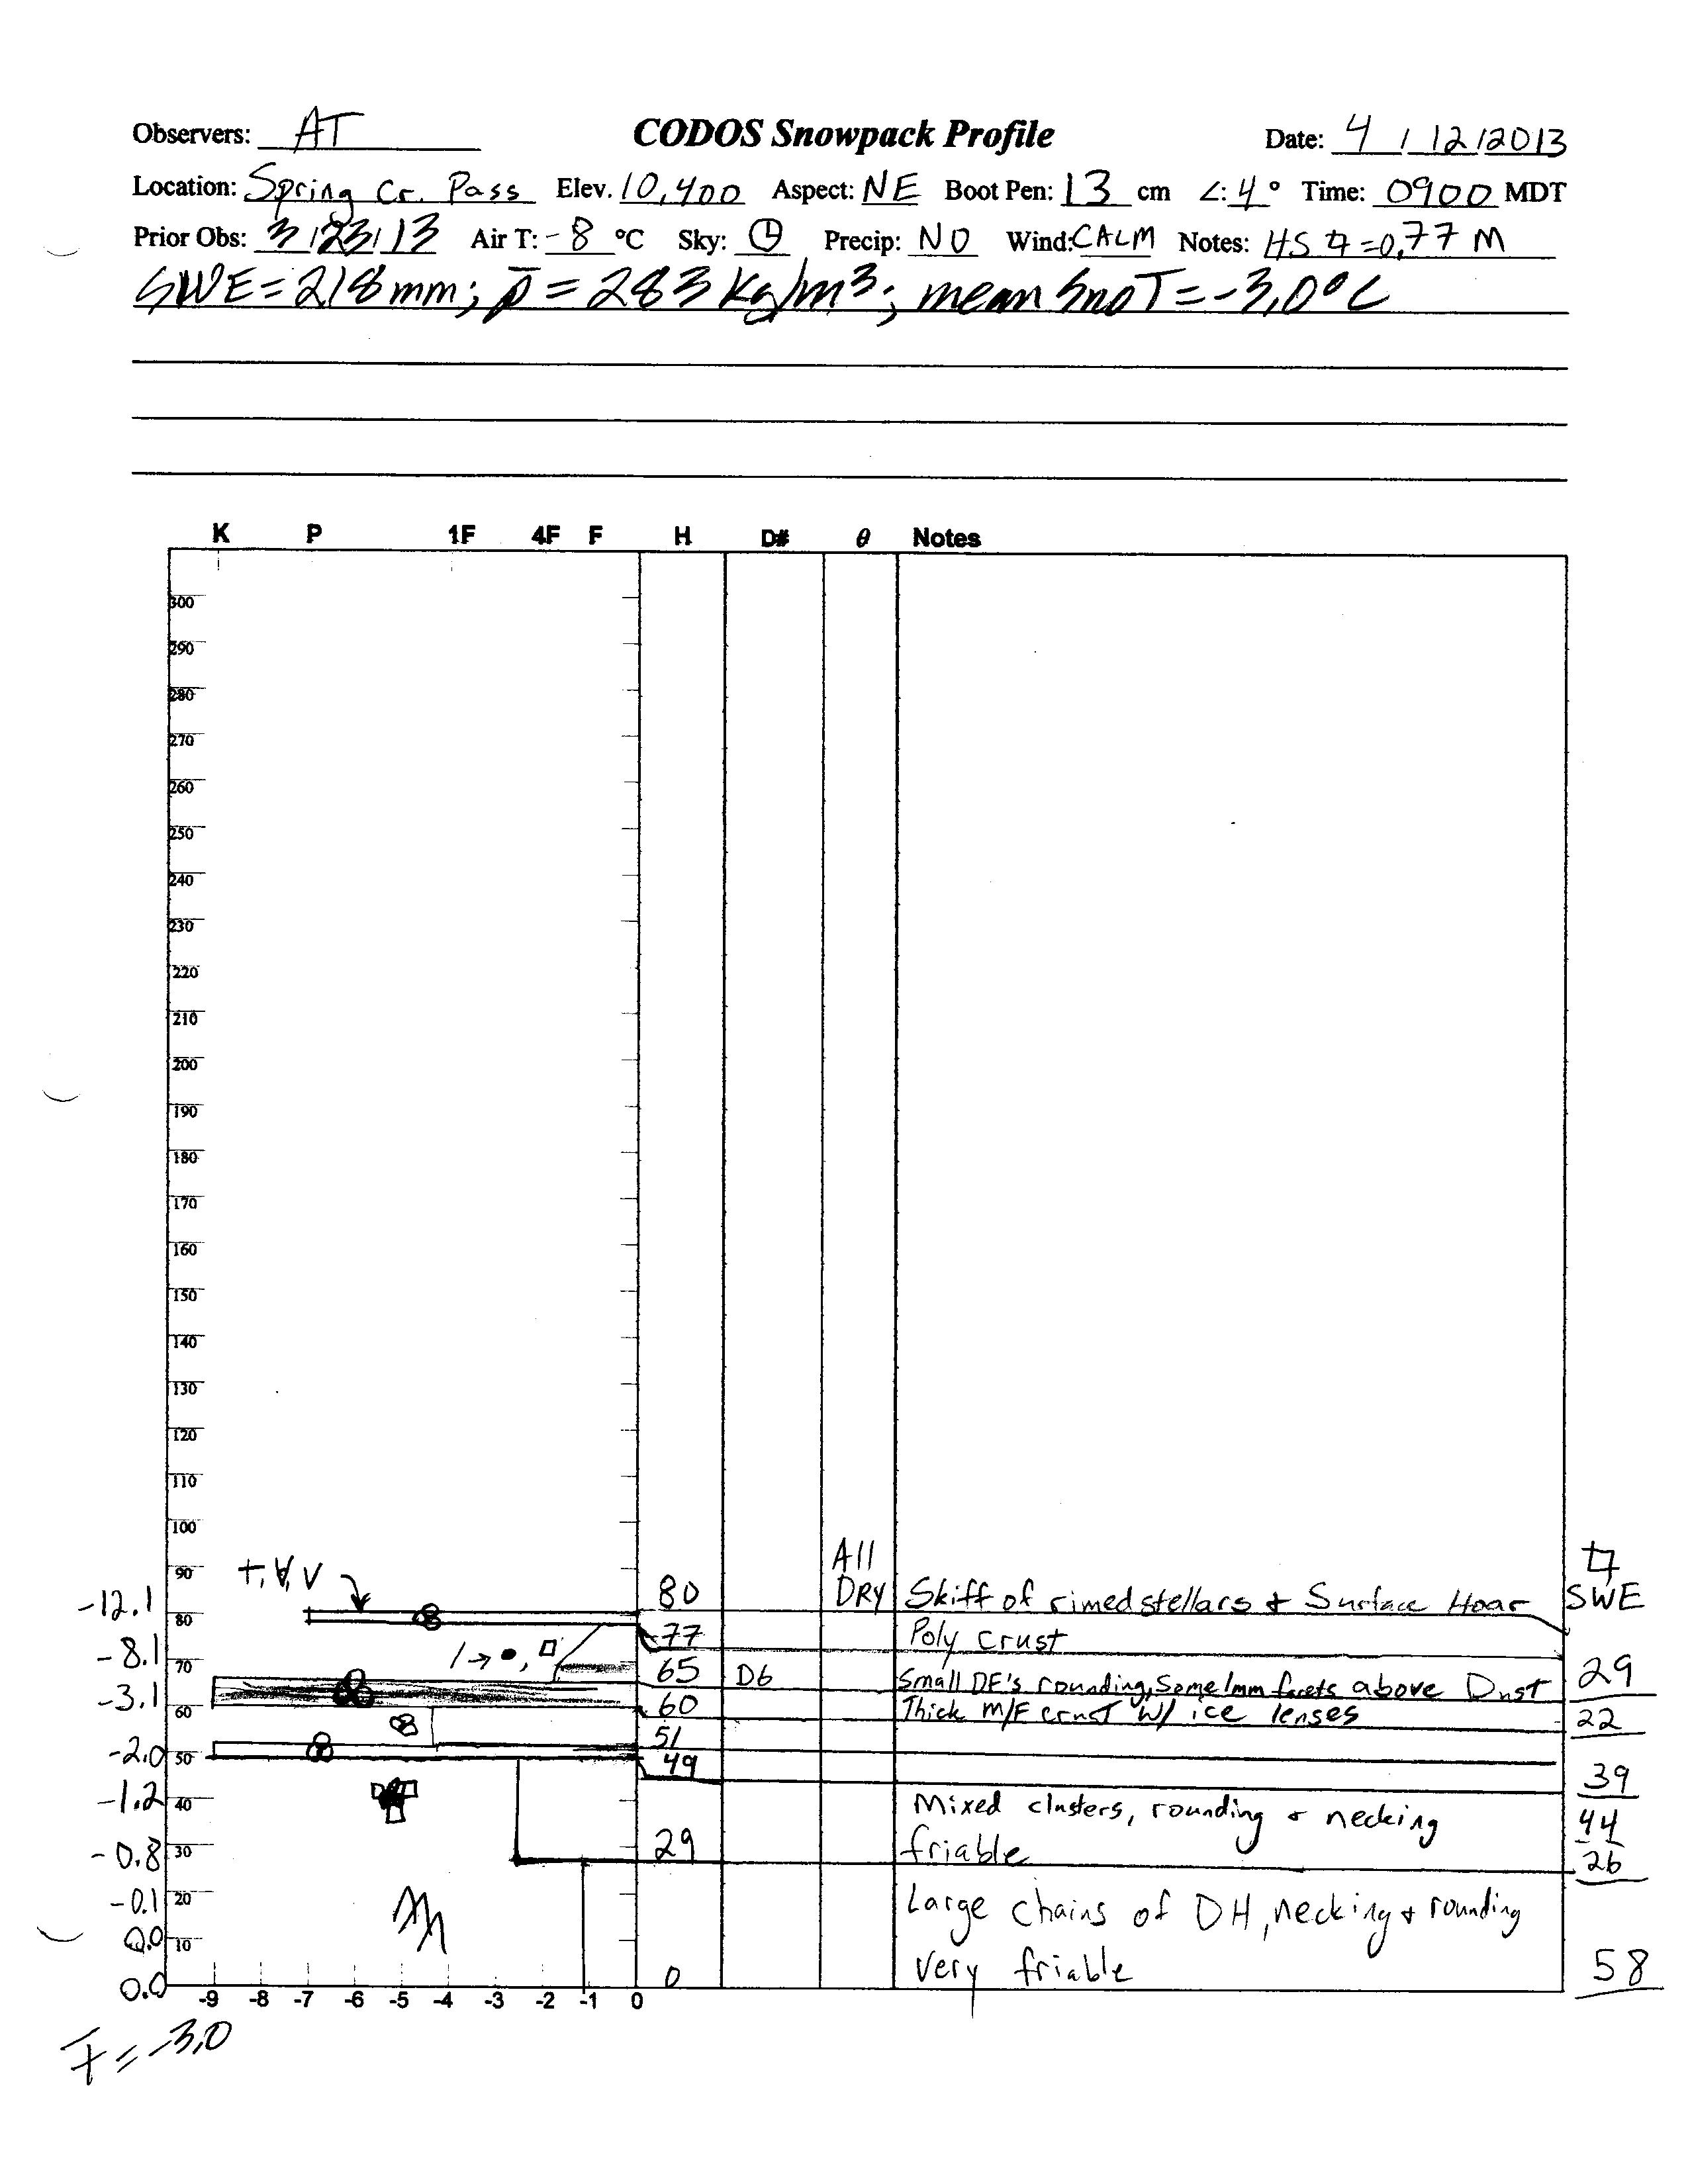
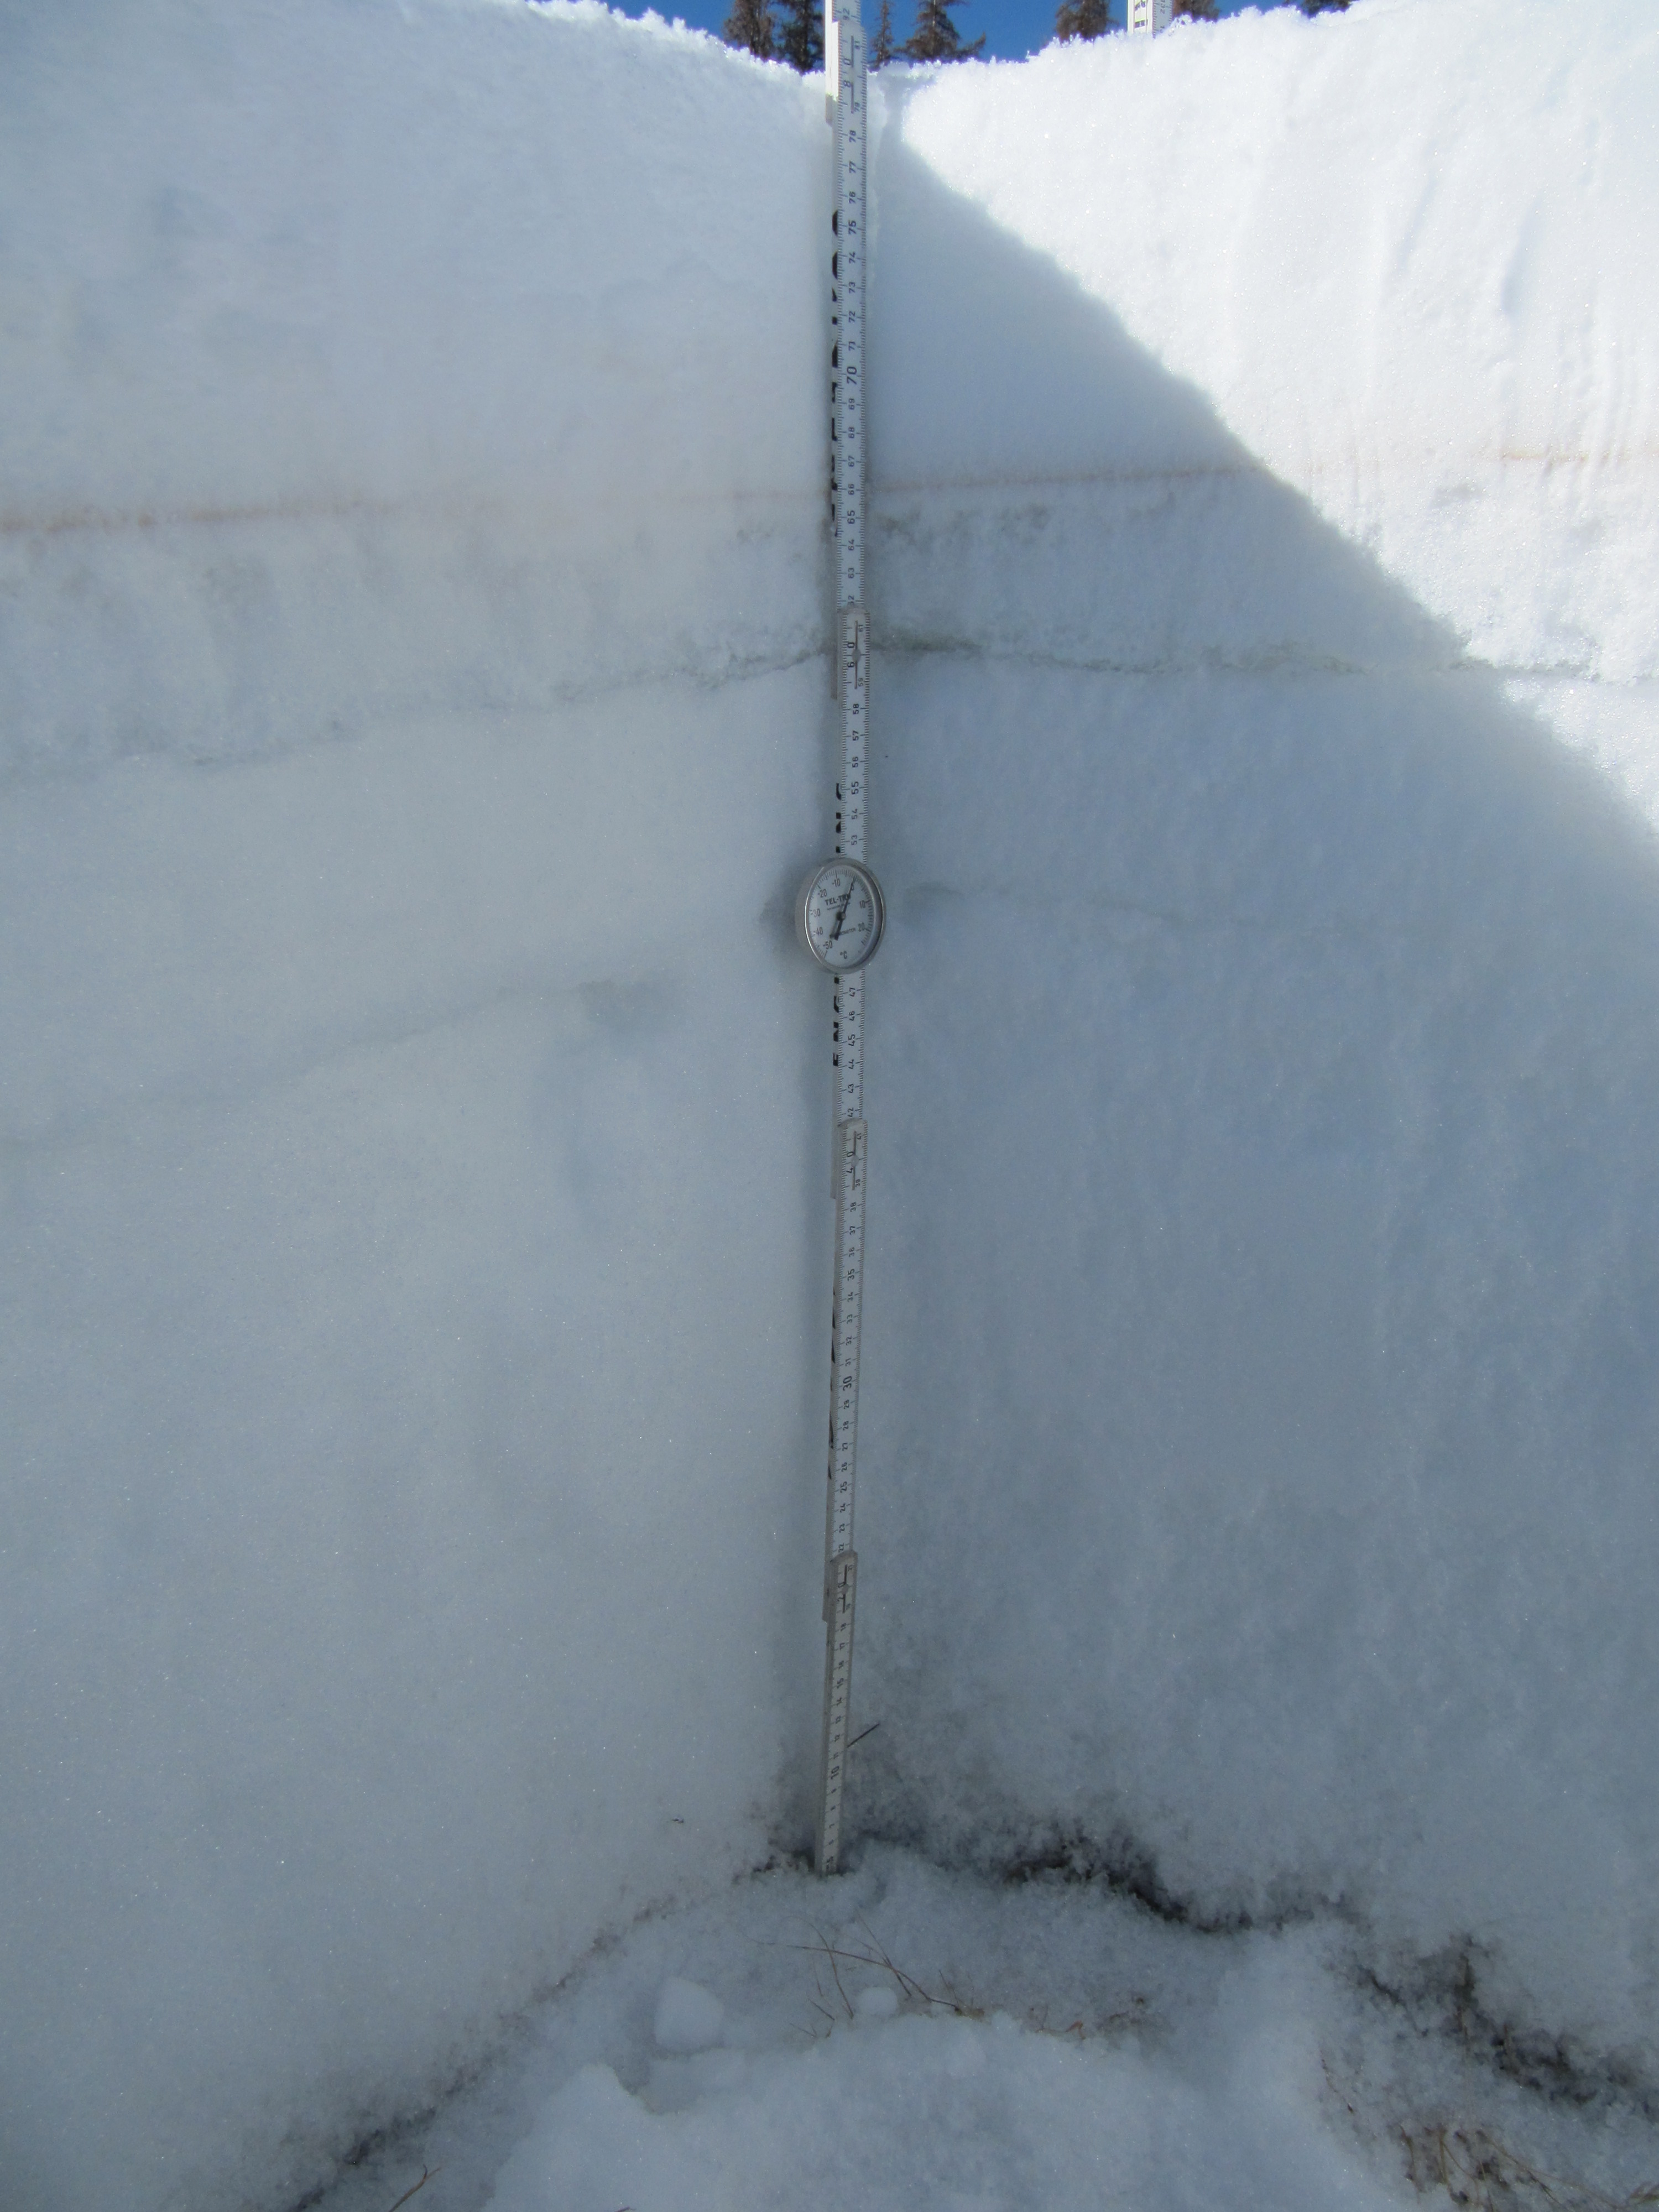
On April 12 dust layer D6 was strongly present, buried 6” below the surface. Clear evidence of a surface melt episode was
observed
in the snow
immediately below D6 and snow temperatures had warmed from a mean of -6.9° C on March 23 to a mean of -3.0° C.
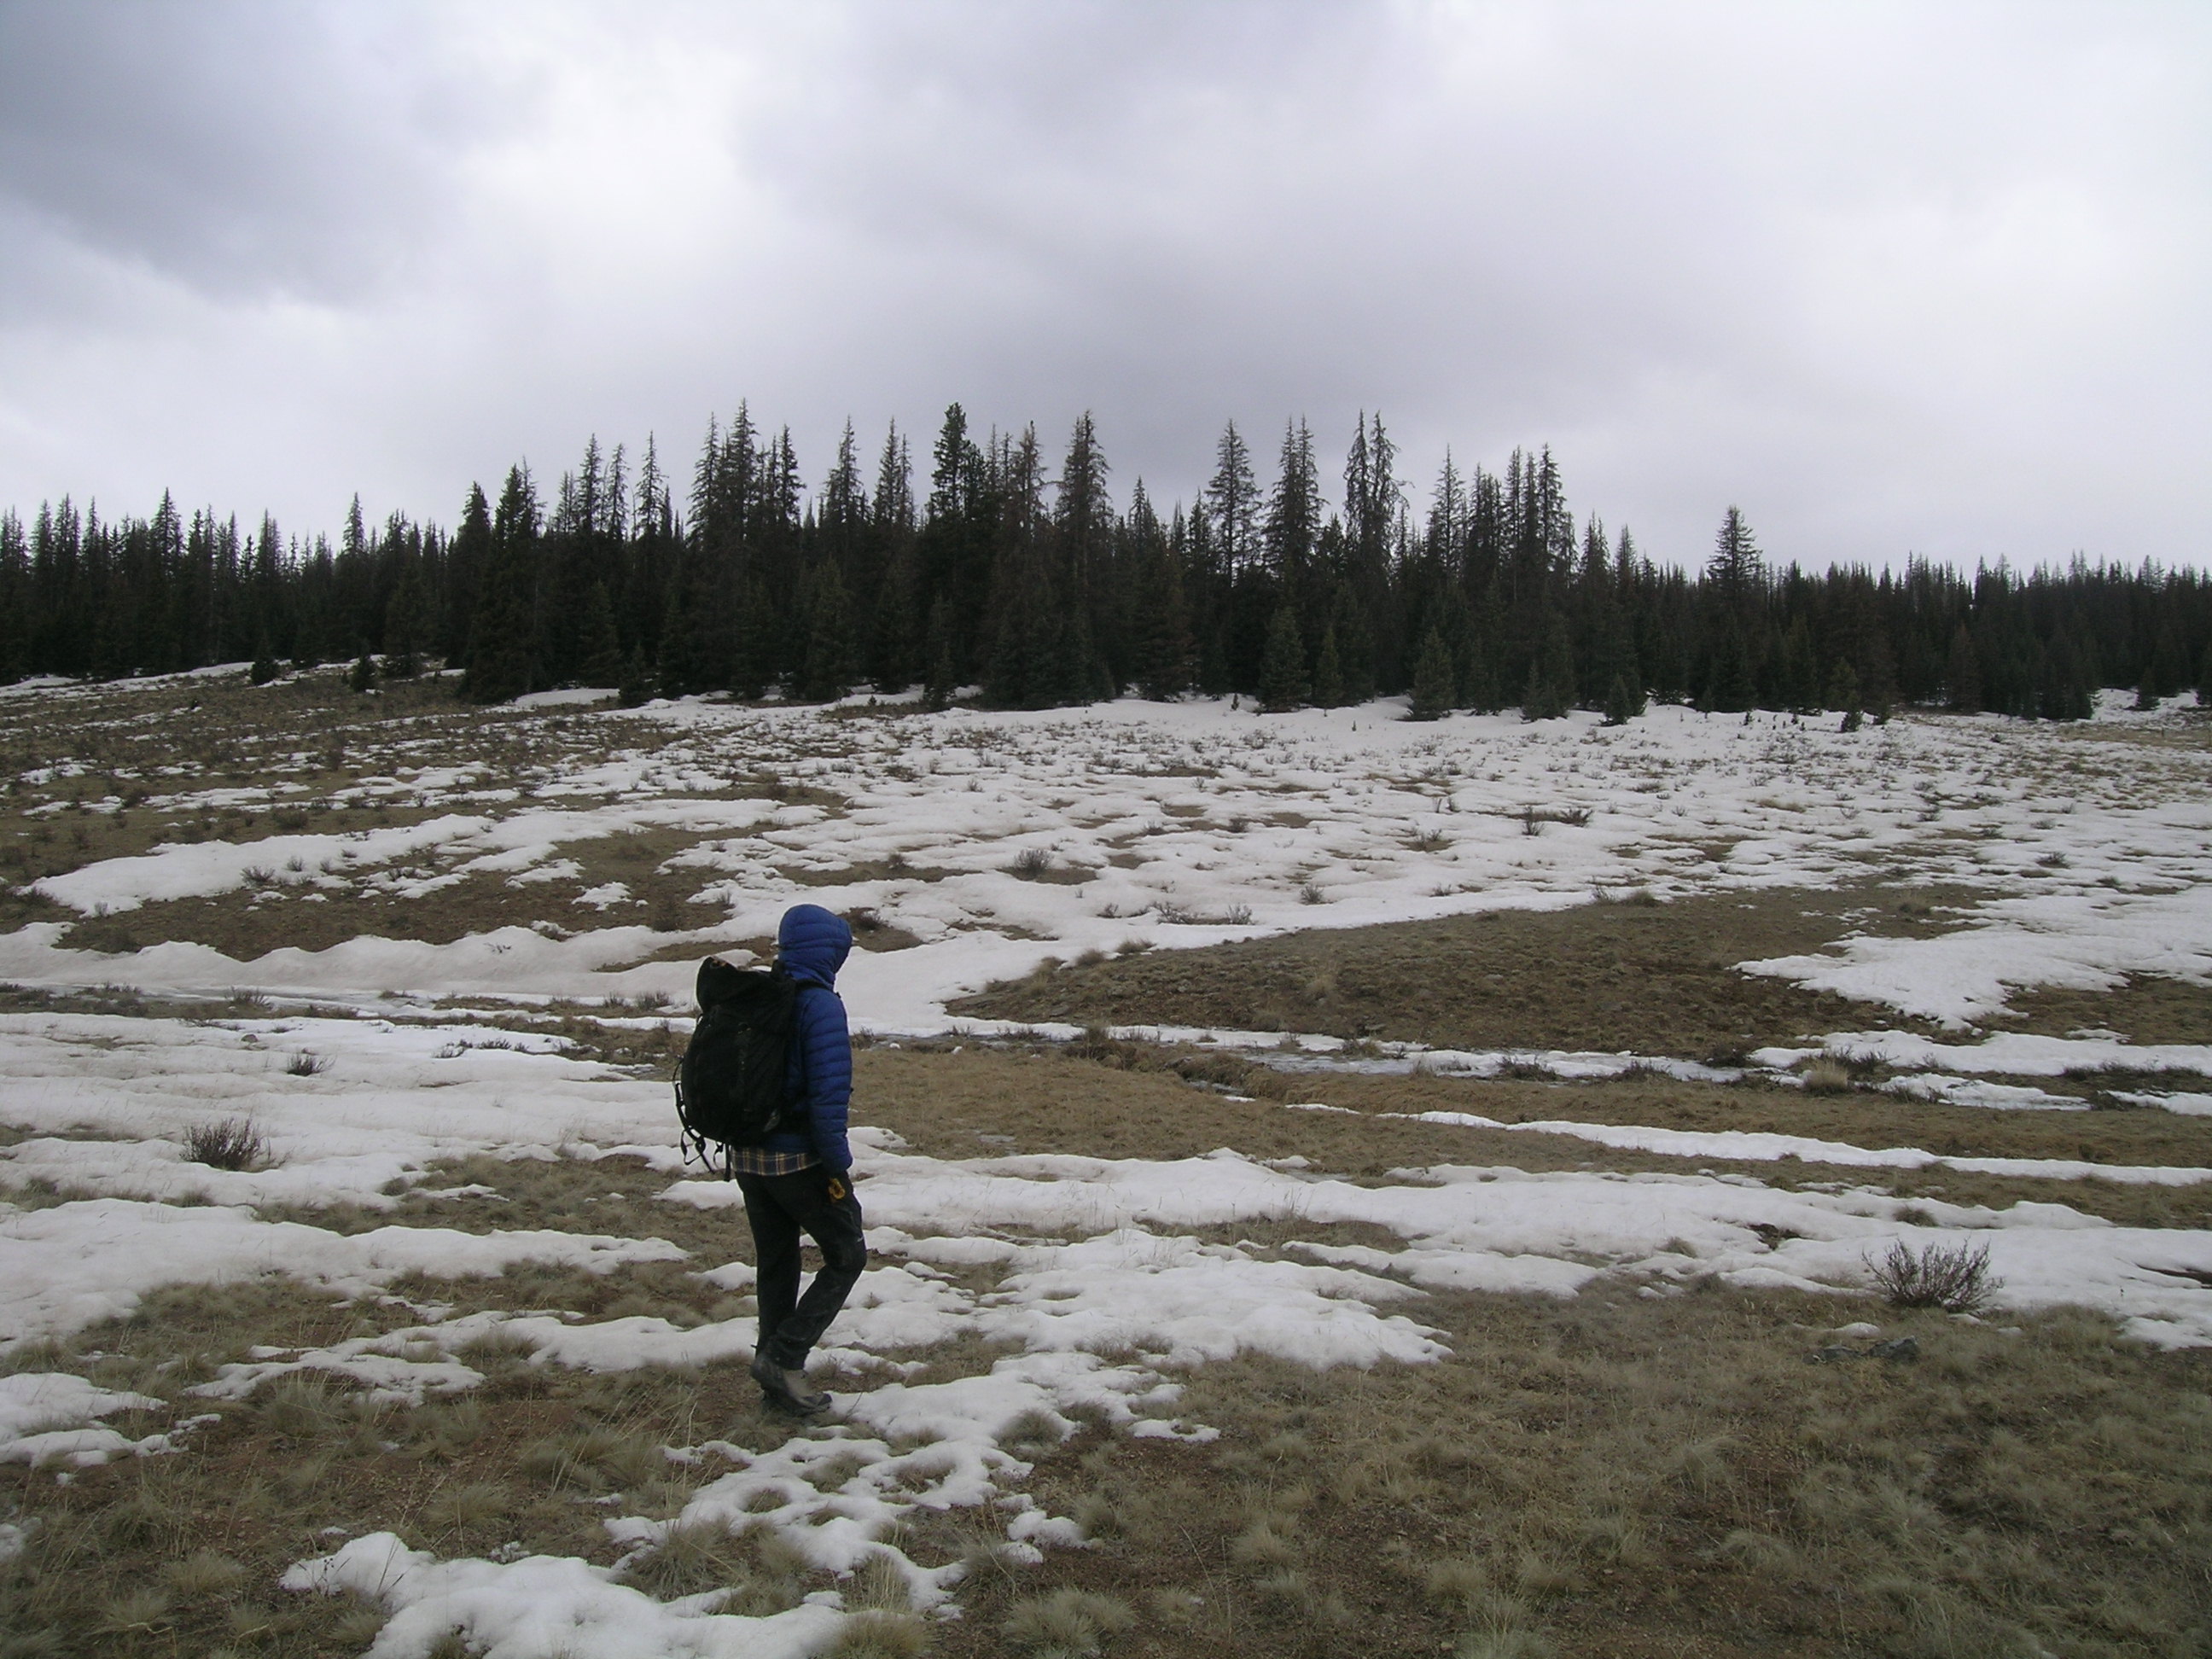
The CODOS Spring Creek snow pit slope on May 1, 2013, as Andrew Temple approaches in sneakers.
Melt Rates
Even though dust layers D8 and D6 were deposited high in the snow column, and were quick to emerge following peak SWE, periods of unsettled weather in the Rio Grande River watershed frequently reduced the potential maximum radiative forcing effects of the merged D8/D6 dust. Once merged, those layers experienced few periods of sustained exposure under clear, sunny skies. Cloud cover often reduced solar insolation onto the exposed D8/D6 layer and/or fresh snow temporarily restored a higher albedo to the remaining snowpack and substantially slowed melt rates, prolonging the runoff.
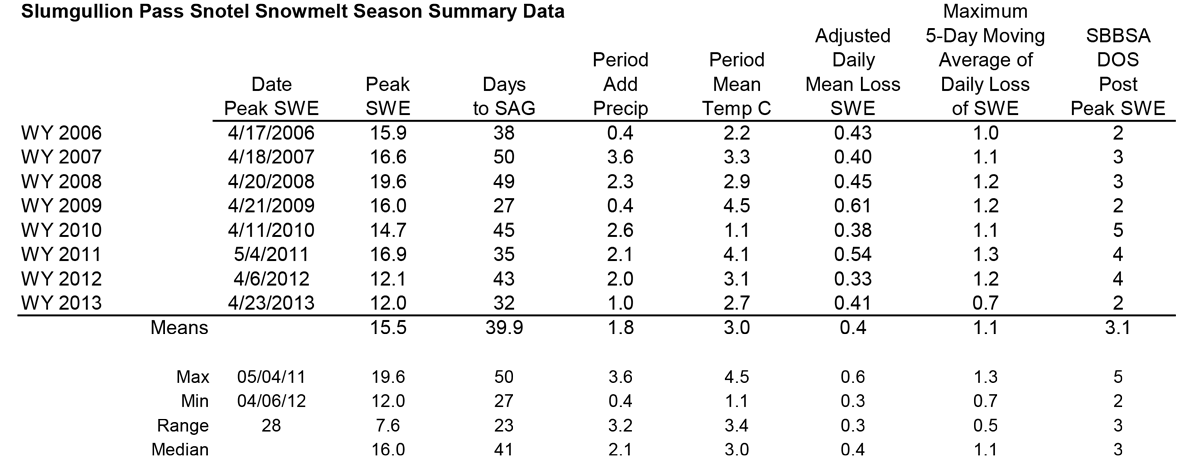
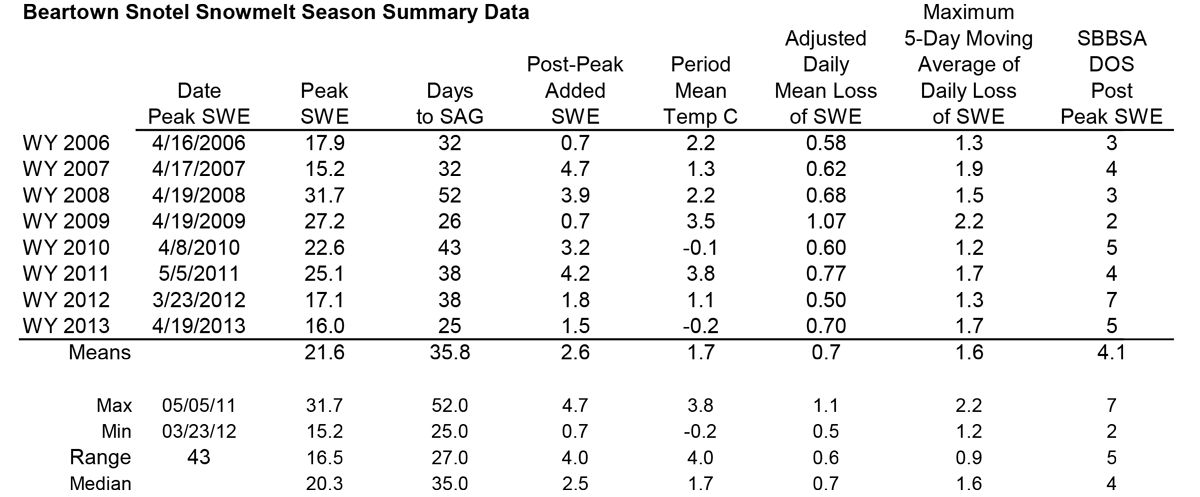
Analyses of Slumgullion and Beartown Snotel data for Water Years 2006-2013 snowmelt seasons showing date and quantity of peak SWE, days from peak SWE to “snow all gone” (SAG), total additional precipitation after the date of peak SWE, an “adjusted” mean daily rate of snowmelt adding the additional precipitation to the peak SWE total, the maximum five-day moving average of daily melt, and the mean air temperature over the entire snowmelt period, from peak SWE to SAG.
Following peak SWE at the Slumgullion Snotel of 12.0” on April 23, 2013, an additional 1.0” of SWE was added to the snowpack during the ablation cycle for an adjusted total of 13.0” of SWE available to melt. Then, over the 32 days from peak to SAG, only 1.1” less SWE was melted (to SAG) in 11 fewer days and under cooler mean air temperatures than in spring 2012, a lighter dust season. That more rapid snowmelt was driven by the intensity of radiative forcing produced by merged dust layers D8 and D6. Melt rates were as high as 0.9” SWE loss per day and the maximum 5-day moving average daily melt rate was slightly higher than observed in WY 2012, at 0.41” SWE loss per day. In the end, SAG occurred almost a week earlier than the median date of SAG at Slumgullion. It should be noted that the Slumgullion Snotel site is particularly heavily shaded by the surrounding forest.
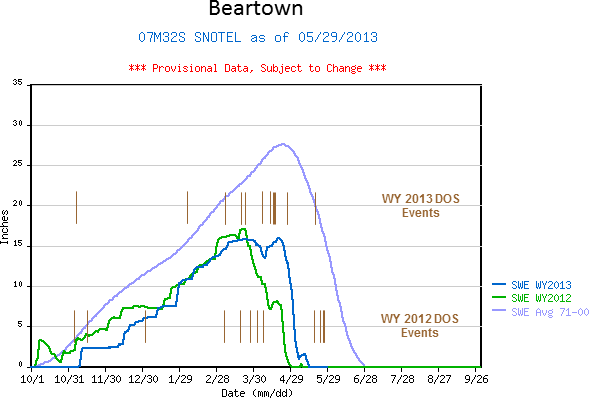
At the nearby Beartown Snotel, located in the Rio Grande main stem headwaters, peak SWE of 16.0” occurred four days earlier than at Slumgullion, on April 19. An additional 1.5” of SWE was added to the Beartown snowpack during the ablation cycle for an adjusted total of 17.5” of SWE available to melt. Then, over the 25 days from peak SWE to SAG, 1.4” less SWE was melted (to SAG) in 13 fewer days than in spring 2012, and under cooler mean air temperatures. That more rapid snowmelt was driven by the intensity of radiative forcing produced by merged dust layers D8 and D6. Melt rates were as high as 2.3” SWE loss per day and the maximum 5-day moving average daily melt rate of 1.7” loss per day was higher than the 1.3” loss per day observed in WY 2012. In the end, SAG at Beartown occurred almost three weeks earlier than the median date of SAG, barely averting an even earlier date.
WY 2013 SWE accumulation and ablation at the Slumgullion and Beartown Snotel stations, with upper and lower quartiles of period of record shown in light grey, middle quartiles in dark grey, and the median trace for the period of record shown as a dashed line.
Stream Flows
Comparison of WY 2011, 2012 and 2013 (in progress) hydrographs for the Rio Grande River Near Del Norte gauge highlight variations in snowmelt runoff timing and volumes over those three seasons. WY 2011 snowmelt runoff in the Rio Grande River watershed began late and then oscillated wildly as substantial dust-in-snow was alternately exposed and reburied under relentless spring storms. Eventually, flows surged sharply to an above-average peak near the average date of peak discharge, as dust finally emerged and remained exposed. Flows then descended at a normal rate for much of the remainder of the snowmelt runoff cycle. In sharp contrast, WY 2012 snowmelt runoff began a month earlier than in 2011, again exhibiting rapid surges followed by sharp declines before reaching a first peak in early May and a second peak later in the month, still well in advance of the median date of peak flows. WY 2012 total snowmelt runoff yields at the Del Norte gauge were very far short of average yields.
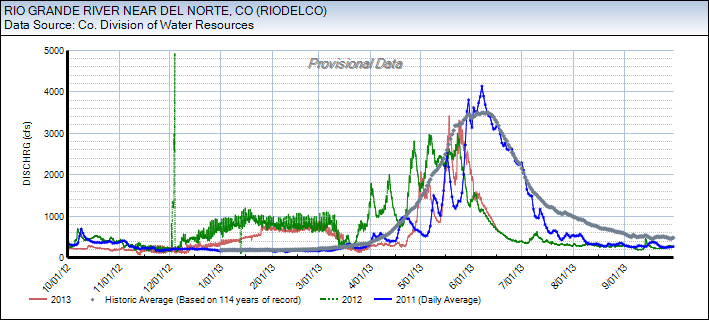
This season, onset of WY 2013 snowmelt runoff in the Rio Grande watershed was almost a month later than in WY 2012 thanks to this spring’s unsettled March and early April weather, versus the extremely dry and sunny March of 2012. Overall, despite the frequent interruptions to D8/D6 radiative forcing described above, and the very erratic flows, the WY 2013 ascending limb shows a steeper rate of increase, to a higher peak, than in WY 2012. As a result, the WY 2013 peak in discharge was still weeks ahead of the median date of peak, but did come close to the median peak discharge value. As the calendar approaches summer solstice, radiative forcing of snowmelt is likely to be much more sustained in the remaining, very dirty snowcover. As of this writing (June 17, 2013) the Rio Grande hydrograph descending limb has fallen sharply, to less than one quarter of the WY 2013 peak level, just as the median peak flow should be ocurring. Total SWE available for melt was slightly lower this year than last, so the final WY 2013 hydrograph will, as in 2012, depict a rapid decline in discharge levels on the descending limb and another early, “flashy”, and very low-yielding snowmelt runoff cycle ending far below median discharge levels.