 CODOS Summary for Willow Creek Pass
Summary | Snowpack | Melt Rate | Stream Flows
Summary
Water Year 2013 entered late winter with dismal snowpack development at ten of the eleven CODOS dust-on-snow monitoring sites, with Willow Creek Pass as the single exception. Willow Creek Pass quickly developed and sustained a near-normal snowpack through March while SWE totals mirrored or even fell short of the very dry winter of WY 2012 at all other sites. Then, in April, all CODOS sites in the northern Front Range and Colorado River headwaters, including Willow Creek Pass, benefitted from a series of April and May winter storms that augmented snowpacks and eventually resulted in average or even above average peak SWE levels on average or later-than-average dates. In the southwestern mountains, fewer and/or smaller April/May storms failed to offset the dry beginning to WY2013 winter. CODOS sites in the San Juan Mountains experienced, for the second year, substantially sub-par peak SWE values, on near-average dates. In between, the Central Mountains, Grand Mesa, Park, and northern Gore ranges came closer to but still fell short of average snowpacks. Willow Creek Pass stood out among those sites where WY 2013 snowpack development surged in late winter and spring, with peak SWE substantially exceeding the median value, very near the median peak SWE date.
At the CSAS Senator Beck Basin Study Area at Red Mountain Pass, the primary CODOS monitoring site, WY2013 produced a total of ten separate dust-on-snow events, a lower total count than in the past three seasons. However, the actual mass of dust deposited at Senator Beck Basin in WY 2013 was greater than in any prior season, including the “Martian Winter” of WY 2009. Dust season began at Senator Beck Basin in November with a single event, February and March delivered four additional events, but the vast majority of dust deposition occurred during events D6 on April 8th and the long-duration D8 event of April 15-17. As of late March, dust layers observed at Senator Beck Basin were either weak or not present at CODOS sites farther north and east, creating some hope that WY 2013 might be dust-free in parts of the state. Then, dust events D6 and D8 spelled the end to that possibility with significant depositions statewide near the top of the snowpack.
As at all CODOS sites, dust layers D6 and D8 played the principal role in very significantly reducing snowcover albedo in the Willow Creek watershed as they became exposed, merged, and remained exposed. However, Willow Creek differs from other CODOS monitored watersheds due to the extent of pine beetle effects on forest cover and potential consequent changes in its snow hydrology. Melt rates at the nearby Willow Creek Pass Snotel site (not significantly impacted by the pine beetle outbreak) were comparatively high despite periods of unsettled weather and substantial fresh snowfalls, disrupting the potential radiative forcing of snowmelt. Those periods of lower solar insolation, because of cloud cover, or higher albedo after fresh snowfalls occasionally slowed or reversed stream flow surging and extended the runoff cycle.
SnowPack Discussion

SWE accumulation and ablation for Water Years 2012 and 2013, with dust-on-snow events shown as brown bars, by date (as observed at the Senator Beck Basin Study Area). The long-duration D8 event of April 15-17, 2013, is shown as a heavier bar. Note that not all dust layers observed at Senator Beck Basin were also found at other CODOS sites.
Snowpack formation at the Willow Creek Pass CODOS site and nearby Willow Creek Pass Snotel site began well and quickly brought the snowpack to and above a median SWE level. Precipitation then slowed for several weeks before eventually resuming in mid-December and returning SWE to median levels by the New Year. SWE accumulation then proceeded at slightly slower than median pace, falling just below median levels during February and early March before once again intersecting the median in mid-March.
Despite having logged four dust-on-snow events at Senator Beck Basin by March 18, the March 19, 2013 snow profile at the Willow Creek Pass CODOS site found no discernible dust layers at that location. That snow profile found some cold content remaining in the snowpack, at a mean snow temperature of -2.5° C. For still unclear reasons, snowpack SWE differences between the CODOS snow pit site, on a slightly south-facing open meadow, and the adjoining Willow Creek Pass Snotel, located in the adjoining forest, were larger this season than in prior seasons, with the Snotel reporting the higher SWE values.
Subsequent to that site visit, on April 8, 2013 a storm (CSAS Storm #19) delivered both fresh snow as well as dust event D6 to the Willow Creek Pass locale (and other Front Range CODOS sites), as was confirmed in our April 12 snow profile (as well as layer D5). That profile presented a nearly isothermal snowcover at a mean temperature of -0.4° C as well as clear evidence of recent melt episodes in and below dust layer D6 (since buried in new snow). That melt episode, perhaps merging D6 with the earlier dust layer D5, contributed to the snowpack warming since March 19.
Yet more spring storms delivered additional snows and Peak SWE at the Willow Creek Pass Snotel followed on May 4, 2013 at 19.3”, fully 11.6” higher than the WY 2012 peak and 4.8” above the median peak SWE value of 14.5”. Peak SWE WY 2013 fell exactly on the median date of Peak SWE (May 4) but nearly a month later than peak SWE in WY 2012 (March 8). Peak SWE was preceded by another winter storm (CSAS Storm #20) and the long-duration D8 dust event of April 15-17. A snow profile on May 10 found layers D8 merged with D6 just below a thin layer of recent clean snow undergoing rapid melt. Merged layers D8/D6 had clearly been recently exposed, at the surface, significantly enhancing melt rates and saturating the isothermal snowcover.
Snowpack ablation was also underway at the Snotel site in early May, enhanced by the emergence of dust layer D8 and the merging of layer D8 with layer D6. Aside from a minor rebound in mid-May, and despite disruptions to maximum potential radiative forcing caused by unsettled (cloudy) weather and additional snowfalls, WY 2013 snowmelt was much more rapid than in WY 2012 and the Willow Creek Pass Snotel recorded “snow all gone” (SAG) on June 4, 2013, still three weeks later than in WY 2012.
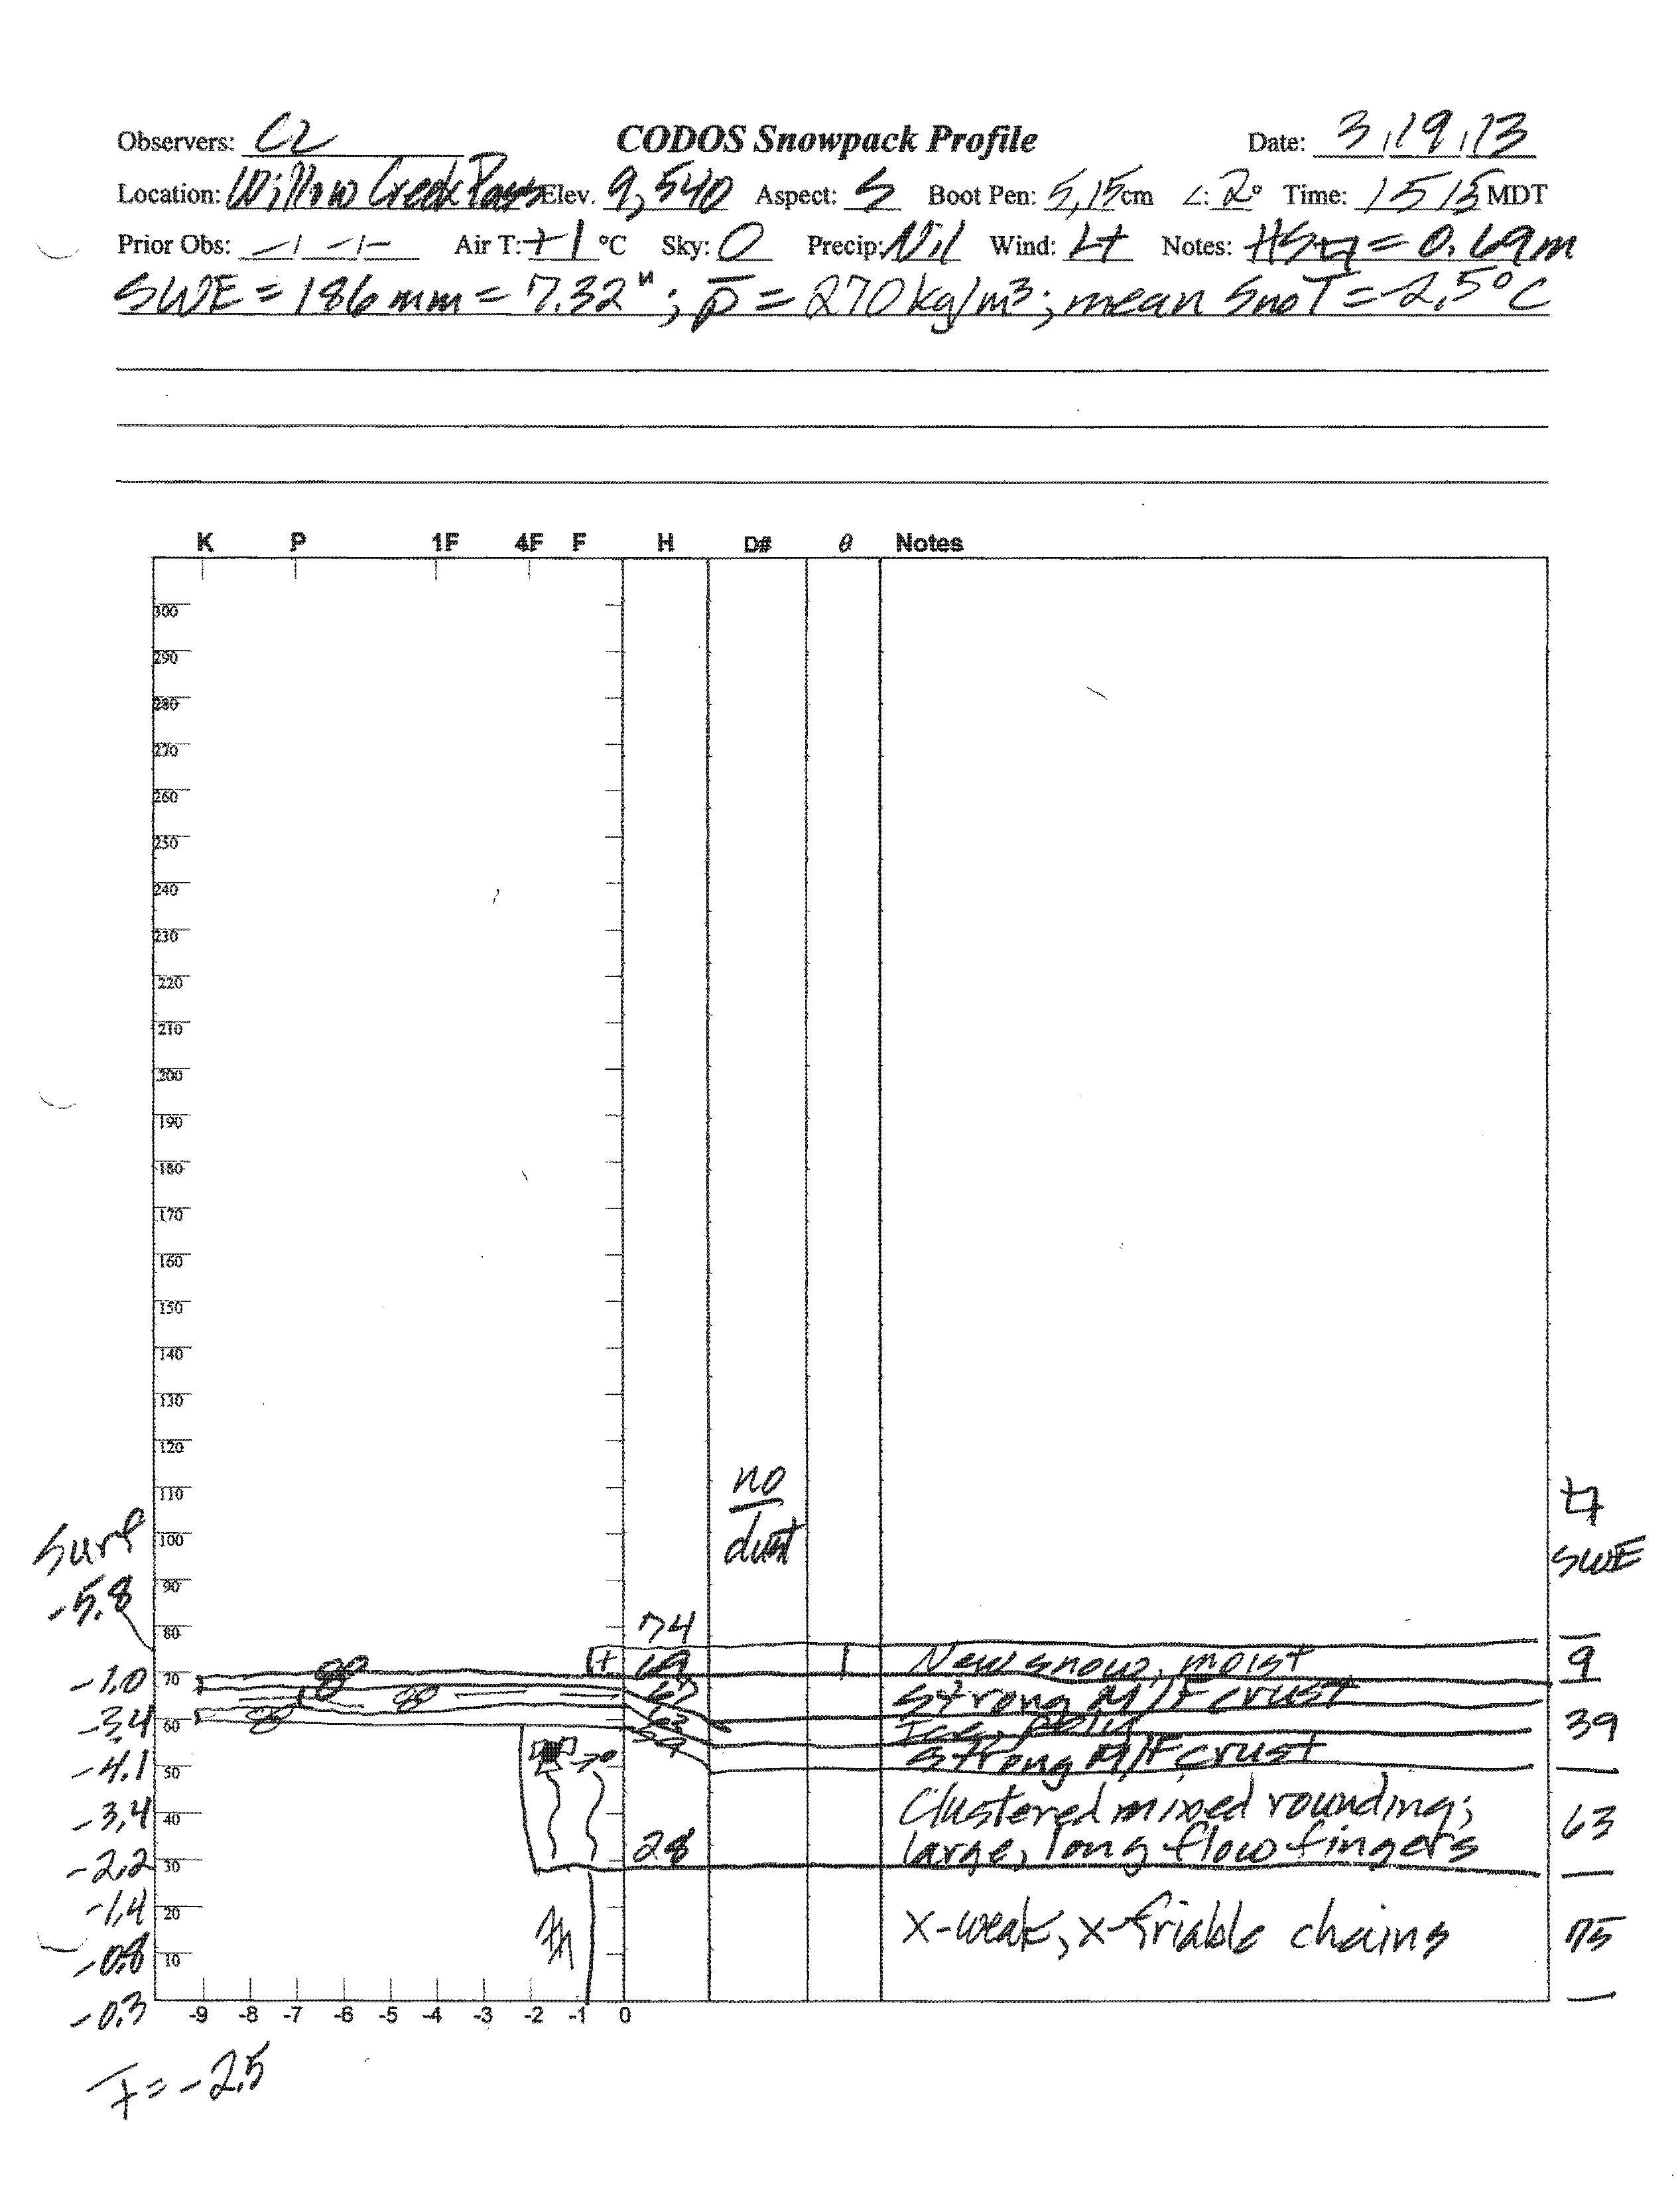
The March 23, 2013 snow profile at the Willow Creek Pass CODOS site. No dust was discernible in
this
snowpack,
raising hopes that this could be a dust-free season at least in the northern mountains.
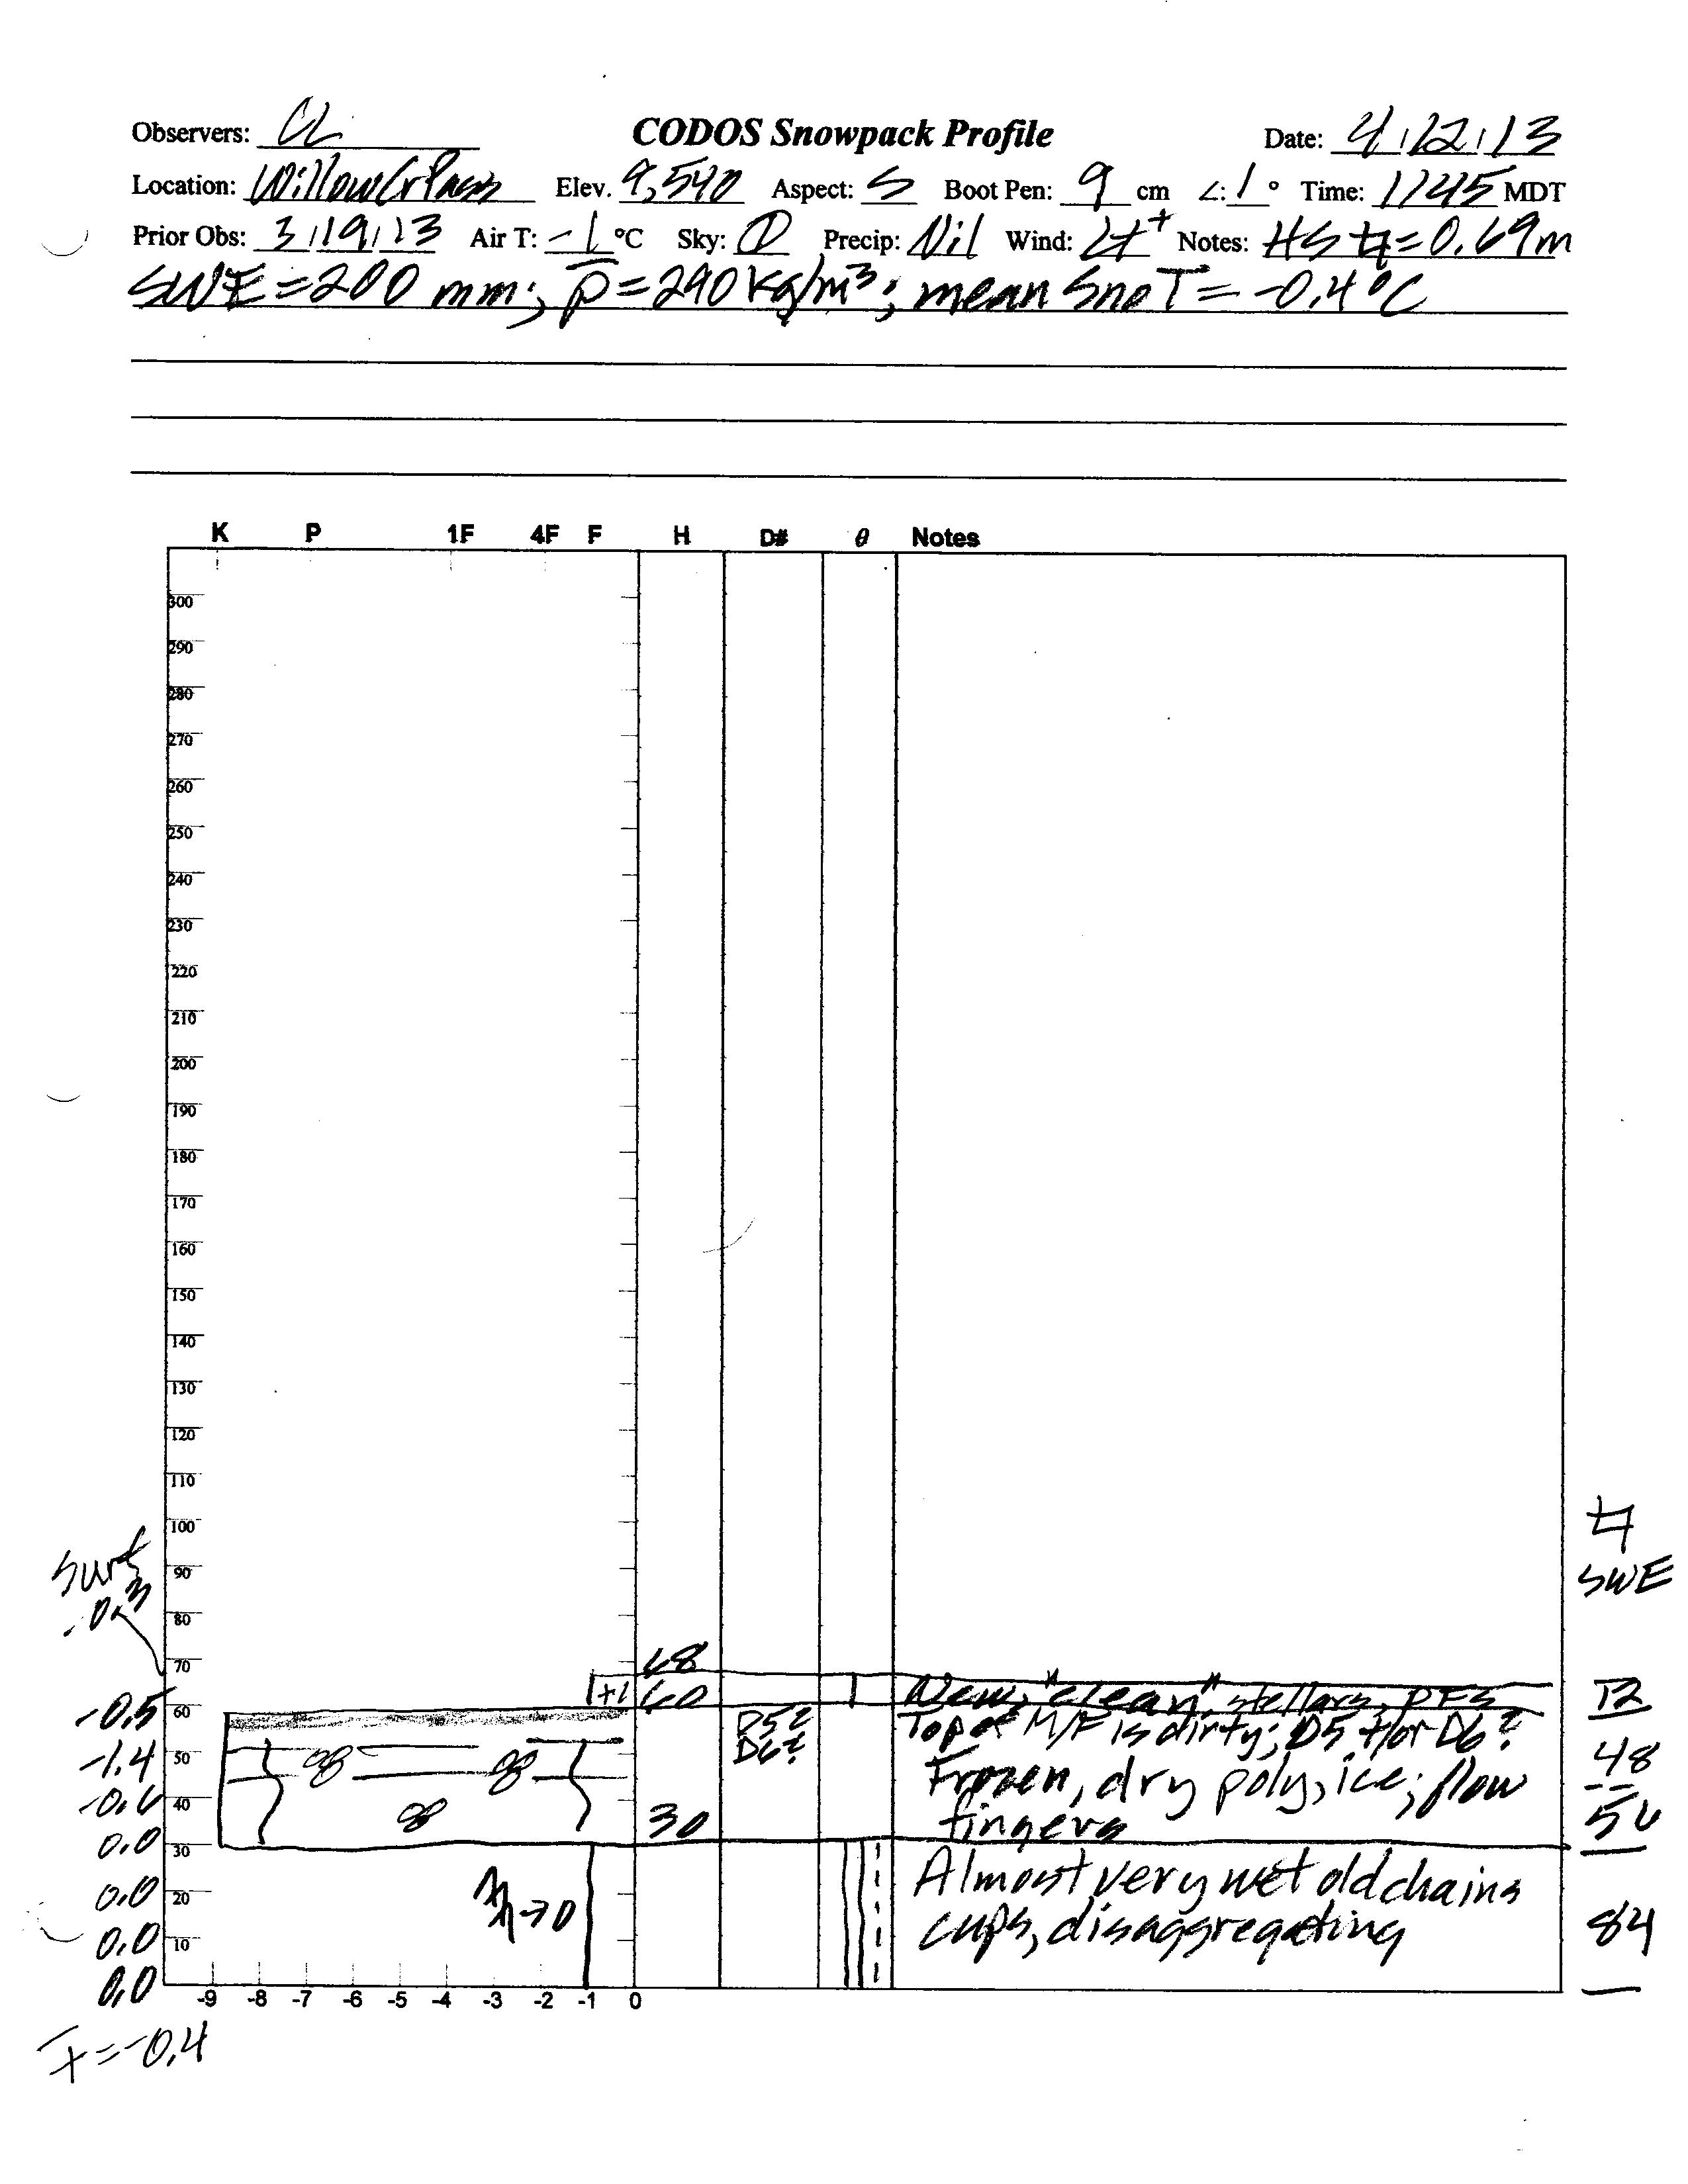
On April 12 dust layer D6 was strongly present, buried 3” below the surface. Clear evidence of a surface melt episode was observed in the
snow
immediately below D6 and snow temperatures had warmed from a mean of -2.5° C on March 19 to a mean of -0.4° C, effectively isothermal.
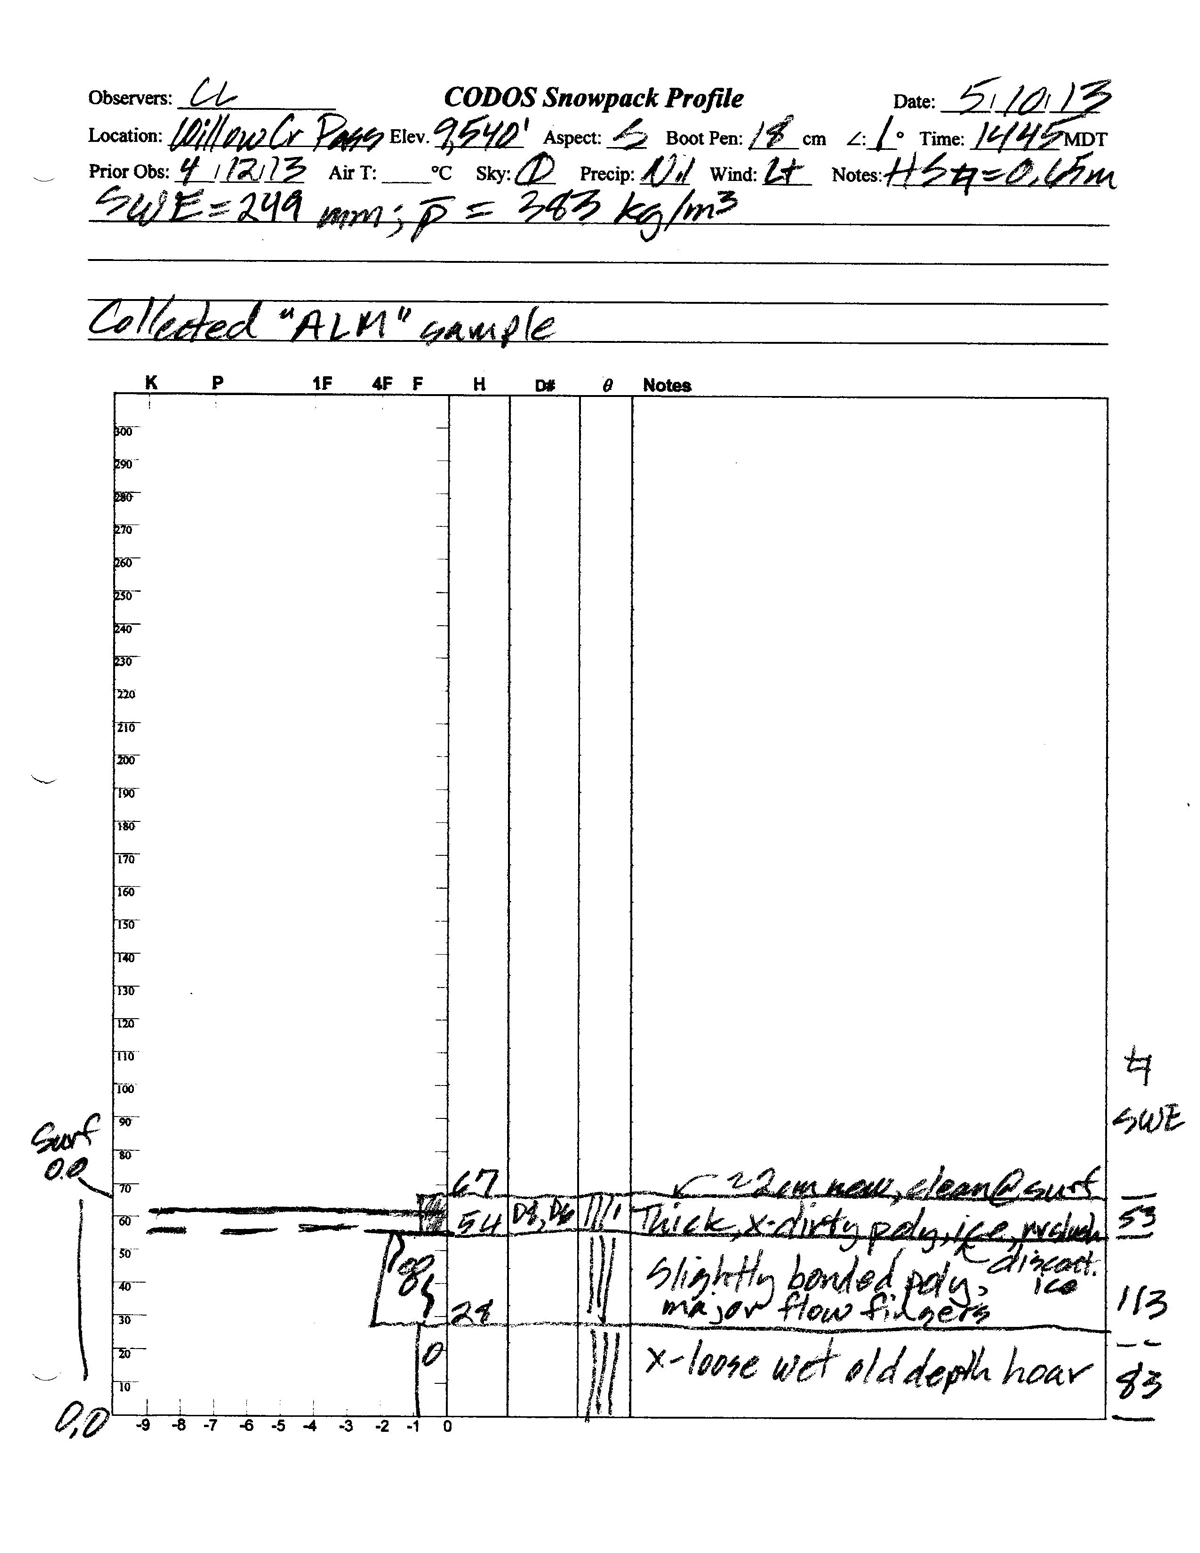
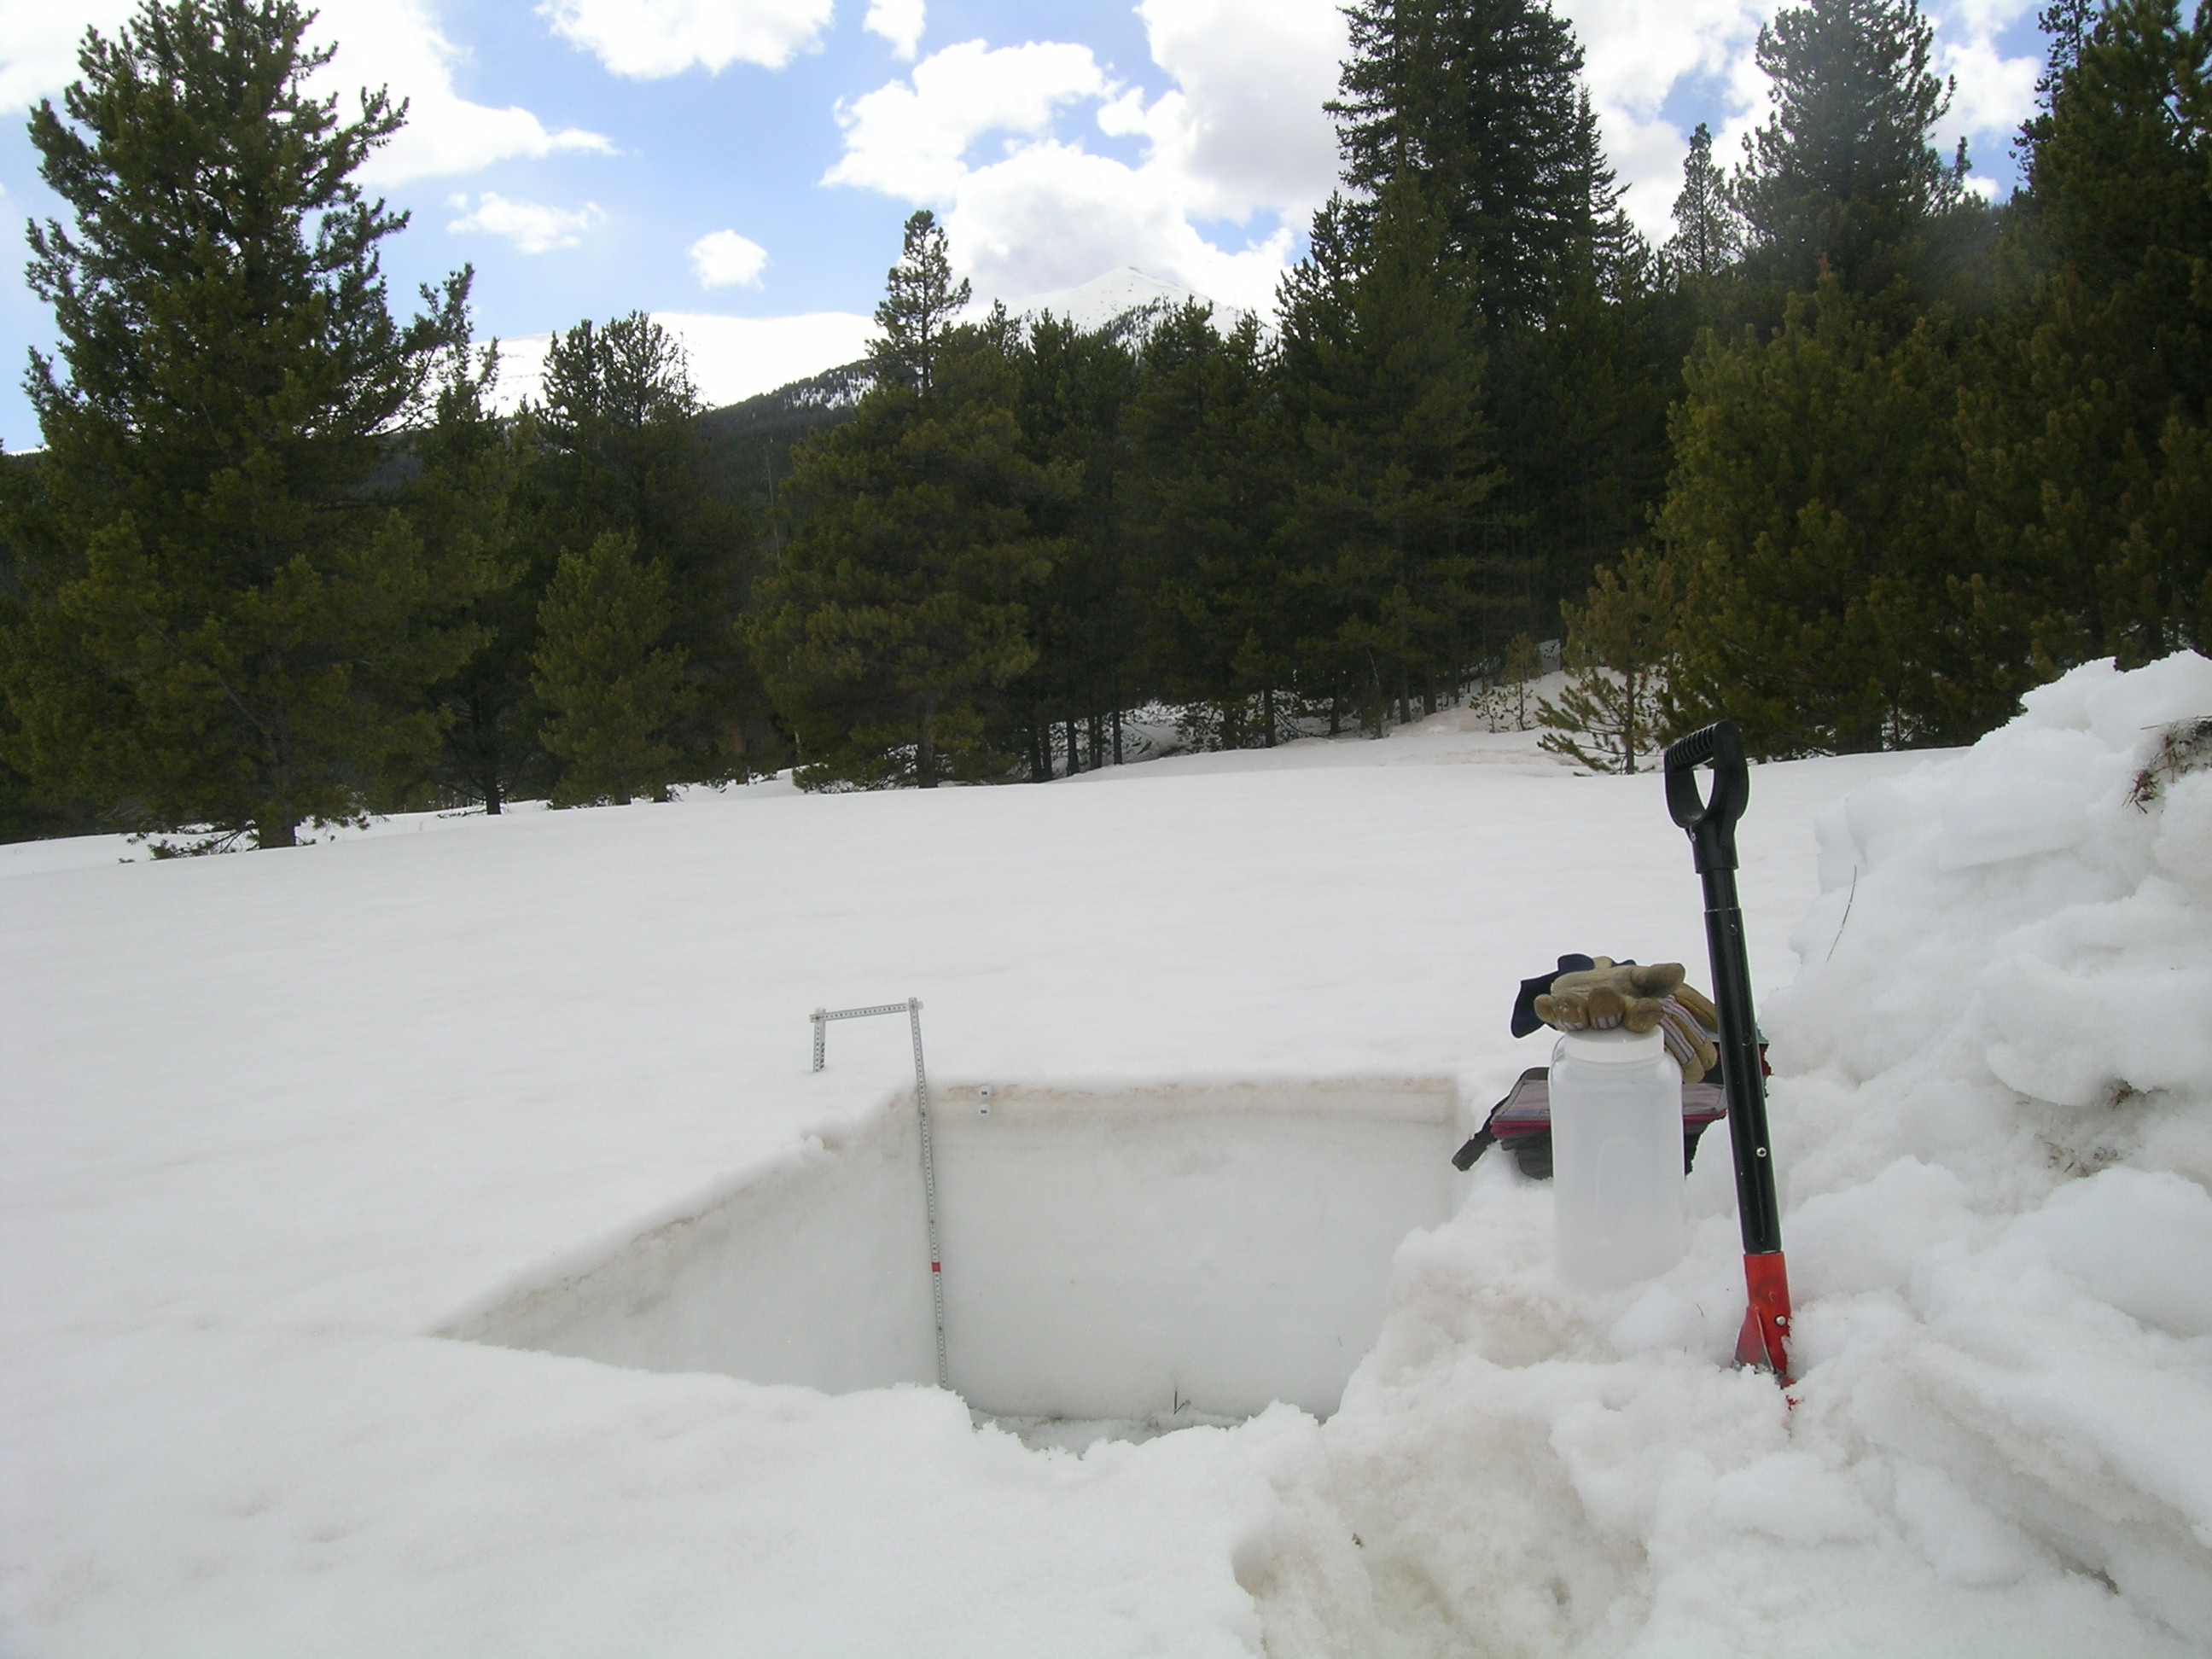
Snowpack ablation and snowmelt runoff was well advanced by May 10, with dust layers D8/D6 merged and just below a layer of recent clean snow
undergoing rapid melt. The entire snowpack was classified as “very wet”, with slush at the surface. A concentrated sample of merged layers
D8-D5
dust was collected and is undergoing chemical and other analyses by USGS.
Melt Rate
As was the case at Senator Beck Basin, layers D8 and D6 were the dominant dust-in-snow features in the Willow Creek Pass locale. Even though the heavy dust layers D8 and D6 were deposited high in the snow column, and were quick to emerge following peak SWE, periods of unsettled weather and frequent spring snowfalls in the Willow Creek Pass locale often reduced the maximum potential radiative forcing effects of the merged D8/D6 dust layers. Although those layers did experience periods of sustained exposure under clear, sunny skies following the early May peak in SWE, cloud cover sometimes reduced solar insolation onto the exposed D8/D6 layer and/or minor amounts of fresh snow temporarily restored a higher albedo to the remaining snowpack and marginally slowed melt rates, slightly prolonging the snowmelt cycle.
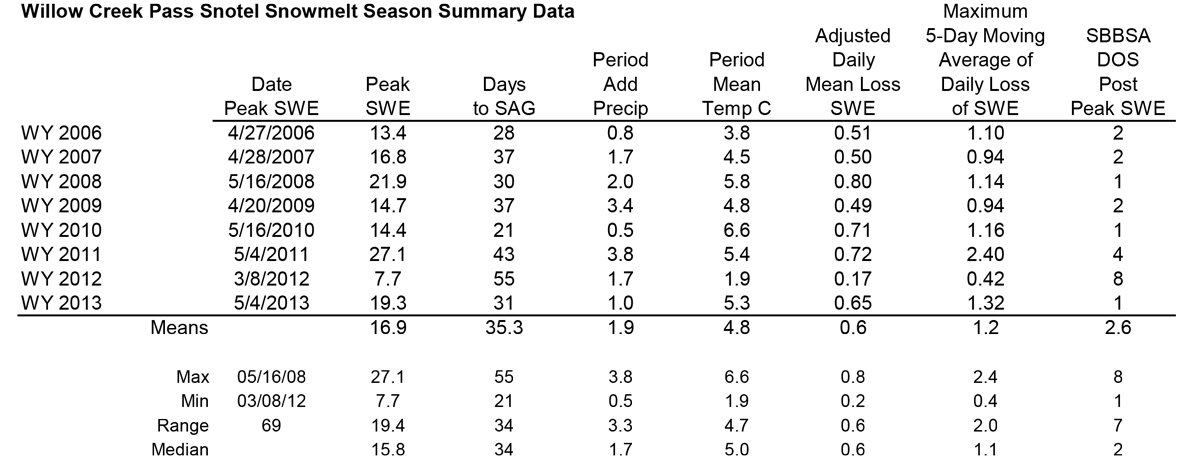
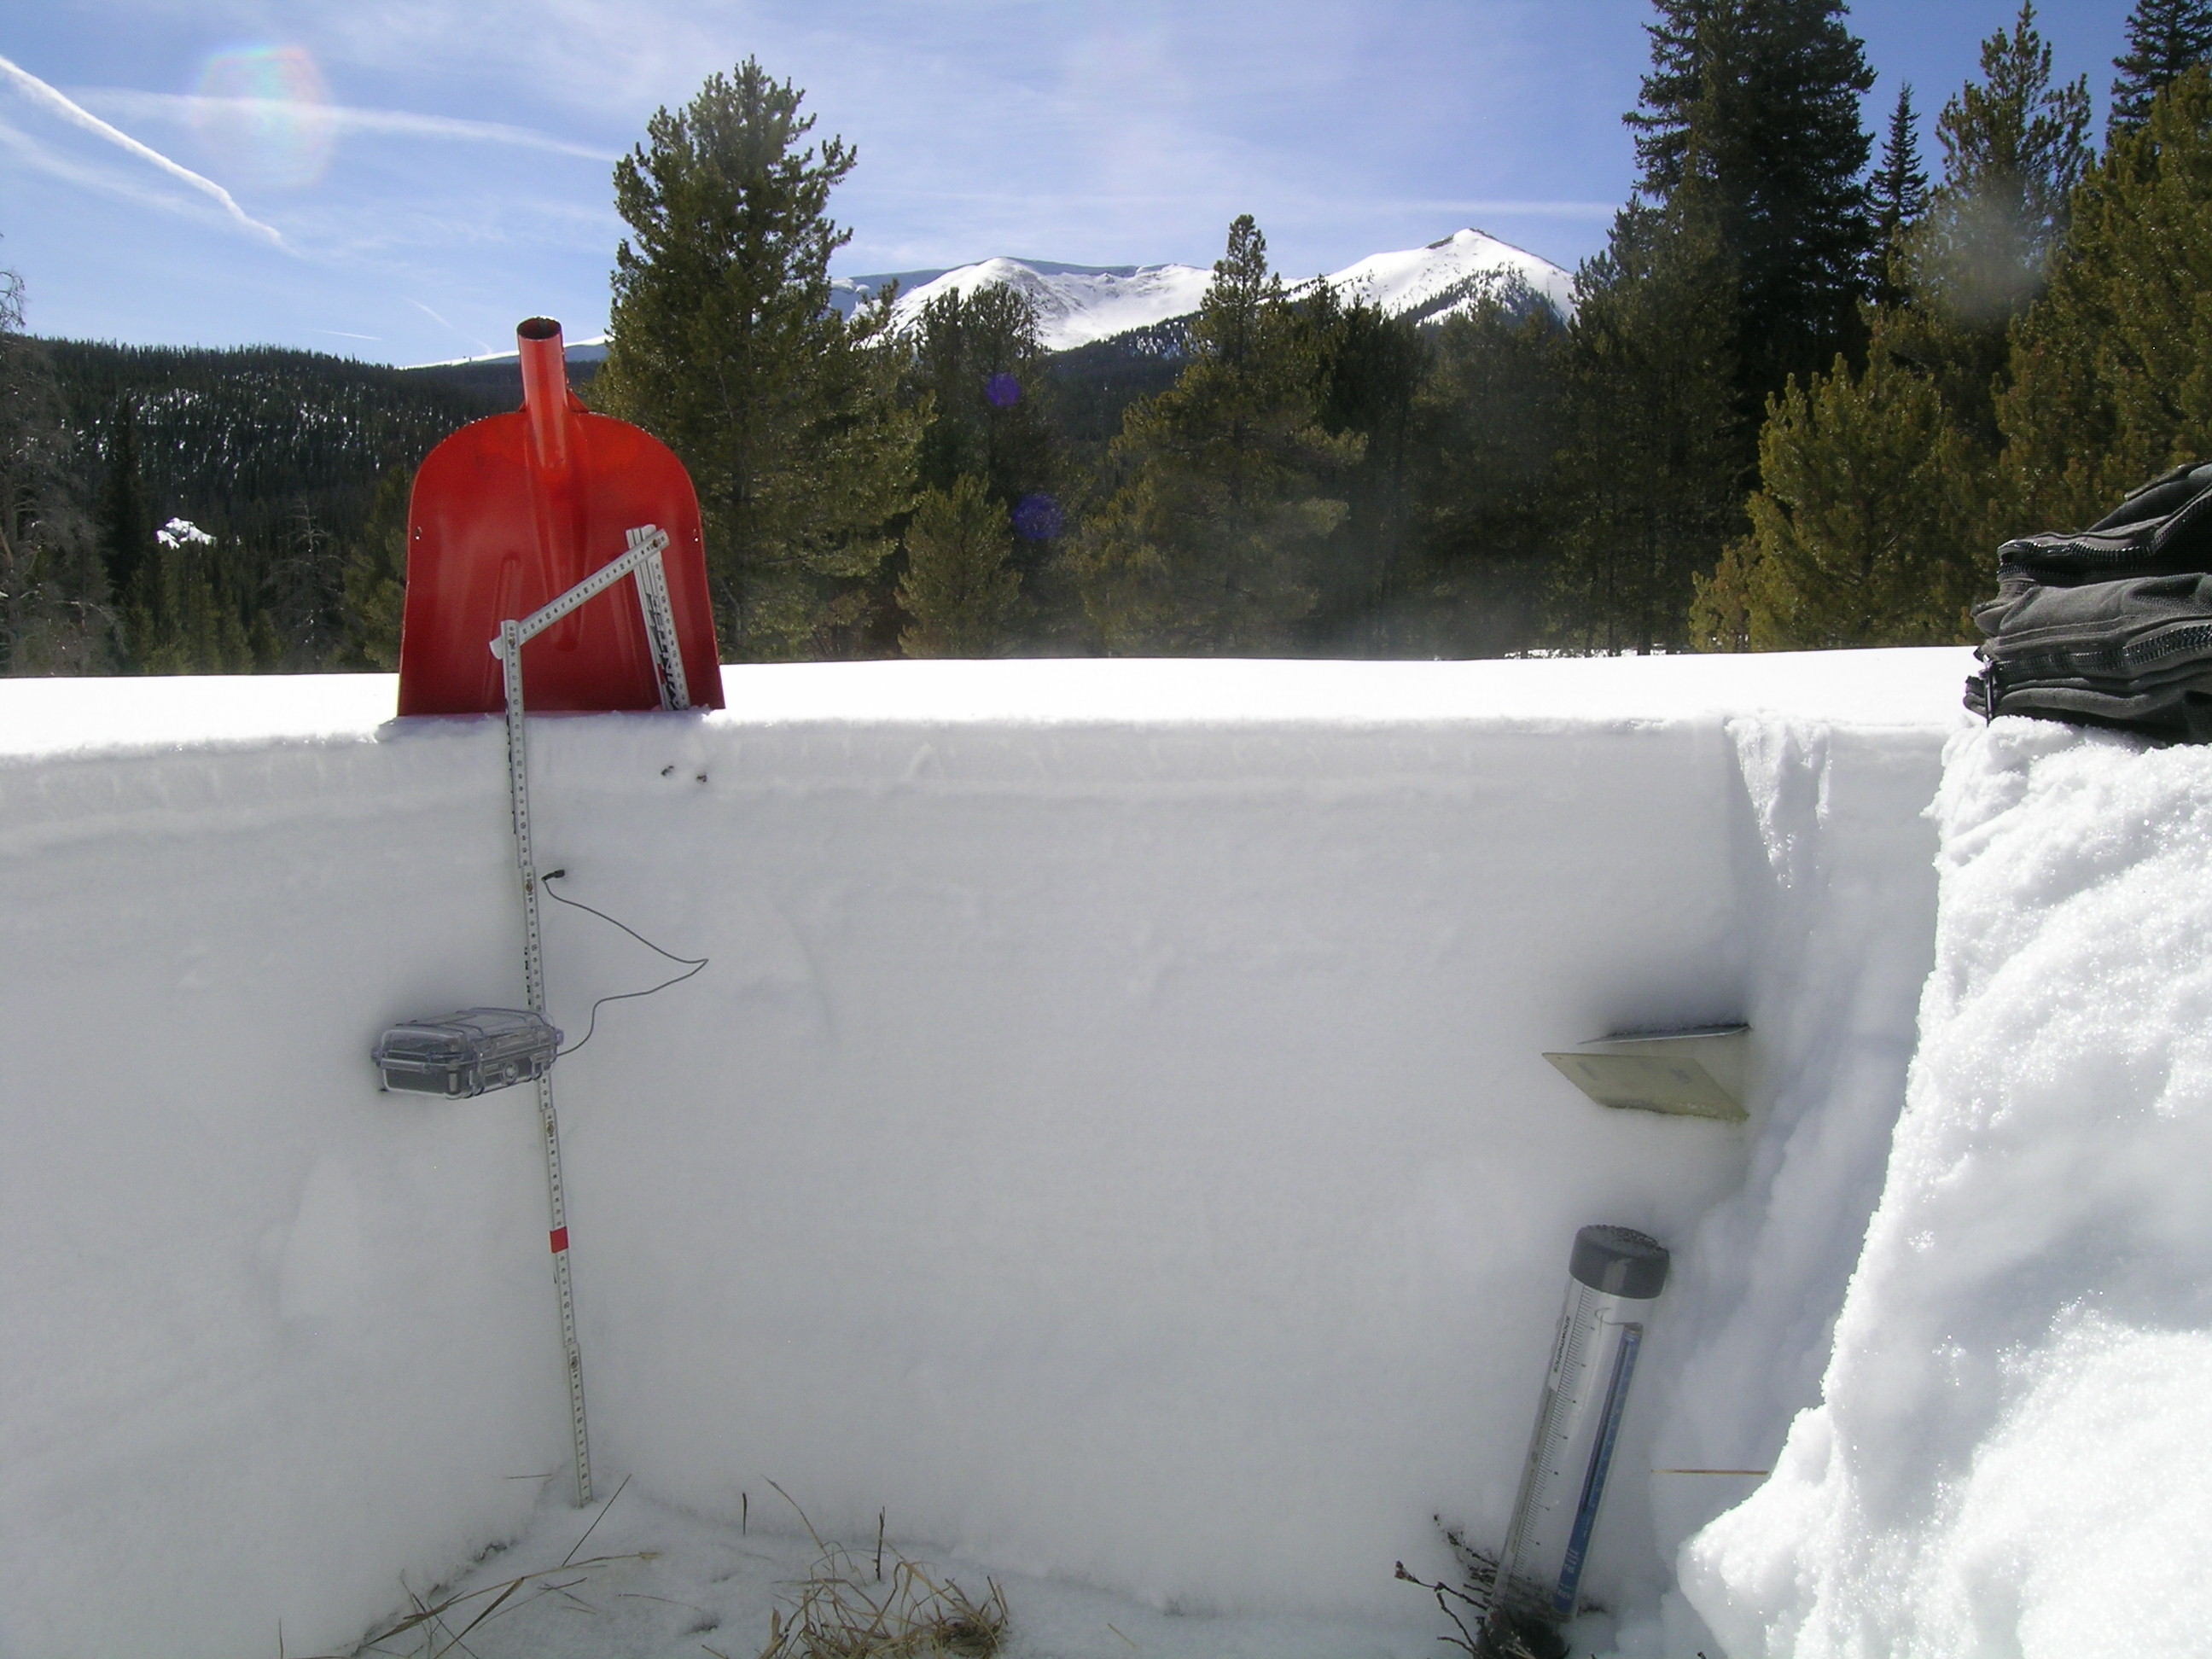
Analysis of Willow Creek Pass Snotel data for Water Years 2006-2013 snowmelt seasons showing date and quantity of peak SWE, days from peak SWE to “snow all gone” (SAG), total additional precipitation after the date of peak SWE, an “adjusted” mean daily rate of snowmelt adding the additional precipitation to the peak SWE total, the maximum five-day moving average of daily melt, and the mean air temperature over the entire snowmelt period, from peak SWE to SAG. The Willow Creek Pass Snotel site is partially shaded by surrounding forest.
Following peak SWE at the Willow Creek Pass Snotel of 19.3” on May 4, 2013, an additional 1.0” of SWE was added to the snowpack during the ablation cycle for an adjusted total of 20.3” of SWE available to melt. Snowpack ablation to SAG took 31 days, under substantially warmer mean air temperatures than in spring 2012, and under intense radiative forcing produced by merged dust layers D8 and D6. Spring 2013 melt rates were as high as 1.5” SWE loss per day and the mean daily SWE loss over the entire snowmelt period was 0.65” per day, versus 0.17” per day in spring 2012.
Given the minimal precipitation following peak SWE, interruptions in radiative forcing described above were less frequent at the Willow Creek Pass site than at other CODOS sites where peak SWE occurred earlier. The maximum 5-day moving average daily melt rate was 1.32” SWE loss per day, second only to the (also very late and very dusty) snowmelt season of spring 2011. SAG occurred on June 4, very near the median date of SAG at Willow Creek Pass. In spring 2012, a lighter dust year, an adjusted total of 9.4” of SWE available for melt was ablated to SAG in 55 days at a mean rate of 0.17” of SWE loss per day.
WY 2013 SWE accumulation and ablation at the Willow Creek Pass Snotel station, with upper and lower quartiles of period of record shown in light grey, middle quartiles in dark grey, and the median trace for the period of record shown as a dashed line.
STREAM FLOWS
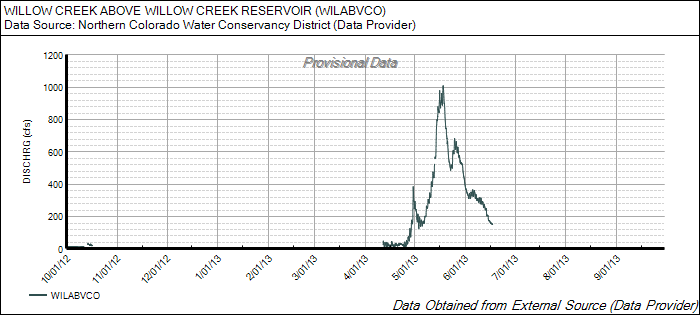
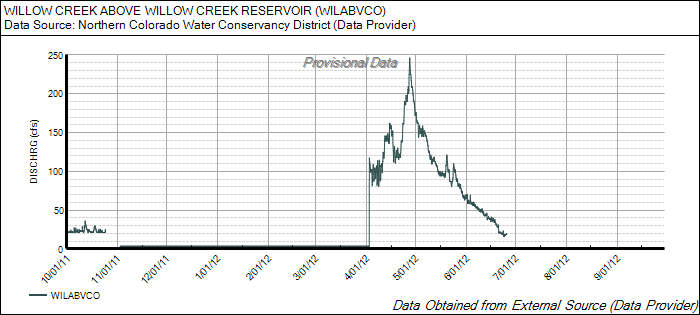
Stream gauge data Willow Creek above Willow Creek Reservoir. Data are provided by Northern Water Conservancy District. No additional station information is available and median flow data for the period of record at this gauge are not included in the hydrograph provided.
WY 2012 snowmelt runoff began at the Willow Creek Above Willow Creek Reservoir early, before the gauge came on line. Discharge surged to a peak in late April and then equally rapidly declined.
This season, runoff began later, delayed by the unsettled weather and welcome additional snows of April and early May. Following a short surge in late April, a final prolonged surge reached a peak four times higher than recorded in spring 2012. The descending limb immediately following the peak was particularly steep but, following a small rebound in flows, has slowed.
The absence of period of record median flow data on these graphs precludes comparison to historic behaviors. Direct observations of Willow Creek flows in both years suggest that spring 2013 runoff did not approach the near-record spring 2011 Willow Creek flows, and may have instead been approximately average.