Senator Beck Stream Gauge
37°54’24.42274″N, -107°42’33.94108″W; 11,030′
The Stream Gauge was re-started on March 12, 2013 (DOY 71) for the season. See Archived Data for past season datasets and metadata.
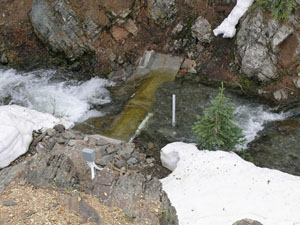 A view from above of the broad-crested, notched weir during spring runoff in May 2004. The weir has a design capacity approaching 40 cfs and is equipped with a staff gauge. Automated sensor measurements include stage height (Druck™ PDCR 1830-8388 transducer) and water conductivity and temperature (Campbell Scientific™ CS547A). Data is logged on a Campbell Scientific™ CR10X and accessed via RF link. |
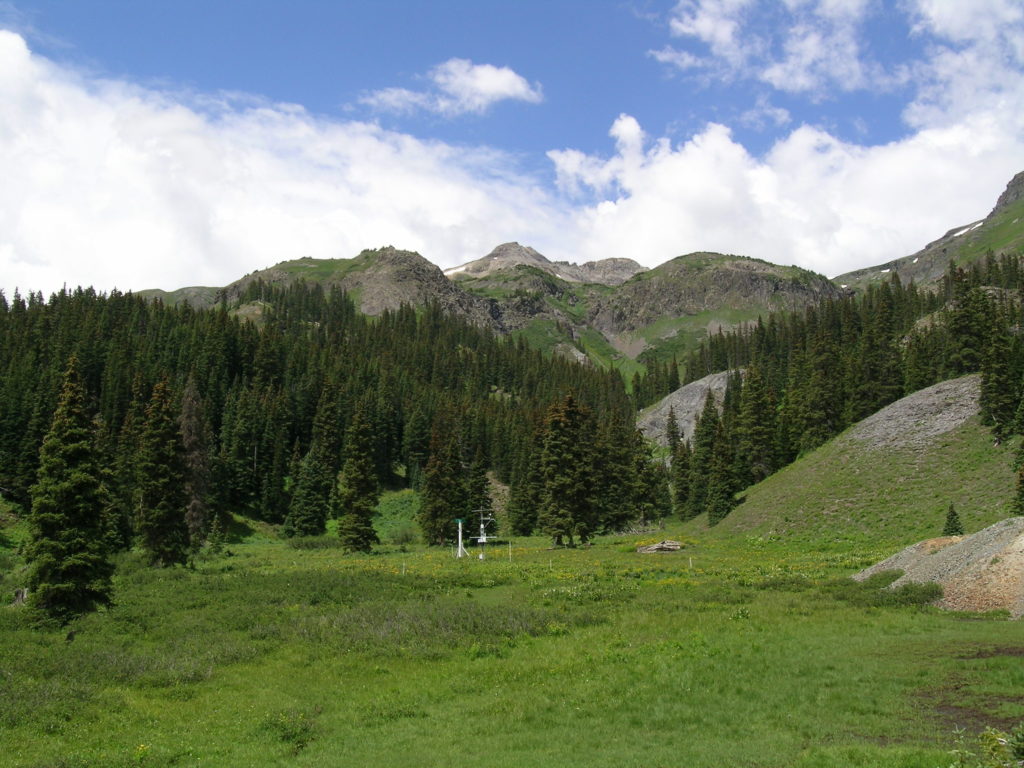
The CSAS’s Senator Beck Stream Gauge (SBSG) is located at the “pour point” of the Senator Beck Basin Study Area at approximately 11,030’ (3362m), just a few yards above the merging of the unnamed stream draining Senator Beck Basin with another unnamed stream, forming Red Mountain Creek. The constriction of the stream channel at the site of SBSG, cutting a notch through exposed bedrock, affords an excellent setting for a stream monitoring station. Monitoring steep, alpine streams is a technical challenge and the broad-crested, notched weir installed at SBSG represents the best approach in this setting. As with all stream gauging stations, streamflows at this station were calibrated by making a series of manual streamflow measurements at low, medium, and high “stages” (depths) of flow and then empirically deriving a “discharge” (or “Q”) equation from those data. This gauge is operated from late winter through late fall, only. Streamflow declines to a relatively static and very low “base flow” over the winter and the potential for freezing damage to sensors does not warrant monitoring that base flow. Automated measurements of the depth of water in the stream gauging station are made every five seconds by a weighing transducer. Based on that measurement of water depth, the volume of water passing through the gauge, or discharge “Q”, is automatically calculated in units of cubic feet per second (cfs). Water temperature is also measured (Celsius) every five seconds. All these five-second measurements are averaged each hour to generate 1-hour data, and again once every 24 hours, at midnight, to generate 24-hour ‘summary’ data. Times reported are in Mountain Standard Time; we do not utilize daylight savings time.