 Water Year 2013 CODOS Summary
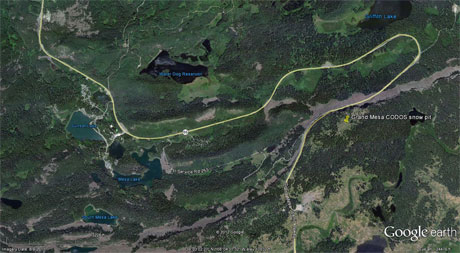
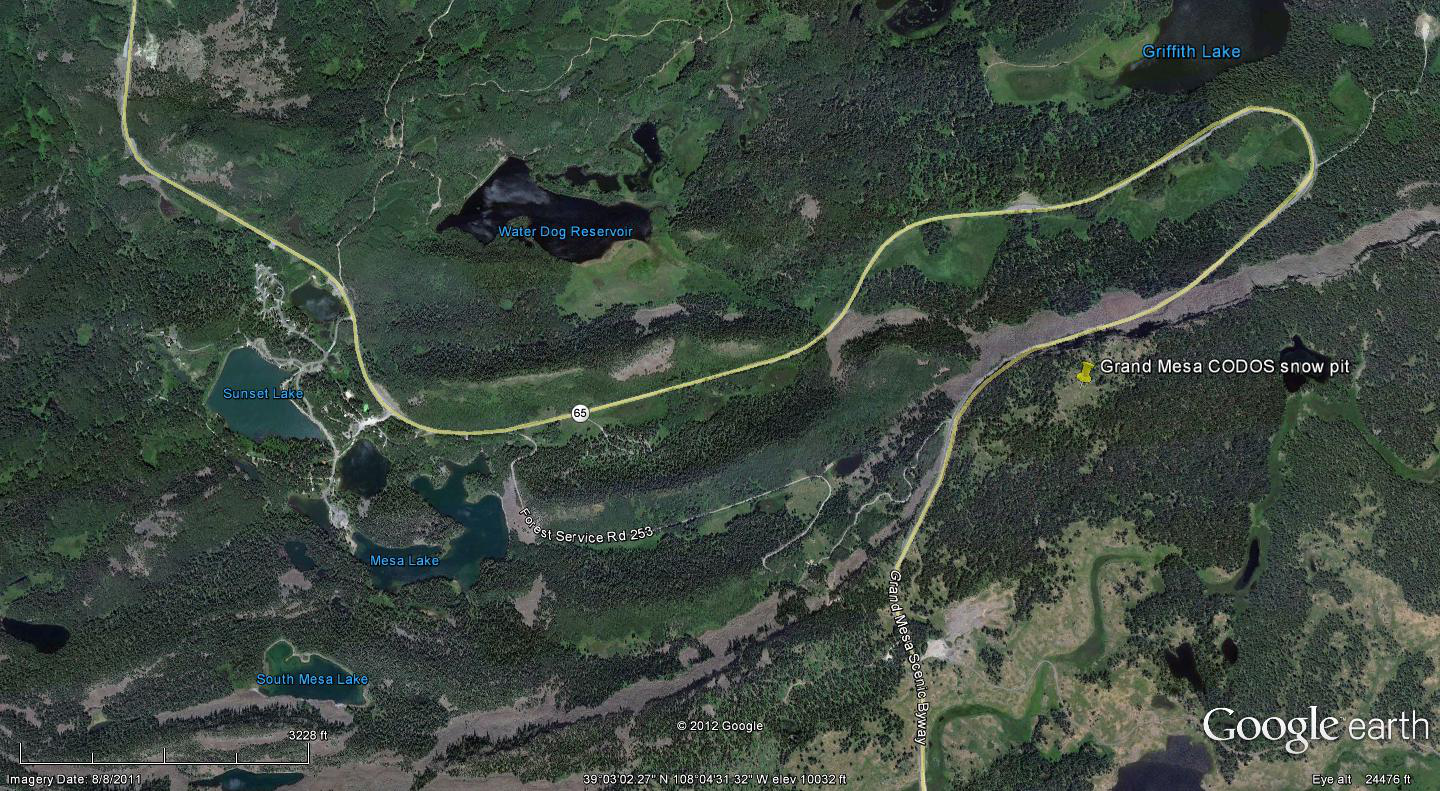
for Grand Mesa
Summary | Snowpack | Melt Rate | Stream Flows
Summary
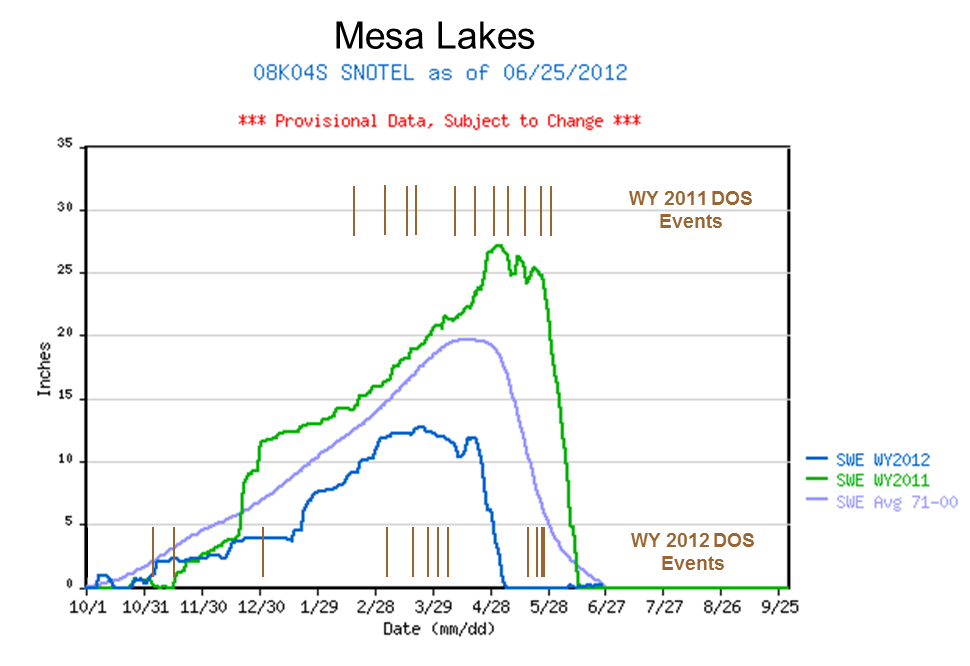
Water Year 2013 entered late winter with dismal snowpack development at ten of eleven CODOS dust-on-snow monitoring sites, Willow Creek Pass being the single exception. Through March 2013, snowpack SWE totals at all other sites resembled or even fell short of the very dry winter of WY 2012, raising concerns about back-to-back drought seasons. That broadly consistent spatial pattern in scant precipitation began to diverge in April, 2013. CODOS sites in the northern Front Range and Colorado River headwaters benefitted most from a series of April and May winter storms that augmented snowpacks and eventually resulted in average or even above average peak SWE levels on average or later-than-average dates. In the southwestern mountains, fewer and/or smaller April/May storms failed to offset the dry beginning to WY2013 winter. CODOS sites in the San Juan Mountains experienced, for the second year, substantially sub-par peak SWE values, on near-average dates. In between, the Central Mountains, Grand Mesa, Park, and northern Gore ranges came closer to but still fell short of average snowpacks. The Mesa Lakes Snotel site near the Grand Mesa CODOS site was among those sites where WY 2013 snowpack development and peak SWE fell short of average values but exceeded WY 2012 levels.
At the CSAS Senator Beck Basin Study Area at Red Mountain Pass, the primary CODOS monitoring site, WY2013 produced a total of ten separate dust-on-snow events, a lower total count than in the past three seasons. However, the actual mass of dust deposited at Senator Beck Basin in WY 2013 was greater than in any prior season, including the “Martian Winter” of WY 2009. Dust season began at Senator Beck Basin in November with a single event, February and March delivered four additional events, but the vast majority of dust deposition occurred during events D6 on April 8th and the long-duration D8 event of April 15-17. As of late March, dust layers observed at Senator Beck Basin were either weak or not present at CODOS sites farther north and east, creating some hope that WY 2013 might be dust-free in parts of the state. Then, dust events D6 and D8 spelled the end to that possibility with significant depositions statewide near the top of the snowpack.
As at all CODOS sites, dust layers D6 and D8 played the principal role in very significantly reducing snowcover albedo on the Grand Mesa as they became exposed, merged, and remained exposed. Melt rates at the nearby Mesa Lakes Snotel site were comparatively high despite periods of unsettled weather and smaller fresh snowfalls, disrupting the maximum potential radiative forcing of snowmelt. Those periods of lower solar insolation, because of cloud cover, or higher albedo after fresh snowfalls often slowed or reversed stream flow surging and extended the runoff cycle.
SnowPack & Dust Discussion
SWE accumulation and ablation for Water Years 2012 and 2013, with dust-on-snow events shown as brown bars, by date (as observed at the Senator Beck Basin Study Area). The long-duration D8 event of April 15-17, 2013, is shown as a heavier bar. Note that not all dust layers observed at Senator Beck Basin were also found at other CODOS sites.
Snowpack formation at the Grand Mesa CODOS site and nearby Mesa Lakes Snotel site began late, in early November, when a single significant storm (CSAS Storm #1) quickly brought the snowpack to a median SWE level. Precipitation then stalled for several weeks, and eventually resumed in mid-December. Despite a period of stormy weather and significant SWE gains in December (CSAS Storms #4-8). Early- and mid-January saw almost no further gains and SWE values remained in the lower quartile of the period of record thereafter, until mid-April. After a strong surge in late January (CSAS Storms # 10, 11, 12), SWE accumulation then proceeded during February and early March at rates comparable to the median rate of accumulation and at values closely matching WY 2012. Dust layers D1 (November 9) and D2 (February 8/9) were both discernible within the snowcover in our March 22, 2013 snow profile at the Grand Mesa CODOS site. No clearcut evidence was found in that snowpit of dust events D3 (March 6-8) or D4 (March17/18) or of layer D5 (March 21/22), perhaps yet to arrive later that day. Snow temperatures in this profile were comparatively warm, at a mean of -2.8° C.
On April 8 a storm (CSAS Storm #19) delivered both fresh snow as well as dust event D6, clearly present in our April 12 snow profile (as well as layer D5). That profile presented a nearly isothermal snowcover at a mean temperature of -0.6° C as well as clear evidence of recent melt episodes in and below the former snowpack surface containing dust layer D6 (since buried in new snow). That melt episode and perhaps earlier melt associated with prior dust layers contributed to the snowpack warming since March 22.
Peak SWE at the nearby Mesa Lakes Snotel followed on April 21 at 17.1”, 4.4” higher than the WY 2012 peak and only 1.2” below the median peak SWE value of 18.3”. Peak SWE WY 2013 was five days later than the median date of Peak SWE (April 16) and almost a month later than peak SWE in WY 2012. Peak SWE was preceded by another winter storm (CSAS Storm #20) and the long-duration D8 dust event of April 15-17. Snowpack ablation was underway by late April at the Snotel site, enhanced by the emergence of dust layer D8 and the merging of layer D8 with layer D6.
The Grand Mesa CODOS site visit on May 11 found snowpack ablation well underway at that open and sunny site, with a completely isothermal snowpack and dust layers D8/D6 merged some 3” below a layer of fresh but slushy clean snow at the surface. Merged D8/D6 had clearly been exposed prior to that recent storm and forced rapid surface melt, thoroughly wetting the entire snowpack to “very wet” condition. Aside from minor rebounds in mid-May, and despite disruptions to maximum potential radiative forcing caused by unsettled (cloudy) weather and additional snowfalls, snowmelt was slightly more rapid than in WY 2012 and the Mesa Lakes Snotel recorded “snow all gone” (SAG) on May 27, 2013, fully 21 days later than in WY 2012.
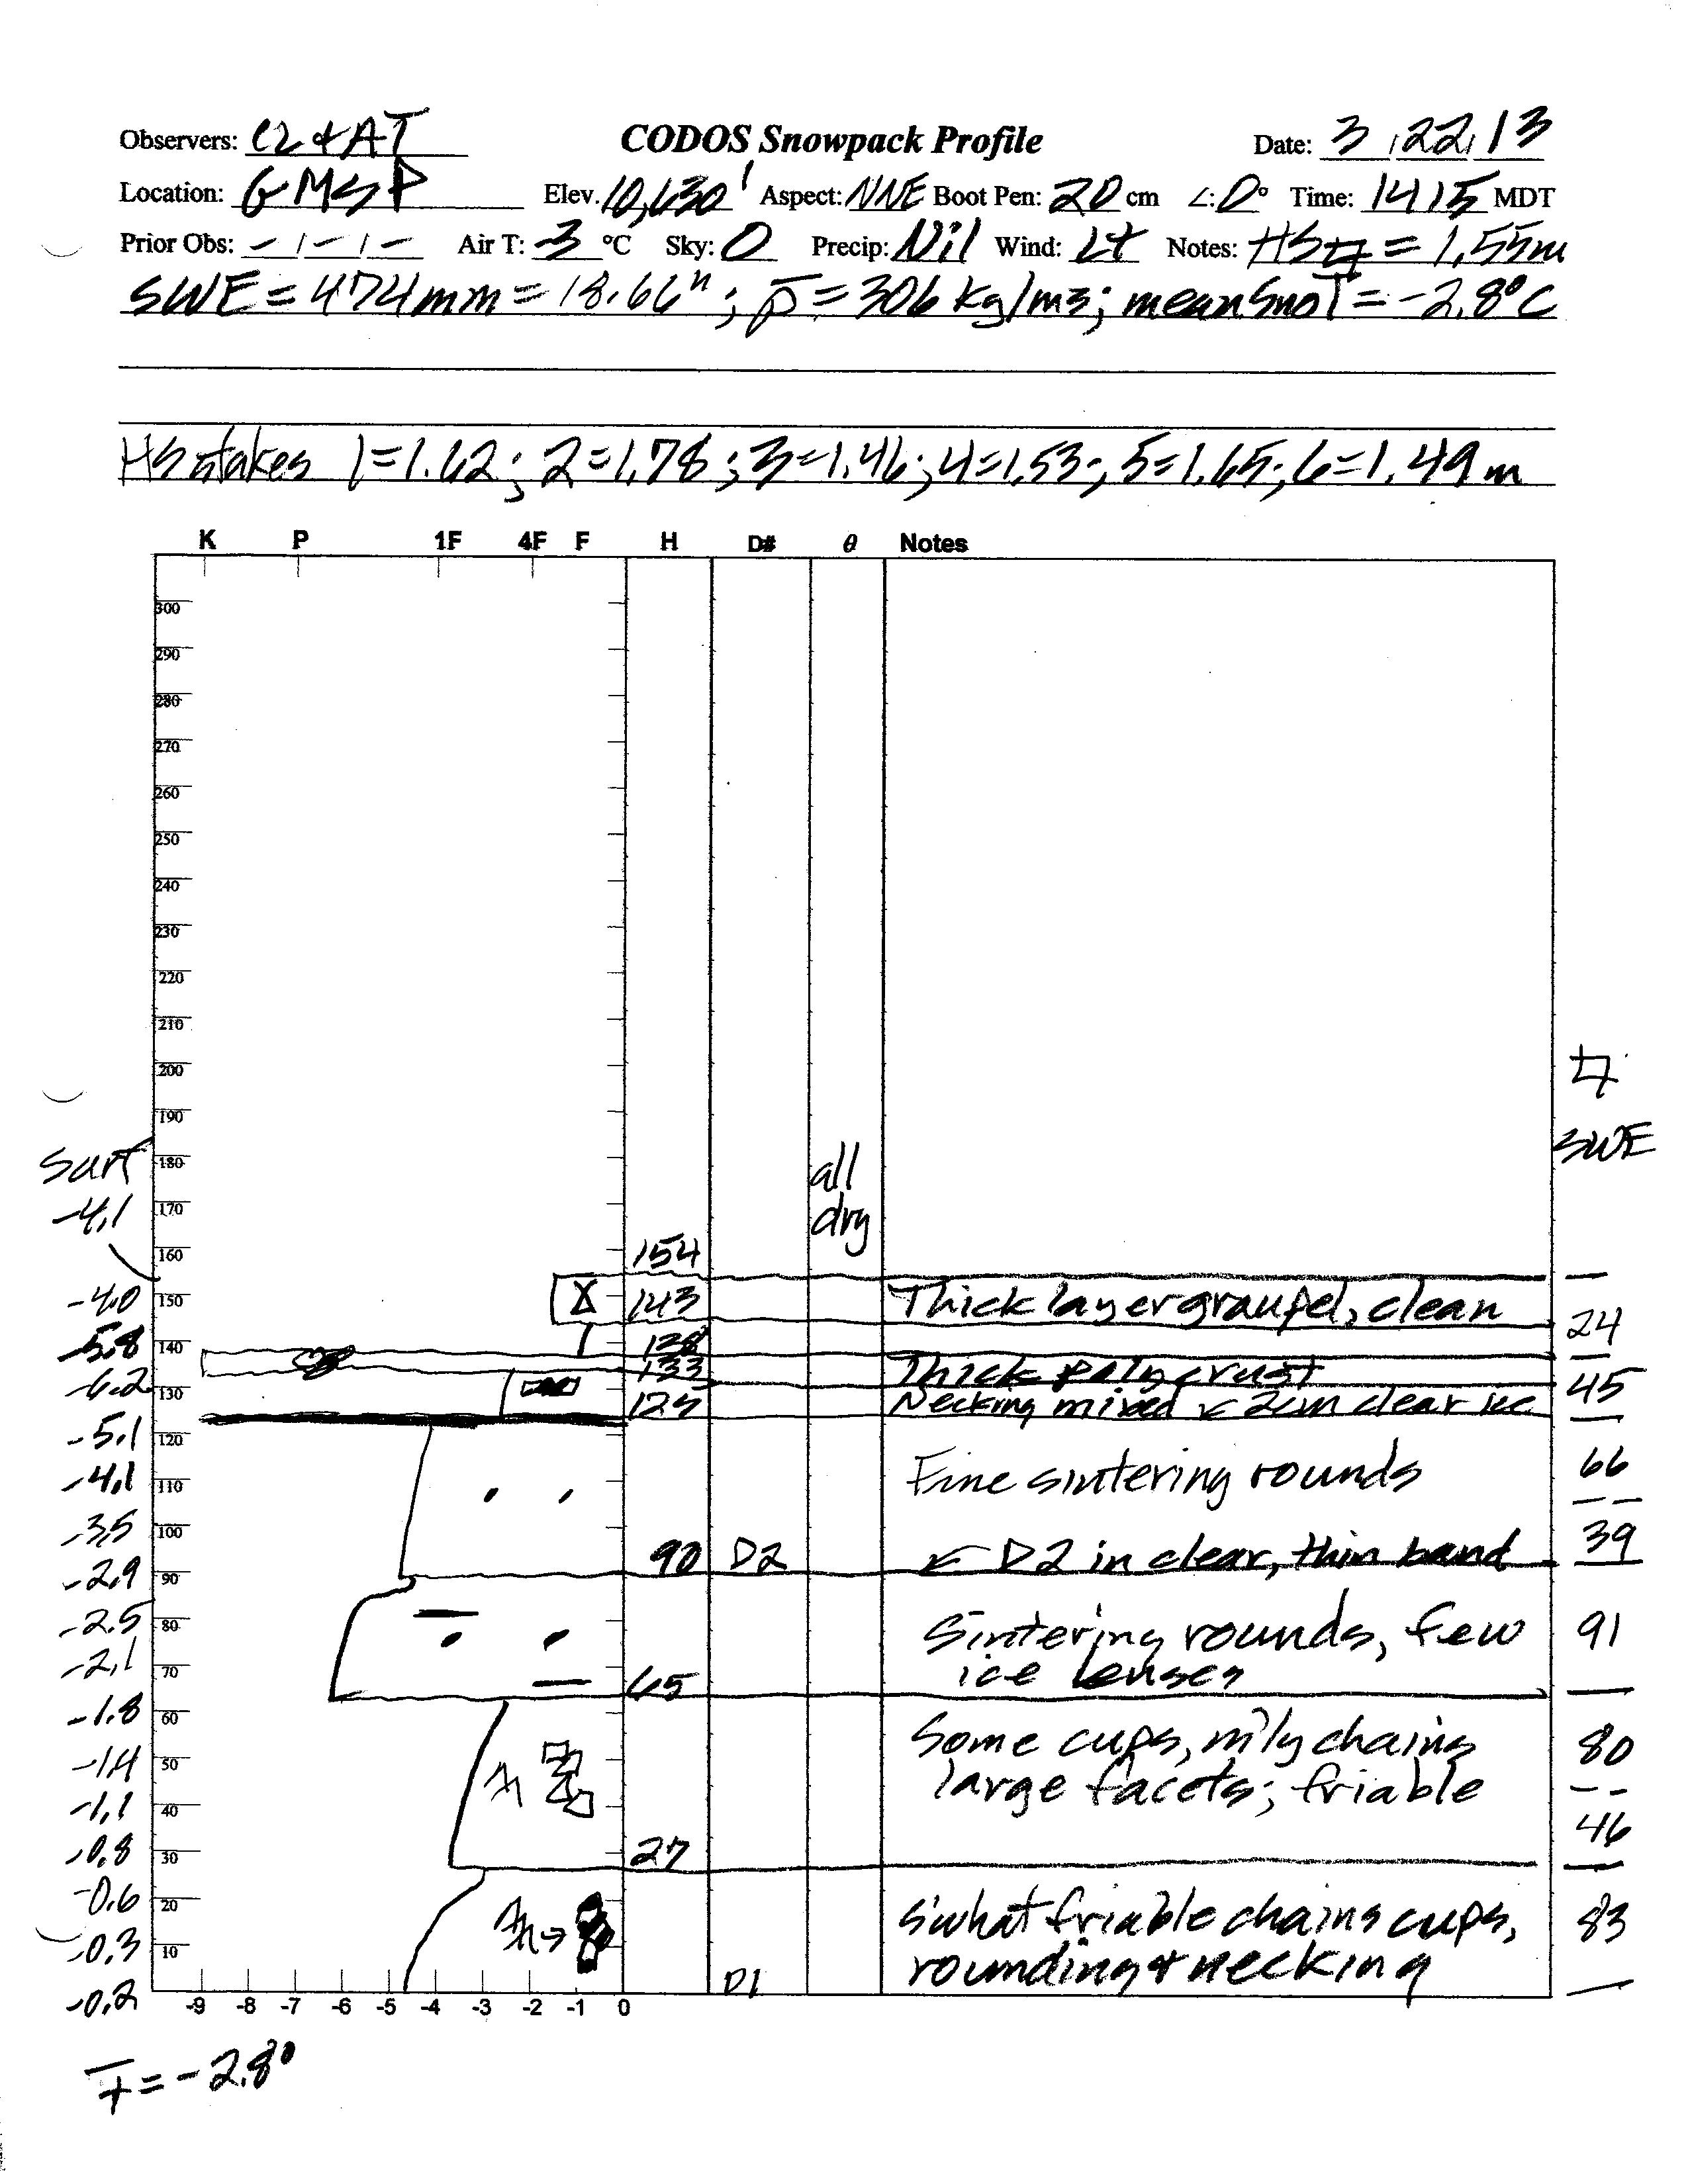

The March 22, 2013 snow profile at the Grand Mesa CODOS site. Only dust layer D2 was present.
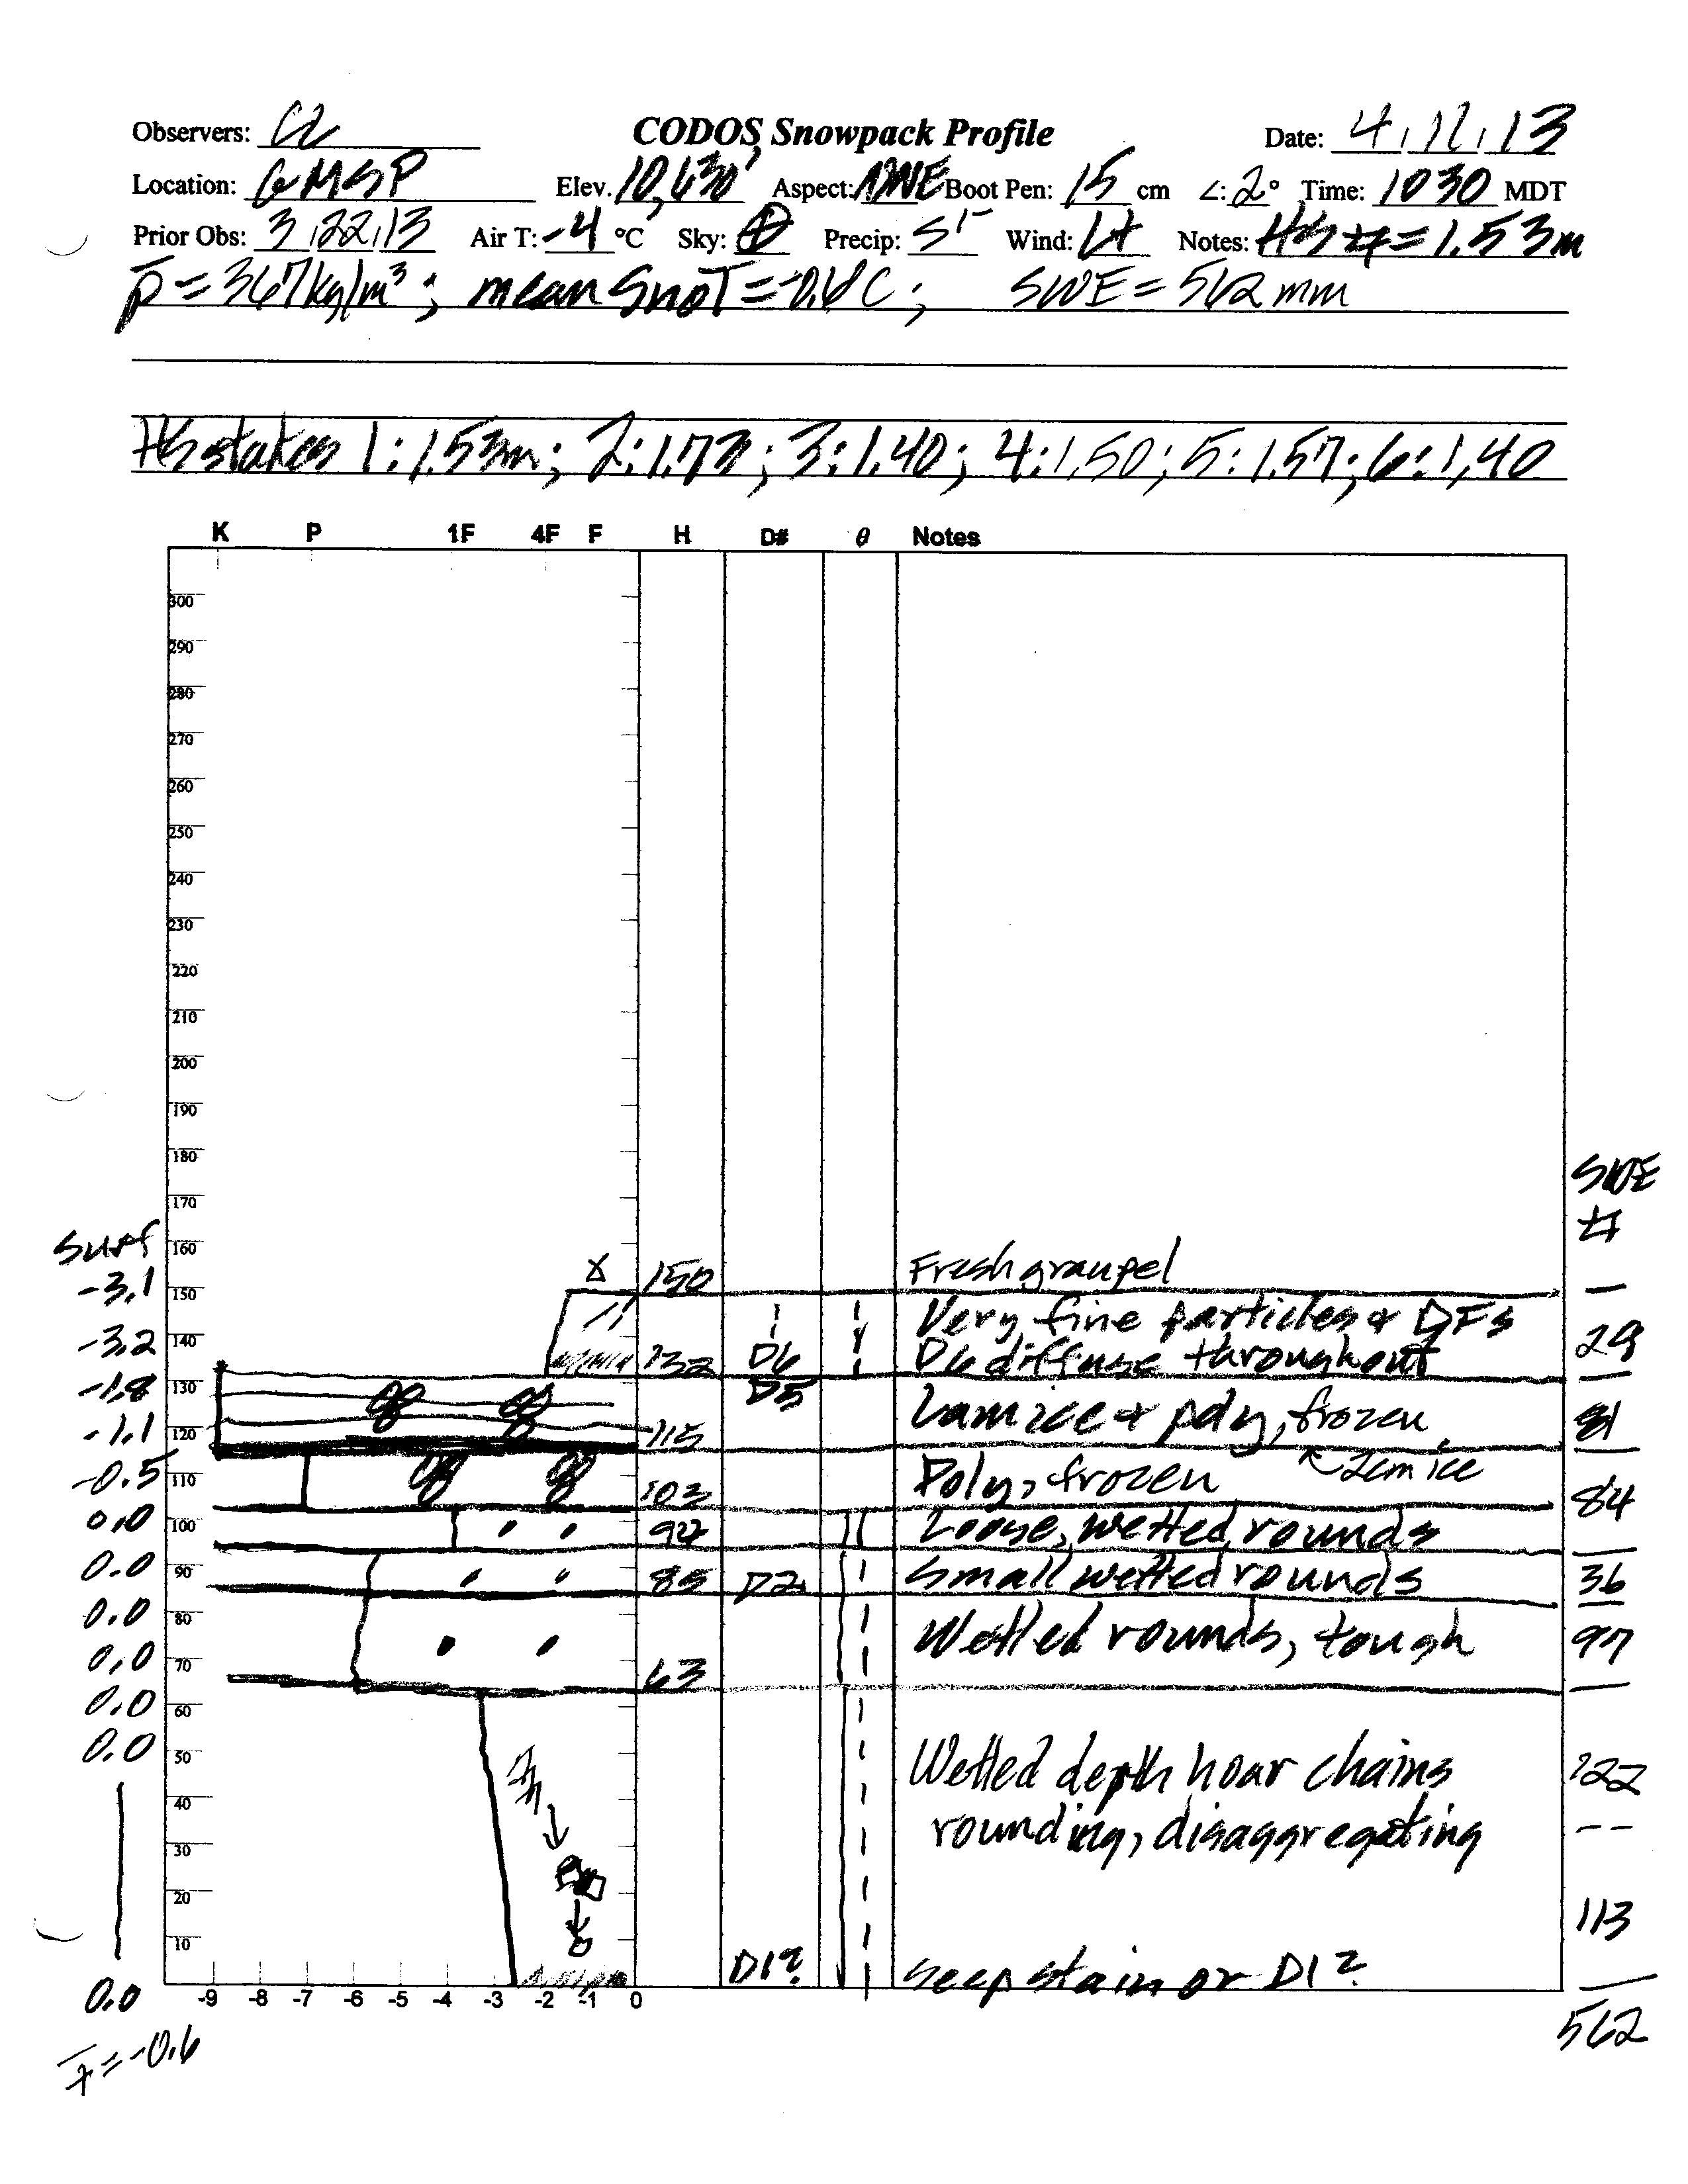

On April 12 dust layer D6 was strongly present, buried 8” below the surface. Clear evidence of a surface melt episode was observed in the
snow
immediately below D6 and snow temperatures had warmed from a mean of -2.8° C on March 23 to a mean of -0.15° C, effectively isothermal.
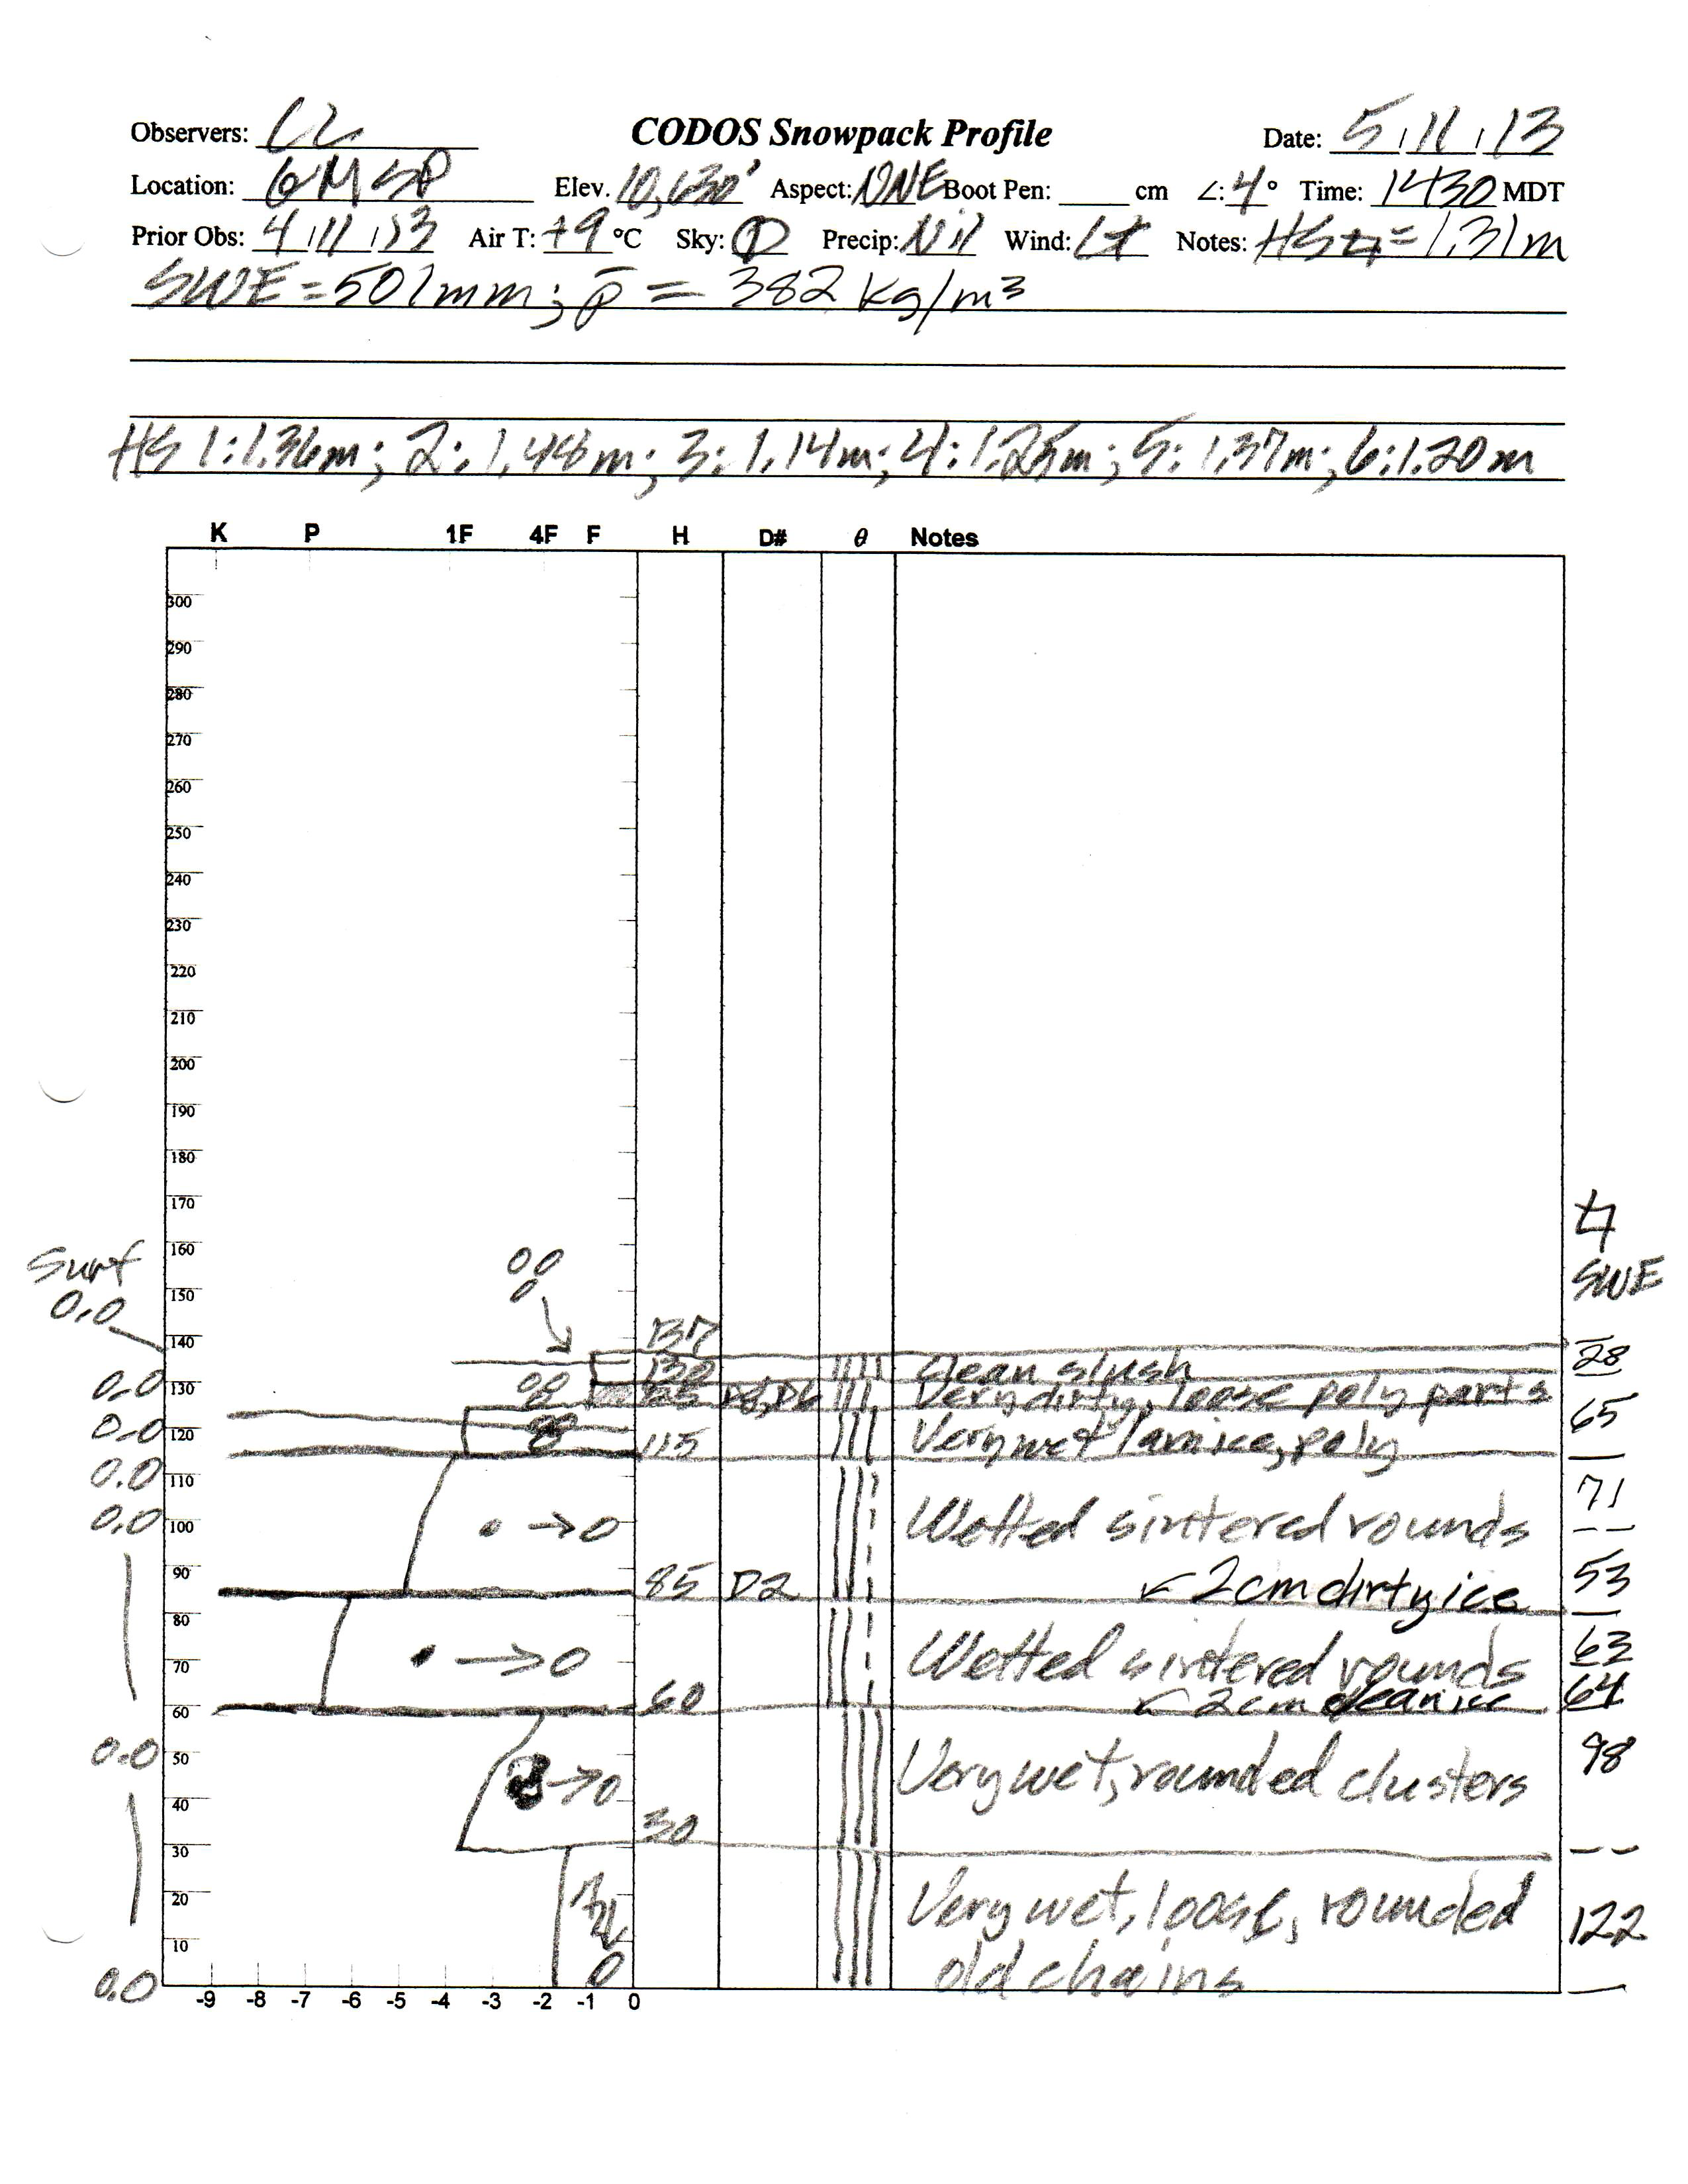

Snowpack ablation and snowmelt runoff was well advanced by May 11, with dust layers D8D6 merged and just below a
layer of recent clean snow, rapidly melting. The entire snowpack was classified as “very wet”, with slush at the surface.
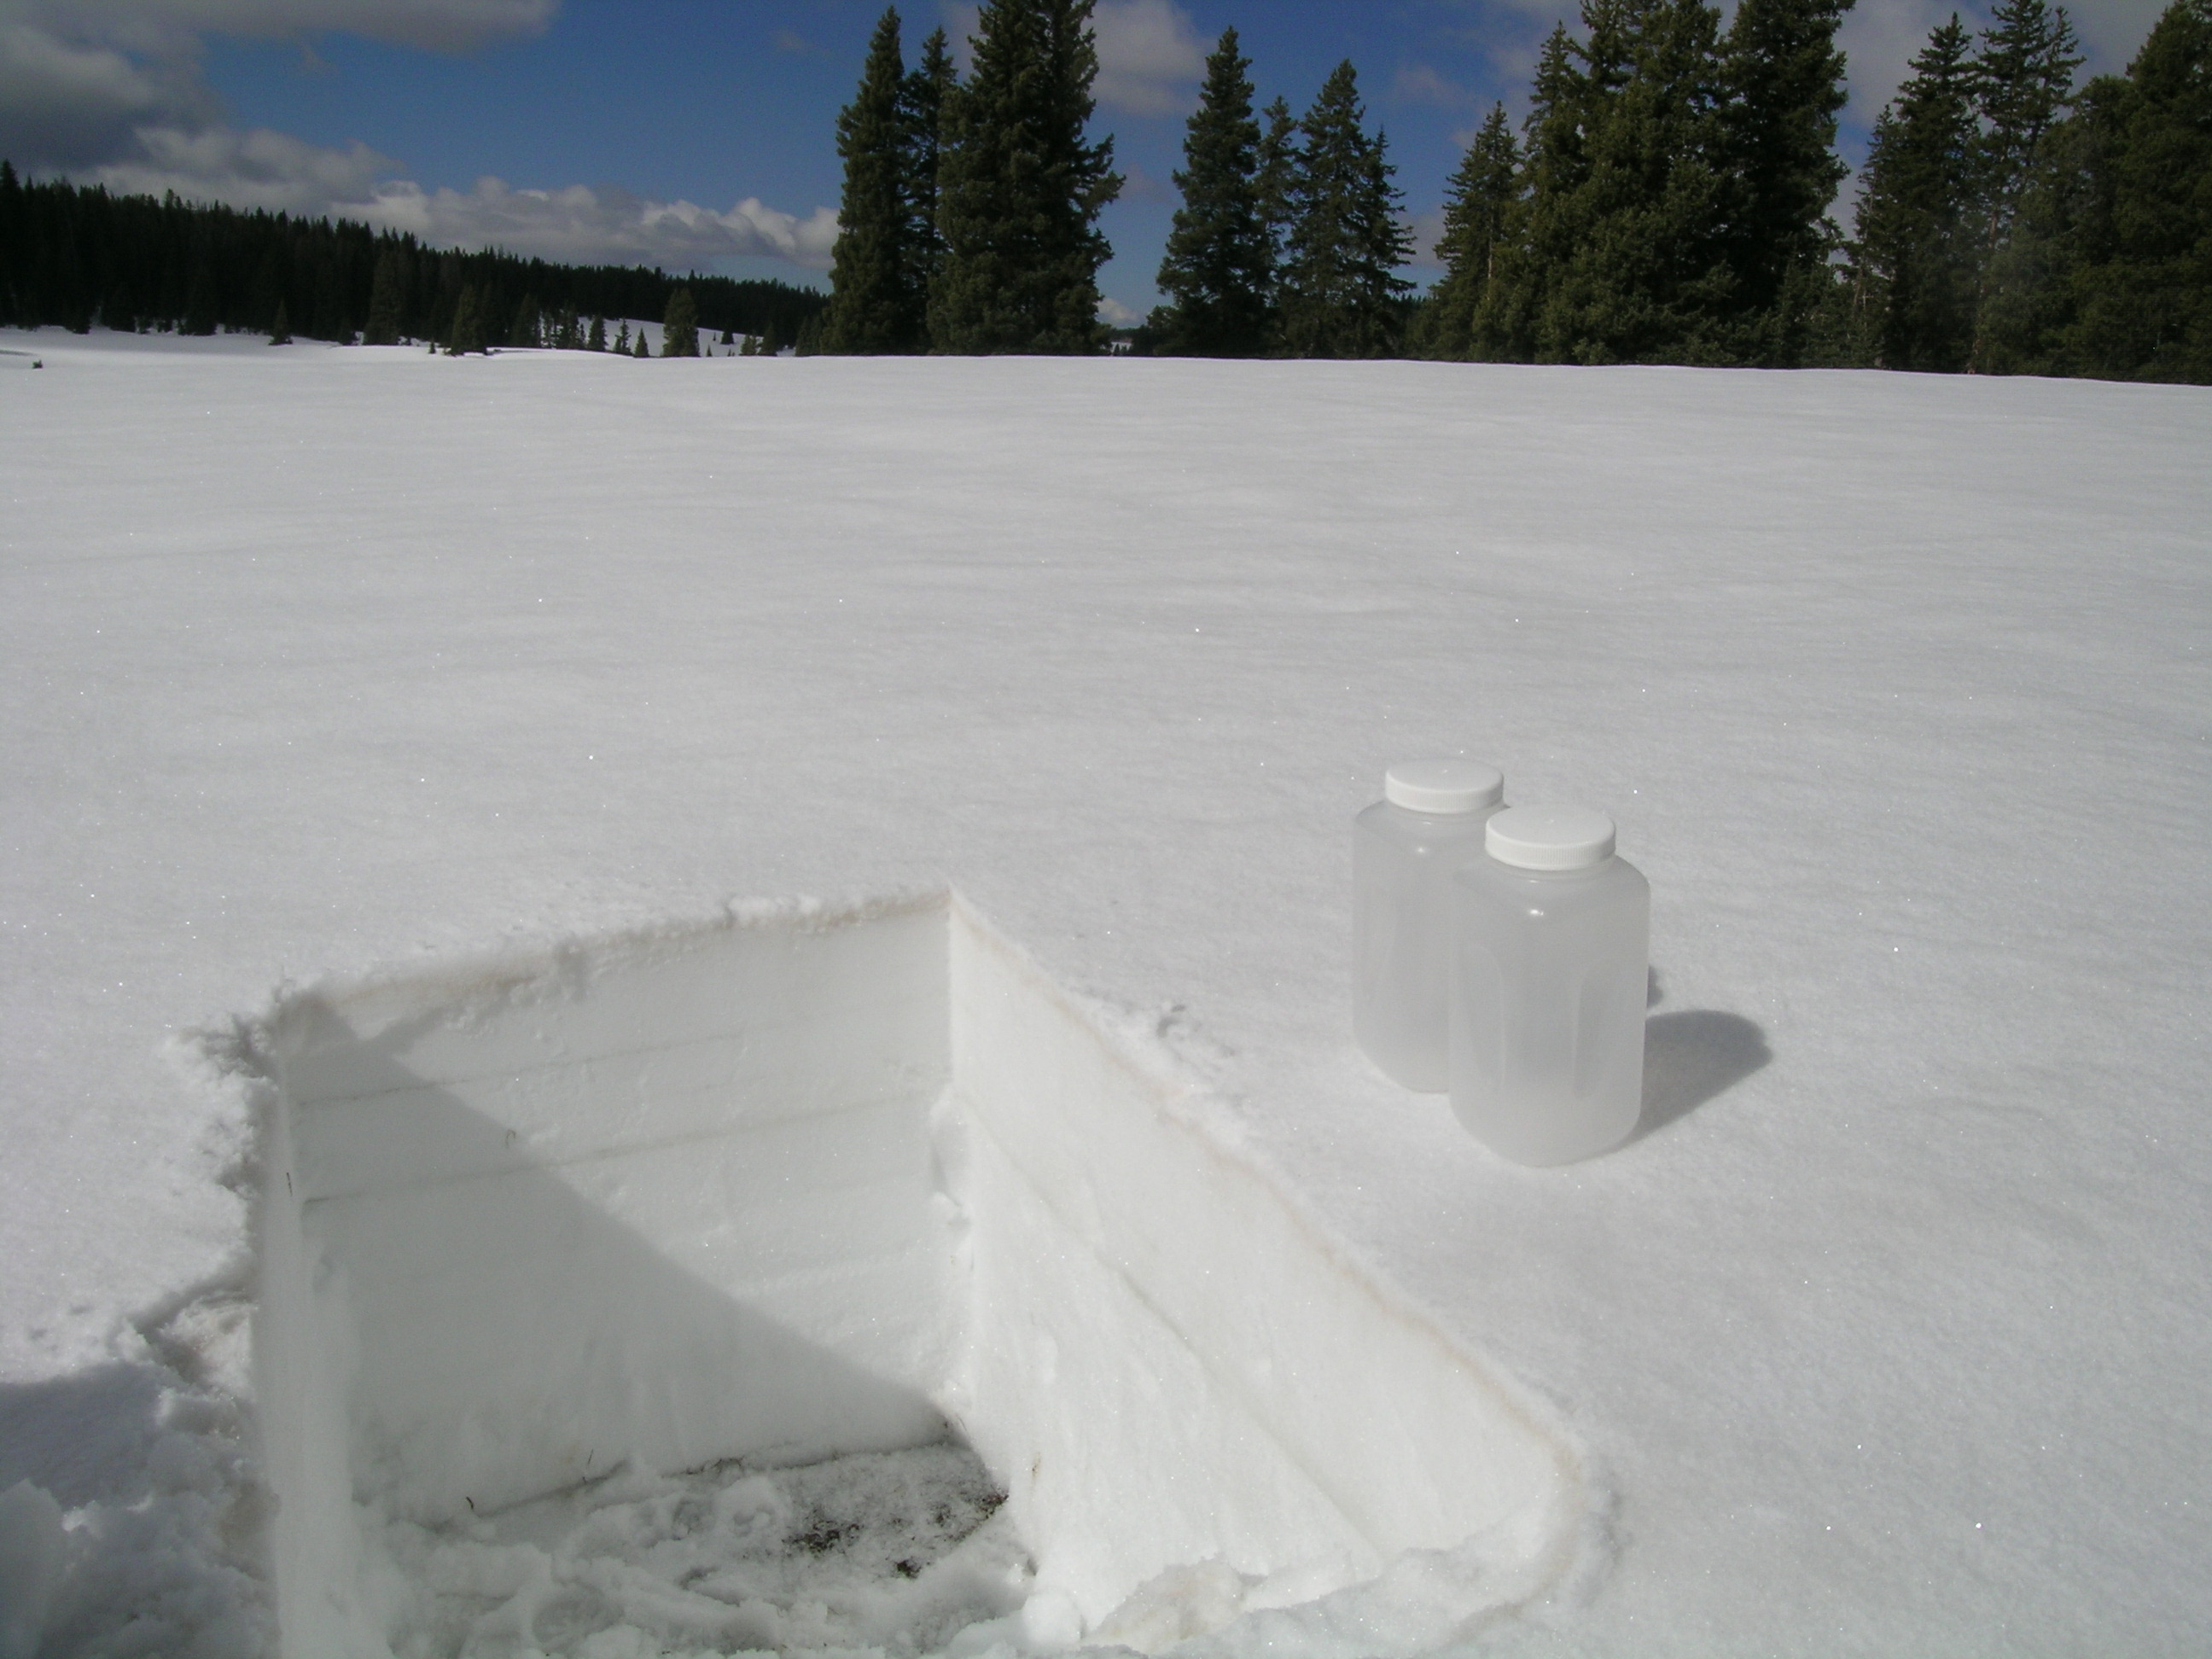
A concentrated sample of merged layers D8-D5 dust was collected May 21 on Grand Mesa near the CODOS site, at a south-facing site where recent fresh snow had been largely ablated. This sample
is undergoing chemical and other analyses by USGS.
Melt Rate
As was the case at Senator Beck Basin, layers D8 and D6 were the dominant dust-in-snow features on the Grand Mesa. Even though those heavy dust layers were deposited high in the snow column, and were quick to emerge following peak SWE, periods of unsettled weather and frequent spring snowfalls in the Grand Mesa locale often reduced the maximum potential radiative forcing effects. Once merged, the D8/D6 layer experienced brief periods of sustained exposure under clear, sunny skies. Still, frequent cloud cover often did reduced solar insolation onto the exposed D8/D6 layer and/or minor amounts of fresh snow temporarily restored a higher albedo to the remaining snowpack and incrementally slowed melt rates on Grand Mesa, prolonging the snowmelt cycle.
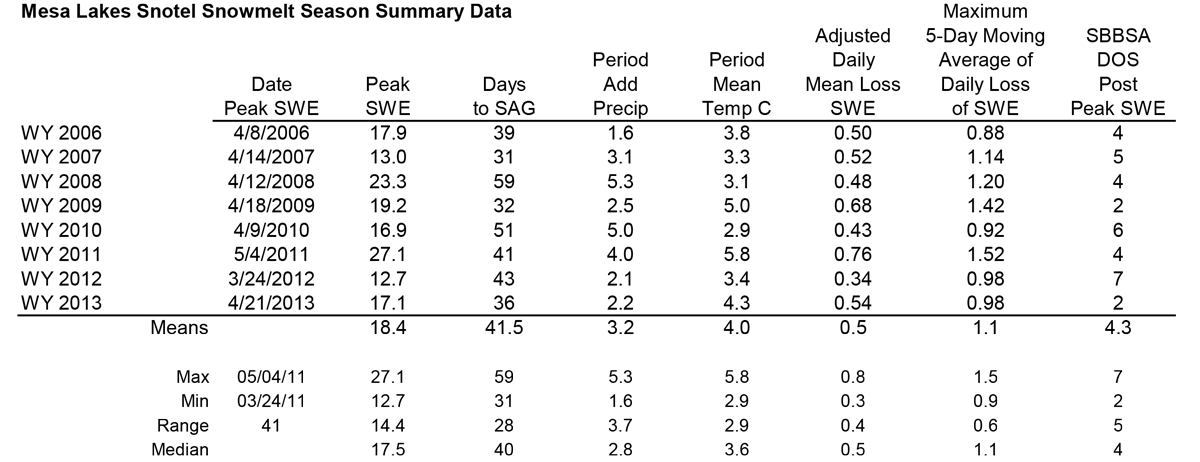
Analysis of the nearby Mesa Lakes Snotel data for Water Years 2006-2013 snowmelt seasons showing date and quantity of peak SWE, days from peak SWE to “snow all gone” (SAG), total additional precipitation after the date of peak SWE, an “adjusted” mean daily rate of snowmelt adding the additional precipitation to the peak SWE total, the maximum five-day moving average of daily melt, and the mean air temperature over the entire snowmelt period, from peak SWE to SAG. The Mesa Lakes Snotel site is partially shaded by surrounding forest and lies 600’ lower in elevation than the Grand Mesa CODOS snowpit site.
Following peak SWE at the Mesa Lakes Snotel of 17.1” on April 21, 2013, an additional 2.2” of SWE was added to the snowpack during the ablation cycle for an adjusted total of 19.3” of SWE available to melt. Aided by the intensity of radiative forcing produced by merged dust layers D8 and D6, and under slightly warmer mean air temperatures than in spring 2012, snowpack ablation to SAG took just 36 days. Spring 2013 melt rates were as high as 1.6” SWE loss per day and the mean daily SWE loss over the entire snowmelt period was 0.54” per day, versus 0.34” per day the year before. However, because of the interruptions in radiative forcing described above, the maximum 5-day moving average daily melt rate was identical in WY 2013 to that rate in WY 2012, at 0.98” per day. SAG occurred five days later than the median April 16 date of SAG at Mesa Lakes. In spring 2012, a lighter dust year, an adjusted total of 14.8” of SWE available for melt was ablated to SAG in 43 days at a mean rate of 0.34” of SWE loss per day.
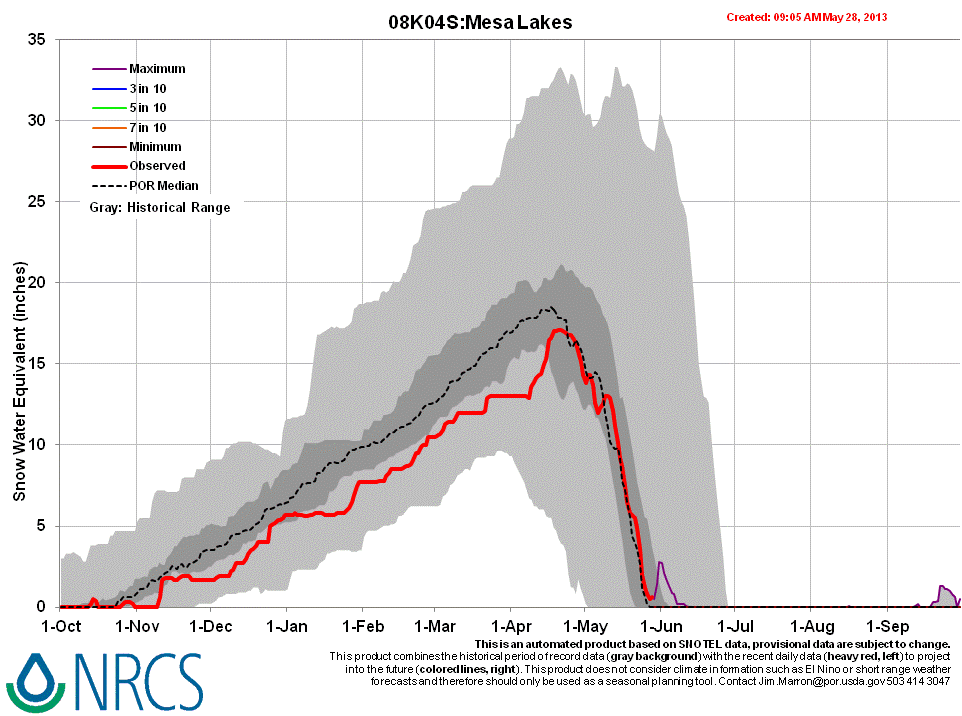
WY 2013 SWE accumulation and ablation at the Mesa Lakes Snotel station, with upper and lower quartiles of period of record shown in light grey, middle quartiles in dark grey, and the median trace for the period of record shown as a dashed line.
Stream Flows
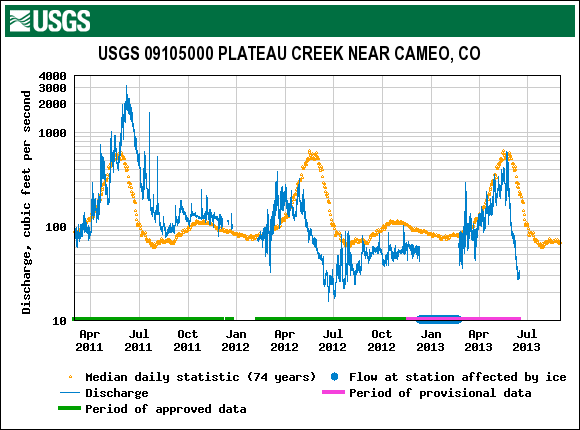
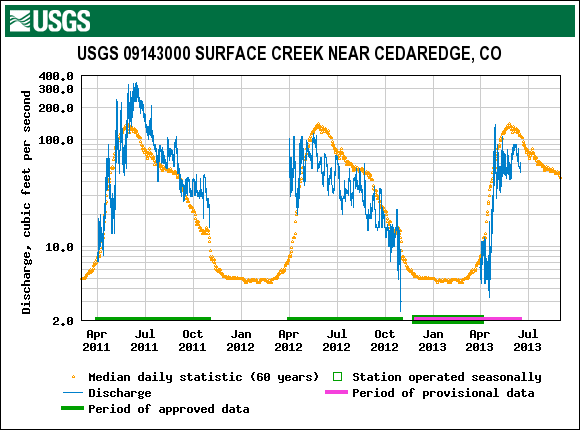
Even with the many diversions influencing both streams, comparisons of WY 2011, 2012 and 2013 (in progress) hydrographs for the Plateau Creek Near Cameo and the Surface Creek Near Cedaredge gauges may nonetheless highlight variations in Grand Mesa snowmelt runoff timing and volumes over those three seasons. WY 2011 runoff was delayed by relentless late spring storms. In April and May flows surge resulted in above-average runoff volumes.
WY 2012 snowmelt runoff began earlier than the median ascending limb (and before the Surface Creek gauge came on line). Both streams peaked at below-average levels and then rapidly declined to levels far below median late runoff levels.
This season, the ascending limb of snowmelt runoff was slightly later than the median behavior at both gauges, delayed by the unsettled weather of April and early May. Both gauges recorded a brief peak discharge near median peak, near the median date on Plateau Creek but well ahead of the median date on the Surface Creek gauge. The descending limb on Plateau Creek is particularly steep, perhaps partially the result of upstream storage and diversion, but both it and Surface Creek may produce final WY 2013 hydrographs showing somewhat higher total snowmelt yields than in WY 2012.