 Water Year 2012 CODOS Summary for
Hoosier Pass
Summary | Snowpack | Melt Rate | Stream Flows
Summary
Water Years 2011 and 2012 are a case study in interannual variability of Colorado snowpack formation and ablation driven by vastly different late winter and spring weather conditions, perhaps representing seasonal extremes. In dramatic contrast with the unrelenting storms of Mar/Apr/May 2011, extremely dry late-winter and spring weather in 2012 resulted in low values of peak SWE, very early in the spring.
On the other hand, the past two seasons produced comparatively smaller differences in dust-on-snow conditions, with WY 2012 coming close to matching WY 2011 at the Senator Beck Basin Study Area, our baseline monitoring site. Locally, however, WY 2012 desert dust concentrations at Hoosier Pass were substantially lower than those observed at Senator Beck Basin. Further, very large areas of bare ground exposed for most of late winter and spring in Front Range mountains, including the Hoosier Pass locale, may have enabled larger amounts of local dust and vegetation debris to mix with desert dust than has occurred in prior seasons. In any event, whether because of desert or local dust, or both, spring 2012 snowpack warming was enhanced by minor reductions in snow albedo and the Hoosier Pass CODOS site snowpack was isothermal by early April, then virtually gone by May 2nd. Streamflow data reflected this advance in snowmelt timing. Flowing north from the Pass, streamflow data from the USGS Blue River near Dillon gauge show an early and substantially reduced snowmelt runoff with rapidly declining flows in June. Southern aspects of the Mosquito Range and other terrain supplying the South Platte River were especially dry, during our CODOS campaigns, and flows measured on Tarryall Creek near Como, into South Park, were also early and extremely low.
Snowpack & Dust Discussion
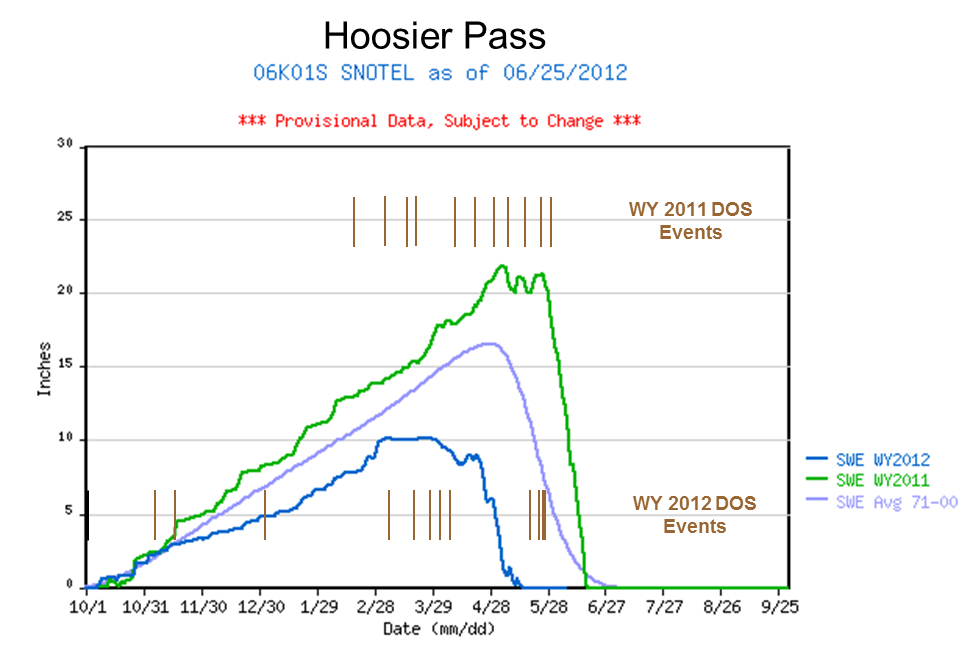
SWE accumulation and ablation for Water Years 2011 and 2012, with dust-on-snow events shown, by date, as brown bars for both water years (as observed at the Senator Beck Basin Study Area).
Water Year 2012 snowpack formation at Hoosier Pass began well but steadily fell well behind average accumulations into the lower quartile of SWE values for the period of record (see projection plot below). After stalling near 10” in early March, peak SWE occurred on March 28th at just 10.2”, well short of the 1971-2000 average of 16.5” and a full month earlier than the April 28th average date of peak SWE. (Peak SWE in 2011 was more than double this amount, at 21.9” and occurred on May 5th.)
During WY 2011 eleven dust events occurred at Senator Beck Basin containing a total of 14 grams of dust per square meter. Most of those major dust layers were found in CODOS snow profiles at the Hoosier Pass CODOS site. However, relentless accumulation of late winter and spring snow routinely buried new dust layers and restored high snow albedo values throughout the State, throughout April and May.
Last season, during WY 2012, a similar twelve dust events occurred at Senator Beck Basin containing a total of ~10-12 grams of dust per square meter (see Senator Beck Basin Summary – Dust Log discussion). But, in a dramatic switch, late winter and spring 2012 were exceptionally dry, with widely spaced and comparatively small winter storms (see Senator Beck Basin – Winter Storm Log Discussion) leaving dust exposed at the snowpack surface for extended periods, beginning in early March. However, spring 2012 dust layers and reductions in snow albedo observed in the Hoosier Pass locale were substantially less intense than those observed in the Senator Beck Basin Study Area last spring.
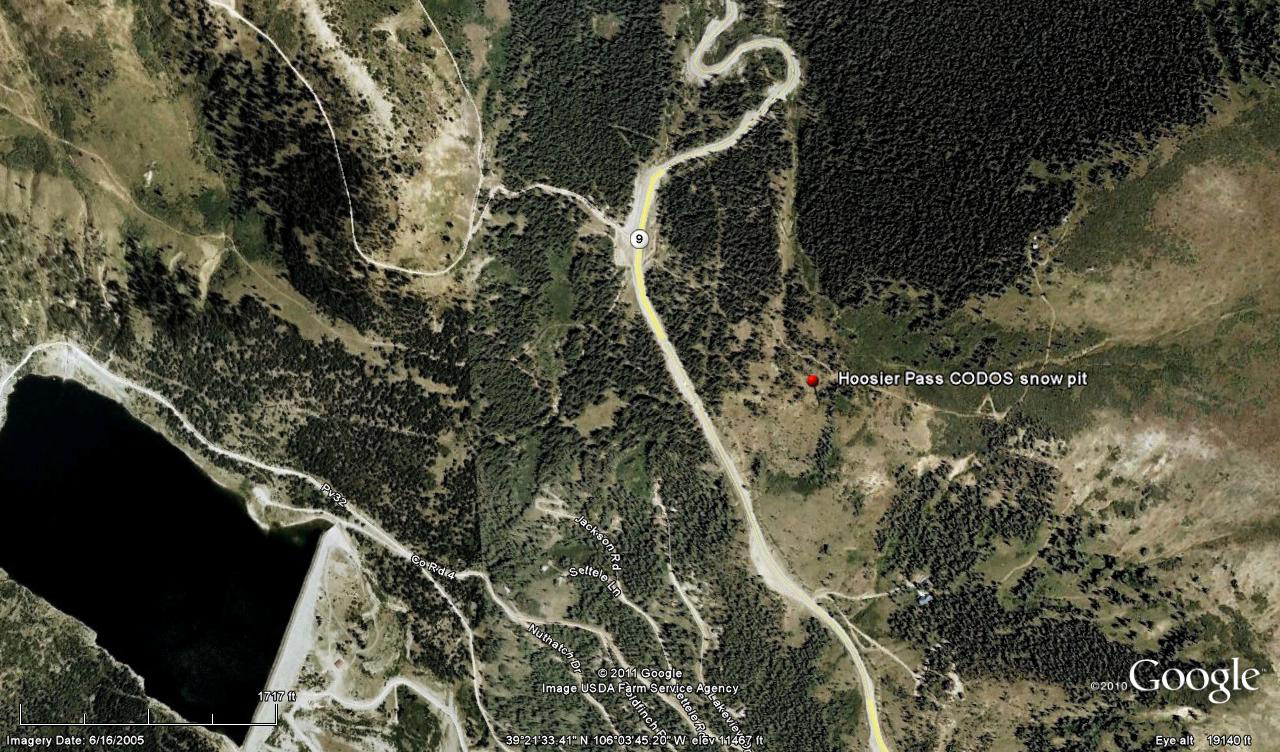
In our March 14th snow profile at our Hoosier Pass CODOS site, we found event D4 dust weakly present at the surface of the 105 cm (41”) snowpack, with only a thin melt/freeze crust at the snowpack surface. The snowpack retained significant cold content on this date, with a mean snowpack temperature of -3.7° C. By April 9th, our next snow profile at Hoosier Pass found the 81 cm (32”) snowpack isothermal at 0° C and with wet snow throughout. (see April 9 Update). And, for our final CODOS site visit on May 2nd we hiked the west-facing slope from Hwy 9 to our CODOS site on dry ground. Several days later in the preceding season, on May 16th, 2011 the snowpack at the Hoosier Pass CODOS site was still 182 cm (72”) deep.

CSAS’s Chris Landry returning to Hwy 20 on a gentle, snow-free, west-facing slope after completing the May 2nd, 2012 snowpit at the more level Hoosier Pass CODOS site, just before SAG. Mount Lincoln and Mount Bross are seen in the distance, notably snow-free.
Melt Rate
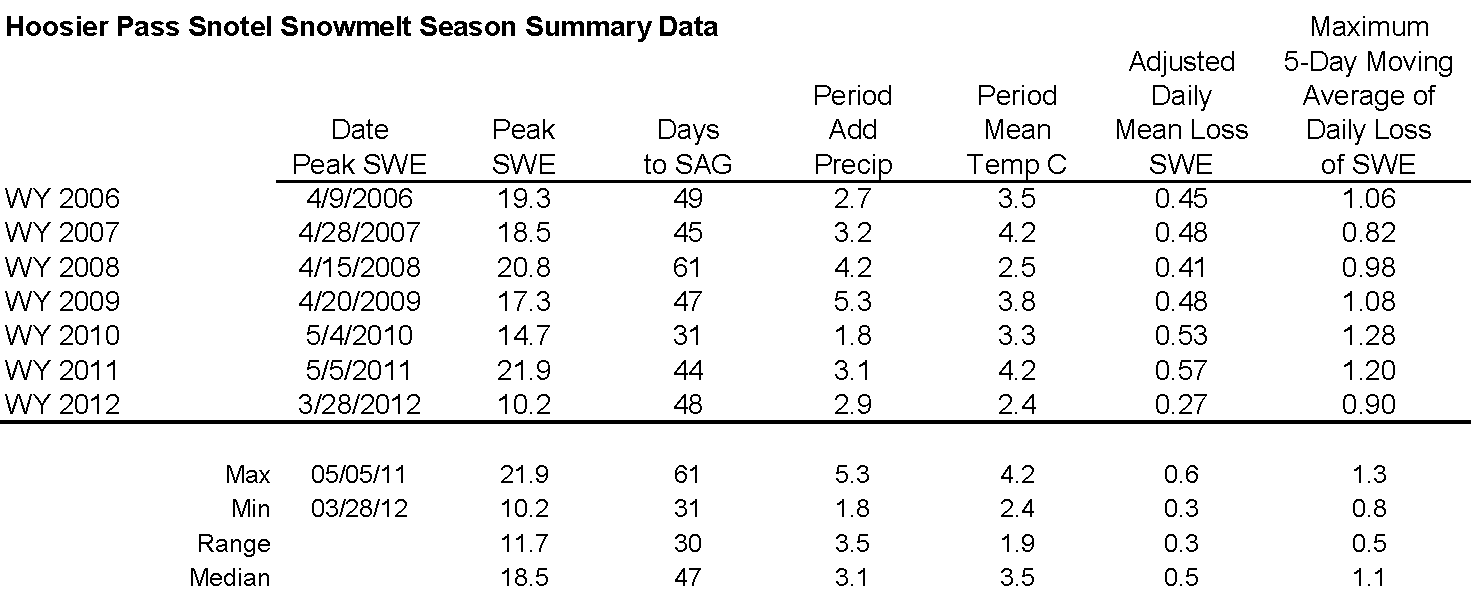
Analysis of Hoosier Pass Snotel data for 2006-2012 snowmelt seasons showing date and quantity of peak SWE, days from peak SWE to “snow all gone” (SAG), total additional precipitation after date of peak SWE, an “adjusted” mean daily rate of snowmelt adding the additional precipitation to the peak SWE total, the maximum five-day moving average of daily melt, and the mean air temperature over the entire snowmelt period, from peak SWE to SAG.
This discussion references CODOS Snotel site data and analyzes rates of snowmelt from Spring 2006 to the present, spanning the period during which we’ve rigorously observed dust-on-snow at our Senator Beck Basin Study Area, at Red Mountain Pass. Since the Snotel network is the only spatially extensive system continuously monitoring snowmelt throughout the Colorado mountains, year-to-year comparisons of Snotel melt rate data may yield insights into dust effects on local watershed-scale processes that our occasional CODOS snowpit measurements can’t reveal.
However, as we often note, many Snotel sites exhibit a radiative regime where surrounding trees reduce the access of incoming solar radiation to snowpack over the SWE measuring snow pillow, and where re-radiation of long wave energy from that vegetation and reduced skyview may inhibit radiant cooling and extend surface snowmelt during nighttime hours. The Hoosier Pass Snotel site exhibits these attributes and, as a consequence, does not experience the maximum effects of dust reductions in snow albedo, and short-wave radiative forcing, as compared to open meadow sites where solar access is unimpeded and snowmelt and snowpack ablation are measured (e.g., Swamp Angel Study Plot). This difference in dominant radiation regimes (long-wave in shady forests versus short-wave in sunny, open terrain) is routinely seen where snow-free open meadows immediately adjoin forest retaining substantial snowpack.
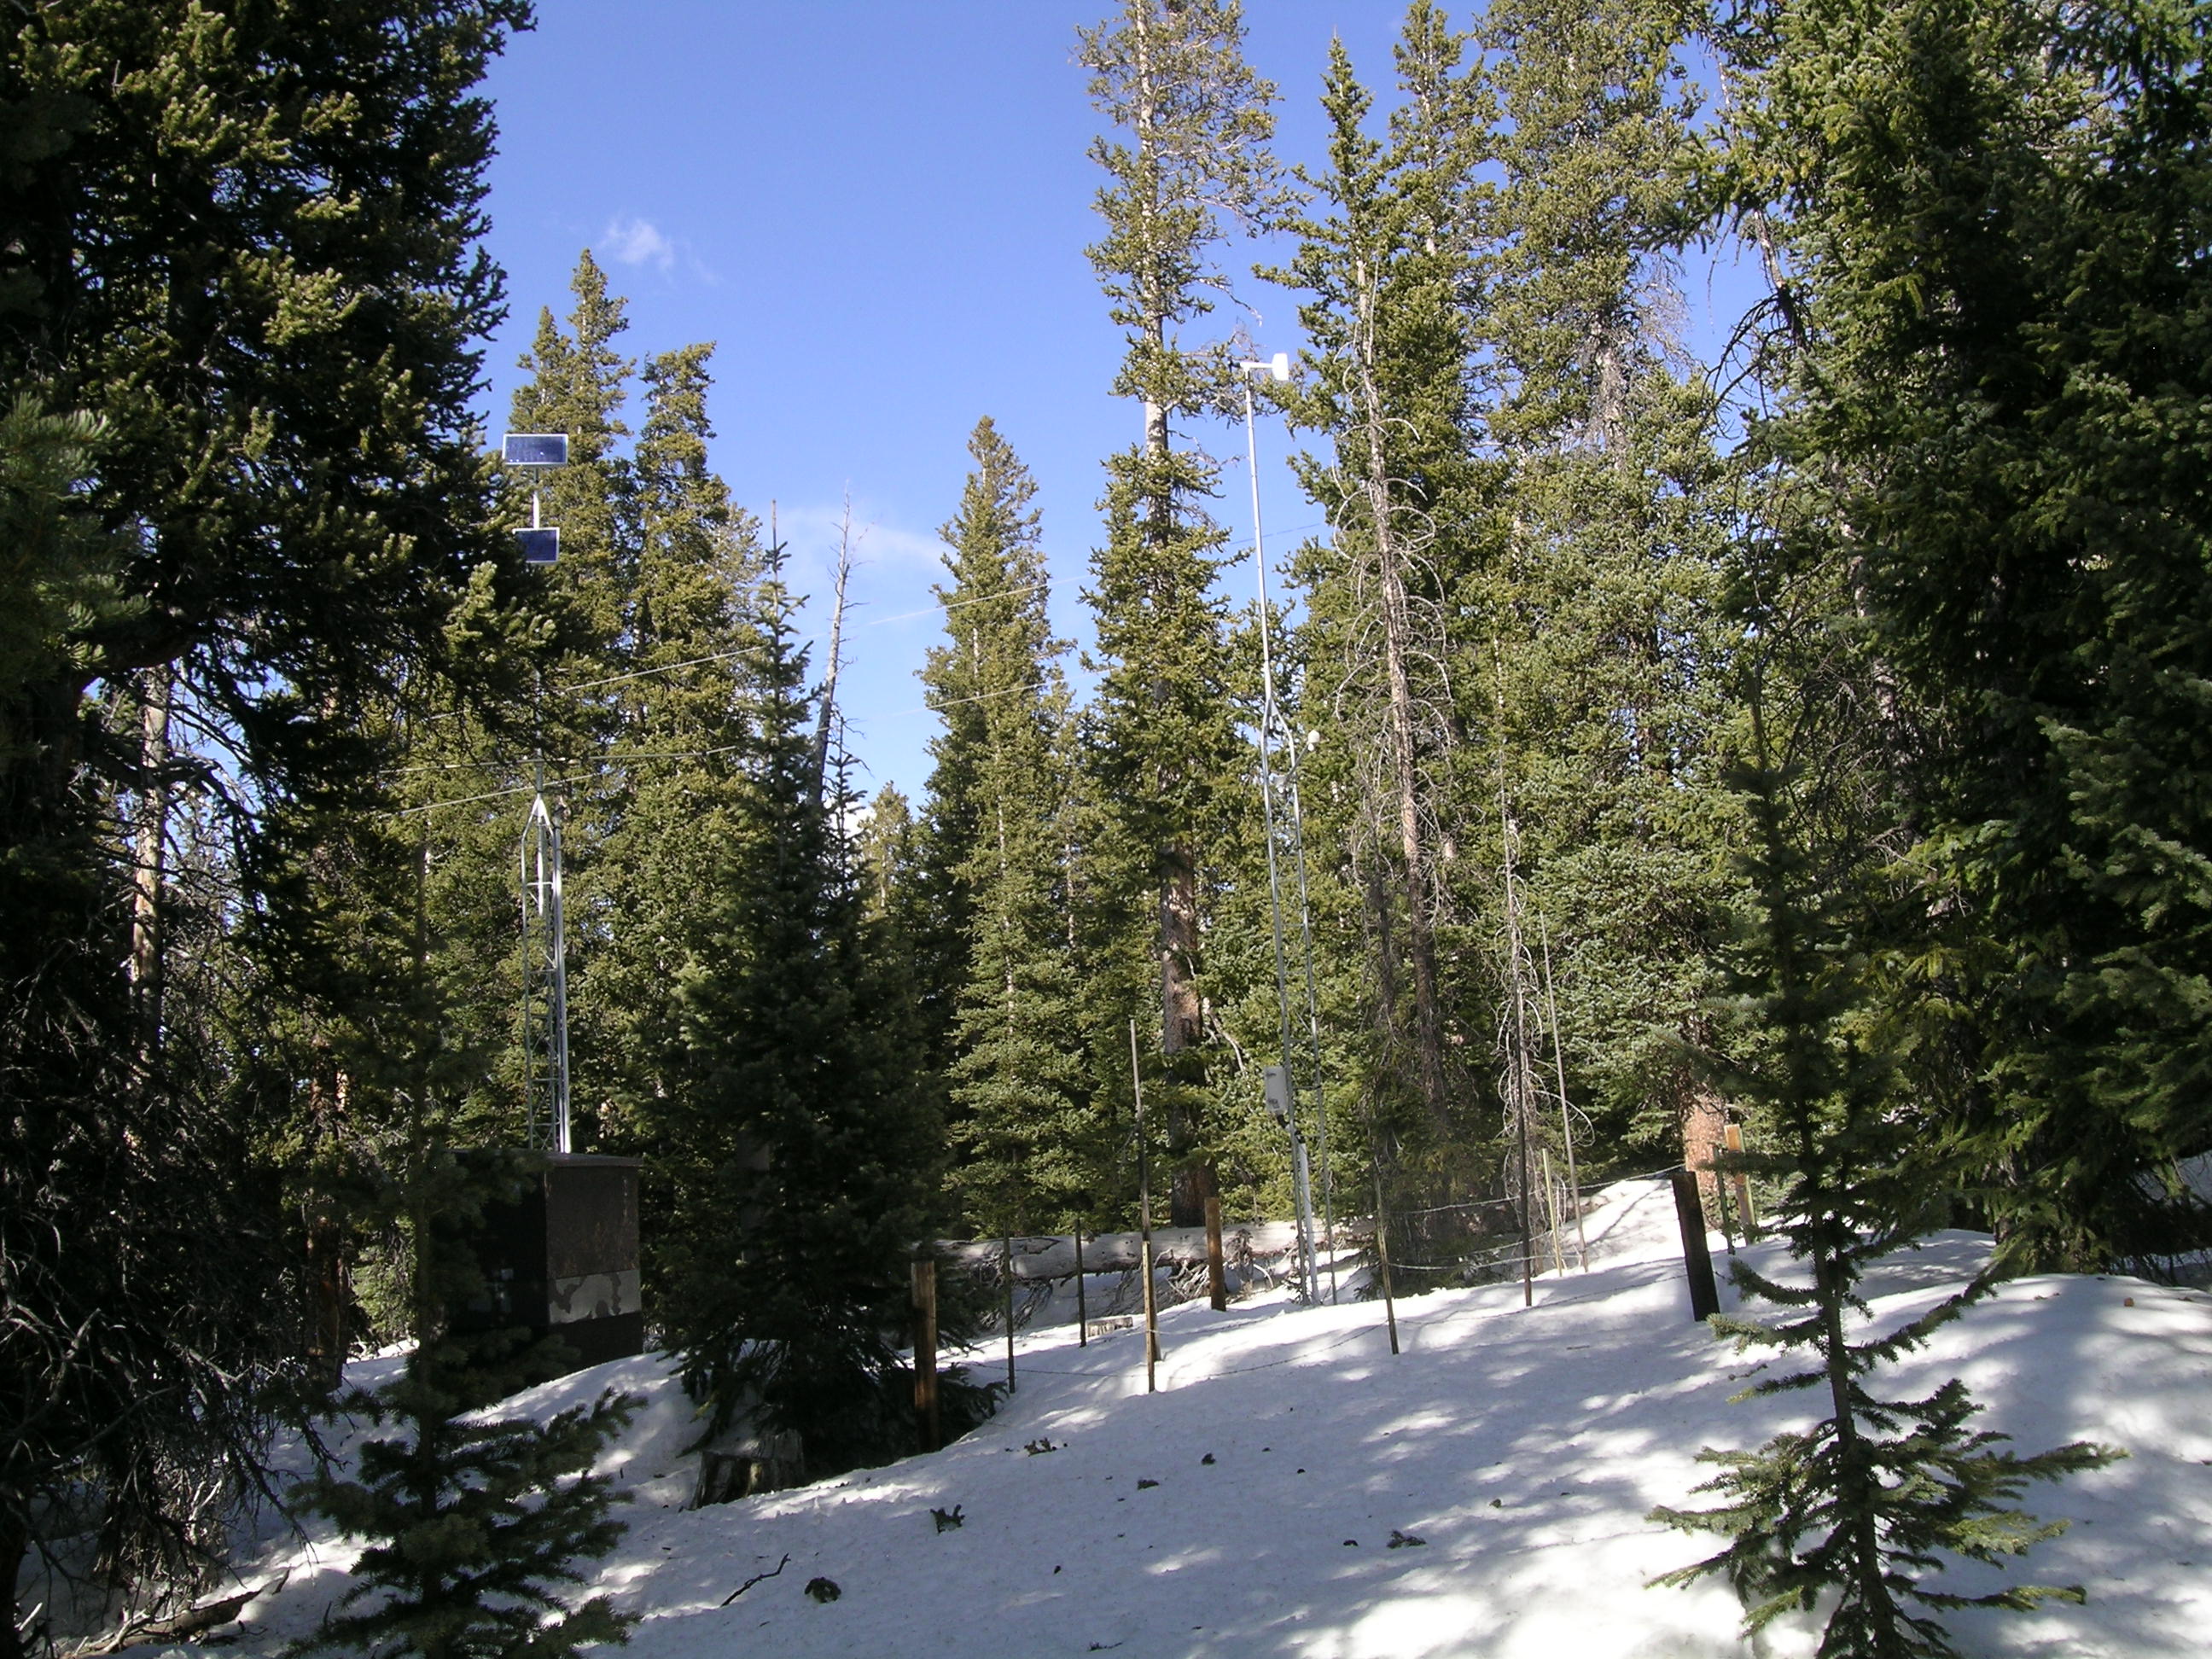
A view looking north of the Hoosier Pass Snotel site on April 9th, 2012, showing tree shadows over the snow pillow, inside the fencing.
During WY 2012, three fall and early winter dust storms were observed low in the snowpack at Senator Beck Basin, and one of these layers (likely D3) was discernible at Hoosier Pass in our CODOS snow profiles. And, although dust-on-snow events D9-D12 fell well after the date of SAG at our Hoosier Pass CODOS site in WY 2012, those later events further reduced snow albedo and enhanced snowmelt rates in the remaining snowpack at higher elevations and on shady subalpine aspects in the nearby terrain.
WY 2012 SWE accumulation and ablation at Hoosier Pass Snotel with upper and lower quartiles of period of record shown in light grey, middle quartiles in dark grey surrounding median trace for period of record, and mean trace for 1971-2000 period.
Because of the early date of WY 2012 peak SWE at Hoosier Pass Snotel, on March 28th, spring 2012 produced a two-step descending limb in the SWE plot rather than the single, steep plunge following the very delayed peak SWE in 2011. In 2012, snowpack ablation at Hoosier Pass Snotel gradually accelerated in early April until storms in mid-April produced a small rebound in SWE. Then, in late April, under the influence of unseasonably warm temperatures and modest reductions in snow albedo from dust, melt rates accelerated again, to a higher rate. Overall, the Hoosier Pass Snotel site required 48 days to ablate 13.1” of SWE (including 2.9” of precipitation after peak SWE), averaging just 0.27” of SWE loss per day.
Stream Flows
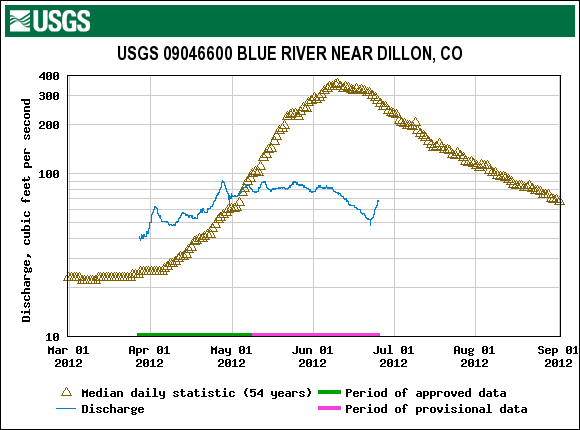
WY 2012 USGS Blue River near Dillon, CO stream gauge data for a 121 sq. mi. drainage area in the upper Blue River watershed, above 9,020’. Current year and historic data reflect transmountain diversions upstream by Boreas Pass ditch and Hoosier Pass tunnel.
Given the very dry spring and below-average snowpacks throughout the Front Range mountains, below average snowmelt runoff in those watersheds was unsurprising. Streamflow data reflecting snowmelt runoff behavior in the Hoosier Pass vicinity are limited. However, even with 0-2 cfs diversions at the Monte Cristo site and 1-4 cfs at the Bemrose-Hoosier site and unknown diversions to the Boreas Ditch throughout the spring, the Blue River near Dillon hydrograph shows evidence of an early start to runoff with substantially above-average flows in April and a peak in late April. May flows surged and matched the April peak, but then began declining. By mid-June flows had fallen below those expected two months later, in September. Tarryall Creek at Como data also suggest an early runoff peaking in mid-May rather than the normal mid-June date. More importantly, those data document extremely low flows throughout the snowmelt season, dropping below late-September levels in June.
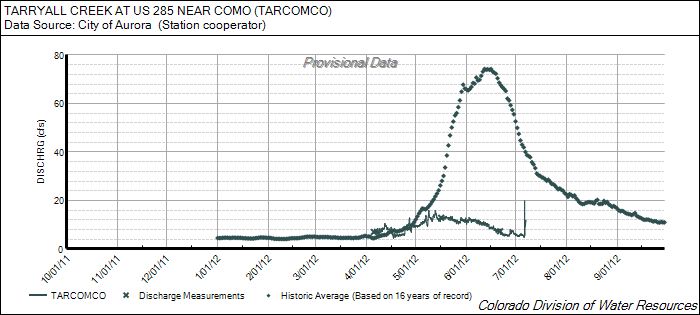
WY 2012 Tarryall Creek at US 285 near Como Stream Gauge data for a 24 sq. mi. drainage area, above 9,935’.
In addition to the very warm temperatures associated with prolonged periods of dry and sunny weather in late winter and spring 2012, even the comparatively weak dust-on-snow events D4 (March 6th) and D8 (April 6th) played a role in this early Hoosier Pass locale runoff, incrementally reducing albedo and hastening the ripening of the snowpack in late March, to isothermal, and then absorbing and adding additional solar energy to the snowmelt energy budget during subsequent periods of exposure at the snowpack surface. Additional dust events in late May further reduced snow albedo in the remaining snowpack, hastening the extreme drying of Front Range mountain systems.