 Water Year 2012 CODOS Summary for McClure Pass
Summary | Snowpack | Melt Rate | Stream Flows
Summary
Water Years 2011 and 2012 are a case study in interannual variability of Colorado snowpack formation and ablation driven by vastly different late winter and spring weather conditions, perhaps representing seasonal extremes. In dramatic contrast with the unrelenting storms of Mar/Apr/May 2011, extremely dry late-winter and spring weather in 2012 resulted in low values of peak SWE, very early in the spring.
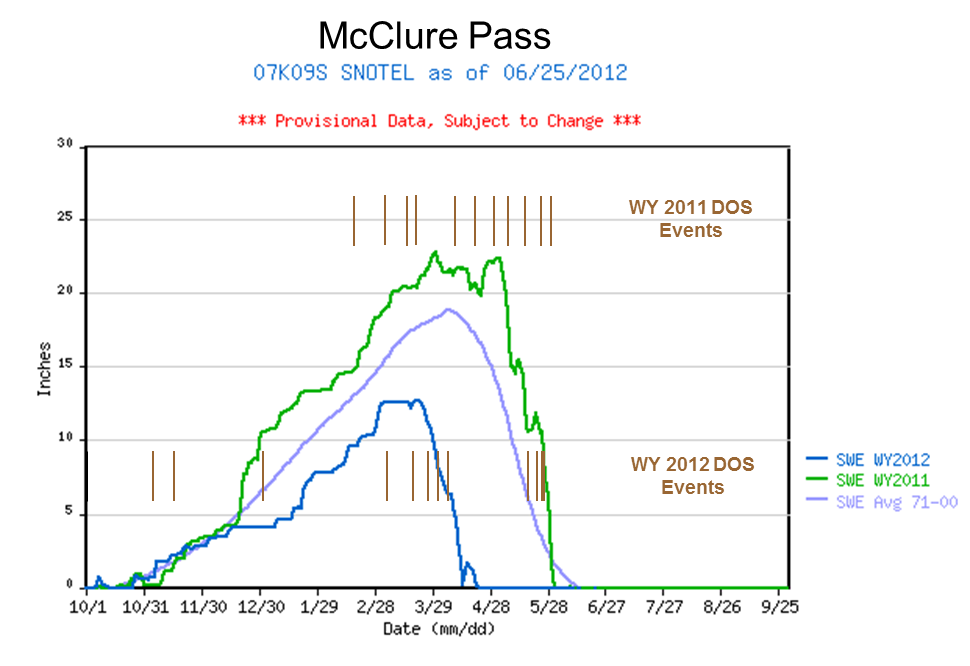
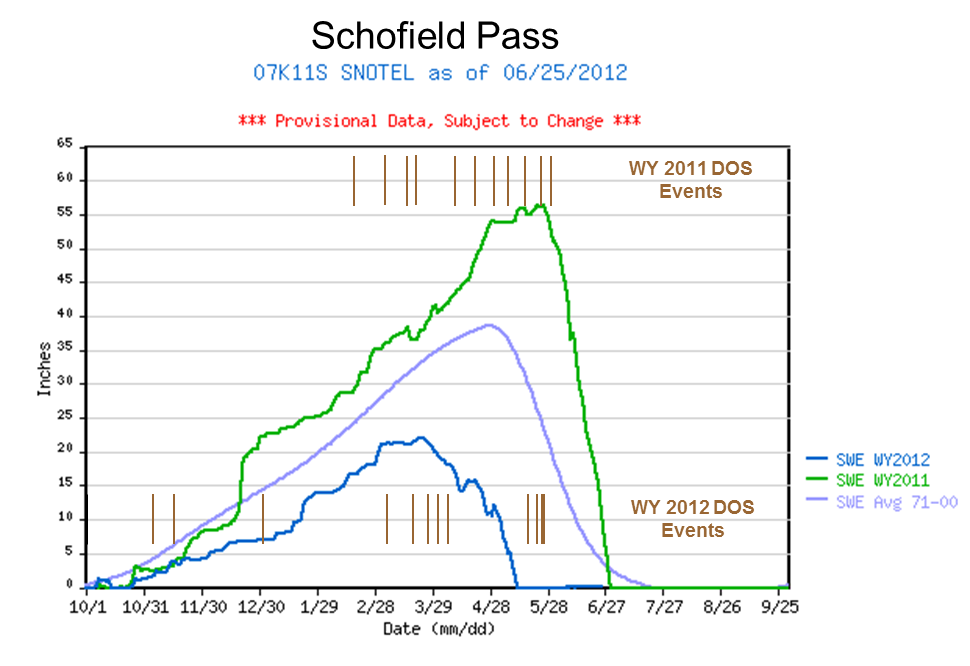
SWE accumulation and ablation at McClure Pass and nearby Schofield Pass for Water Years 2011 and 2012, with dust-on-snow events shown, by date, as brown bars for both water years (as observed at the Senator Beck Basin Study Area).
On the other hand, the past two seasons produced comparatively smaller differences in dust-on-snow conditions, with WY 2012 coming close to matching WY 2011 at the Senator Beck Basin Study Area, our baseline monitoring site. Locally, WY 2012 desert dust concentrations in the McClure Pass locale were generally as intense as those observed at Senator Beck Basin and, given the very dry winter, the McClure Pass CODOS site snowpack was among the first of our CODOS sites to reach “snow all gone” (SAG). Streamflow data from the nearby Muddy Creek stream gauge, and other nearby gauges, document a substantial advance in the entire snowmelt runoff cycle, and reduced total runoff.
SnowPack & DUST Discussion
Water Year 2012 snowpack formation at the McClure Pass Snotel site began with near-average snow accumulations until mid-December. Then, SWE values fell into the lower quartile of values in the McClure period of record, until peak SWE in late March (see Snotel projection plot below). Nearby, at the Schofield Pass Snotel, SWE values almost immediately fell into the lower quartile of values in that site’s period of record and also remained there until 2012 peak SWE, also in late March (see Snotel projection plot).
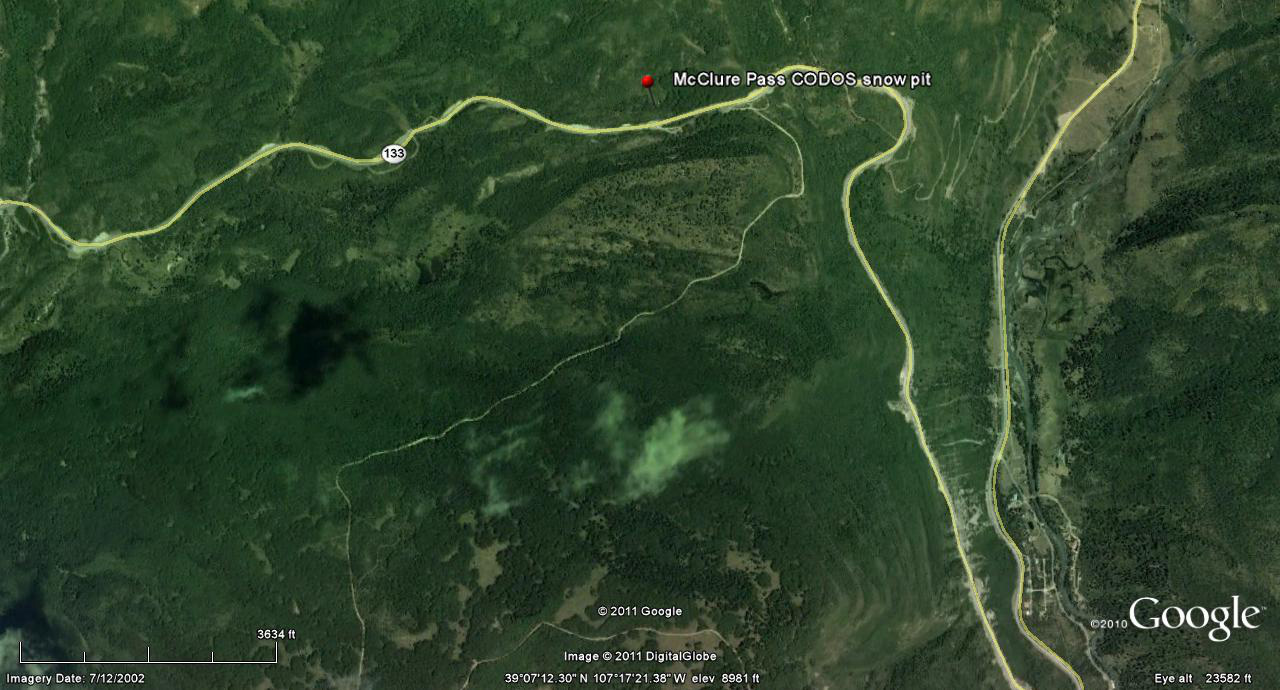
Our March 16th snowpit at the McClure Pass CODOS site, ~150 feet from the Snotel, found only 73 cm (29”) of snow, already isothermal and wet throughout, with dust layer D4 at the snowpack surface. That snowpit, on a 6° slope facing south-southwest, contained 256 mm (10.1”) of SWE, versus 12.6” of SWE then reported by the McClure Pass Snotel. Soon thereafter, both McClure and Schofield Passes received the first significant storm since March 2nd, delivering peak SWE to both. WY 2012 peak SWE at McClure Pass was only 12.7”, short of the 1971-2000 average of 18.9” and far short of the 22.8” peak of 2011. At Schofield Pass, WY 2012 peak SWE occurred on March 24th, at 21.9”, also far short of that site’s 1971-2000 average of 38.5” and very far short of the 56.3” of peak SWE in WY 2011.
Immediately following peak SWE, both the McClure Pass and Schofield Pass Snotel sites began losing snowpack and SWE values soon fell below all April measurements in the period of record. The McClure Pass Snotel lost all snowpack (SAG) at the earliest date in its history, on April 23rd. Schofield Pass still had snowpack going into May, albeit at the lowest SWE levels in its period of record, and eventually reached SAG on May 11th, also the earliest date in that site’s history.
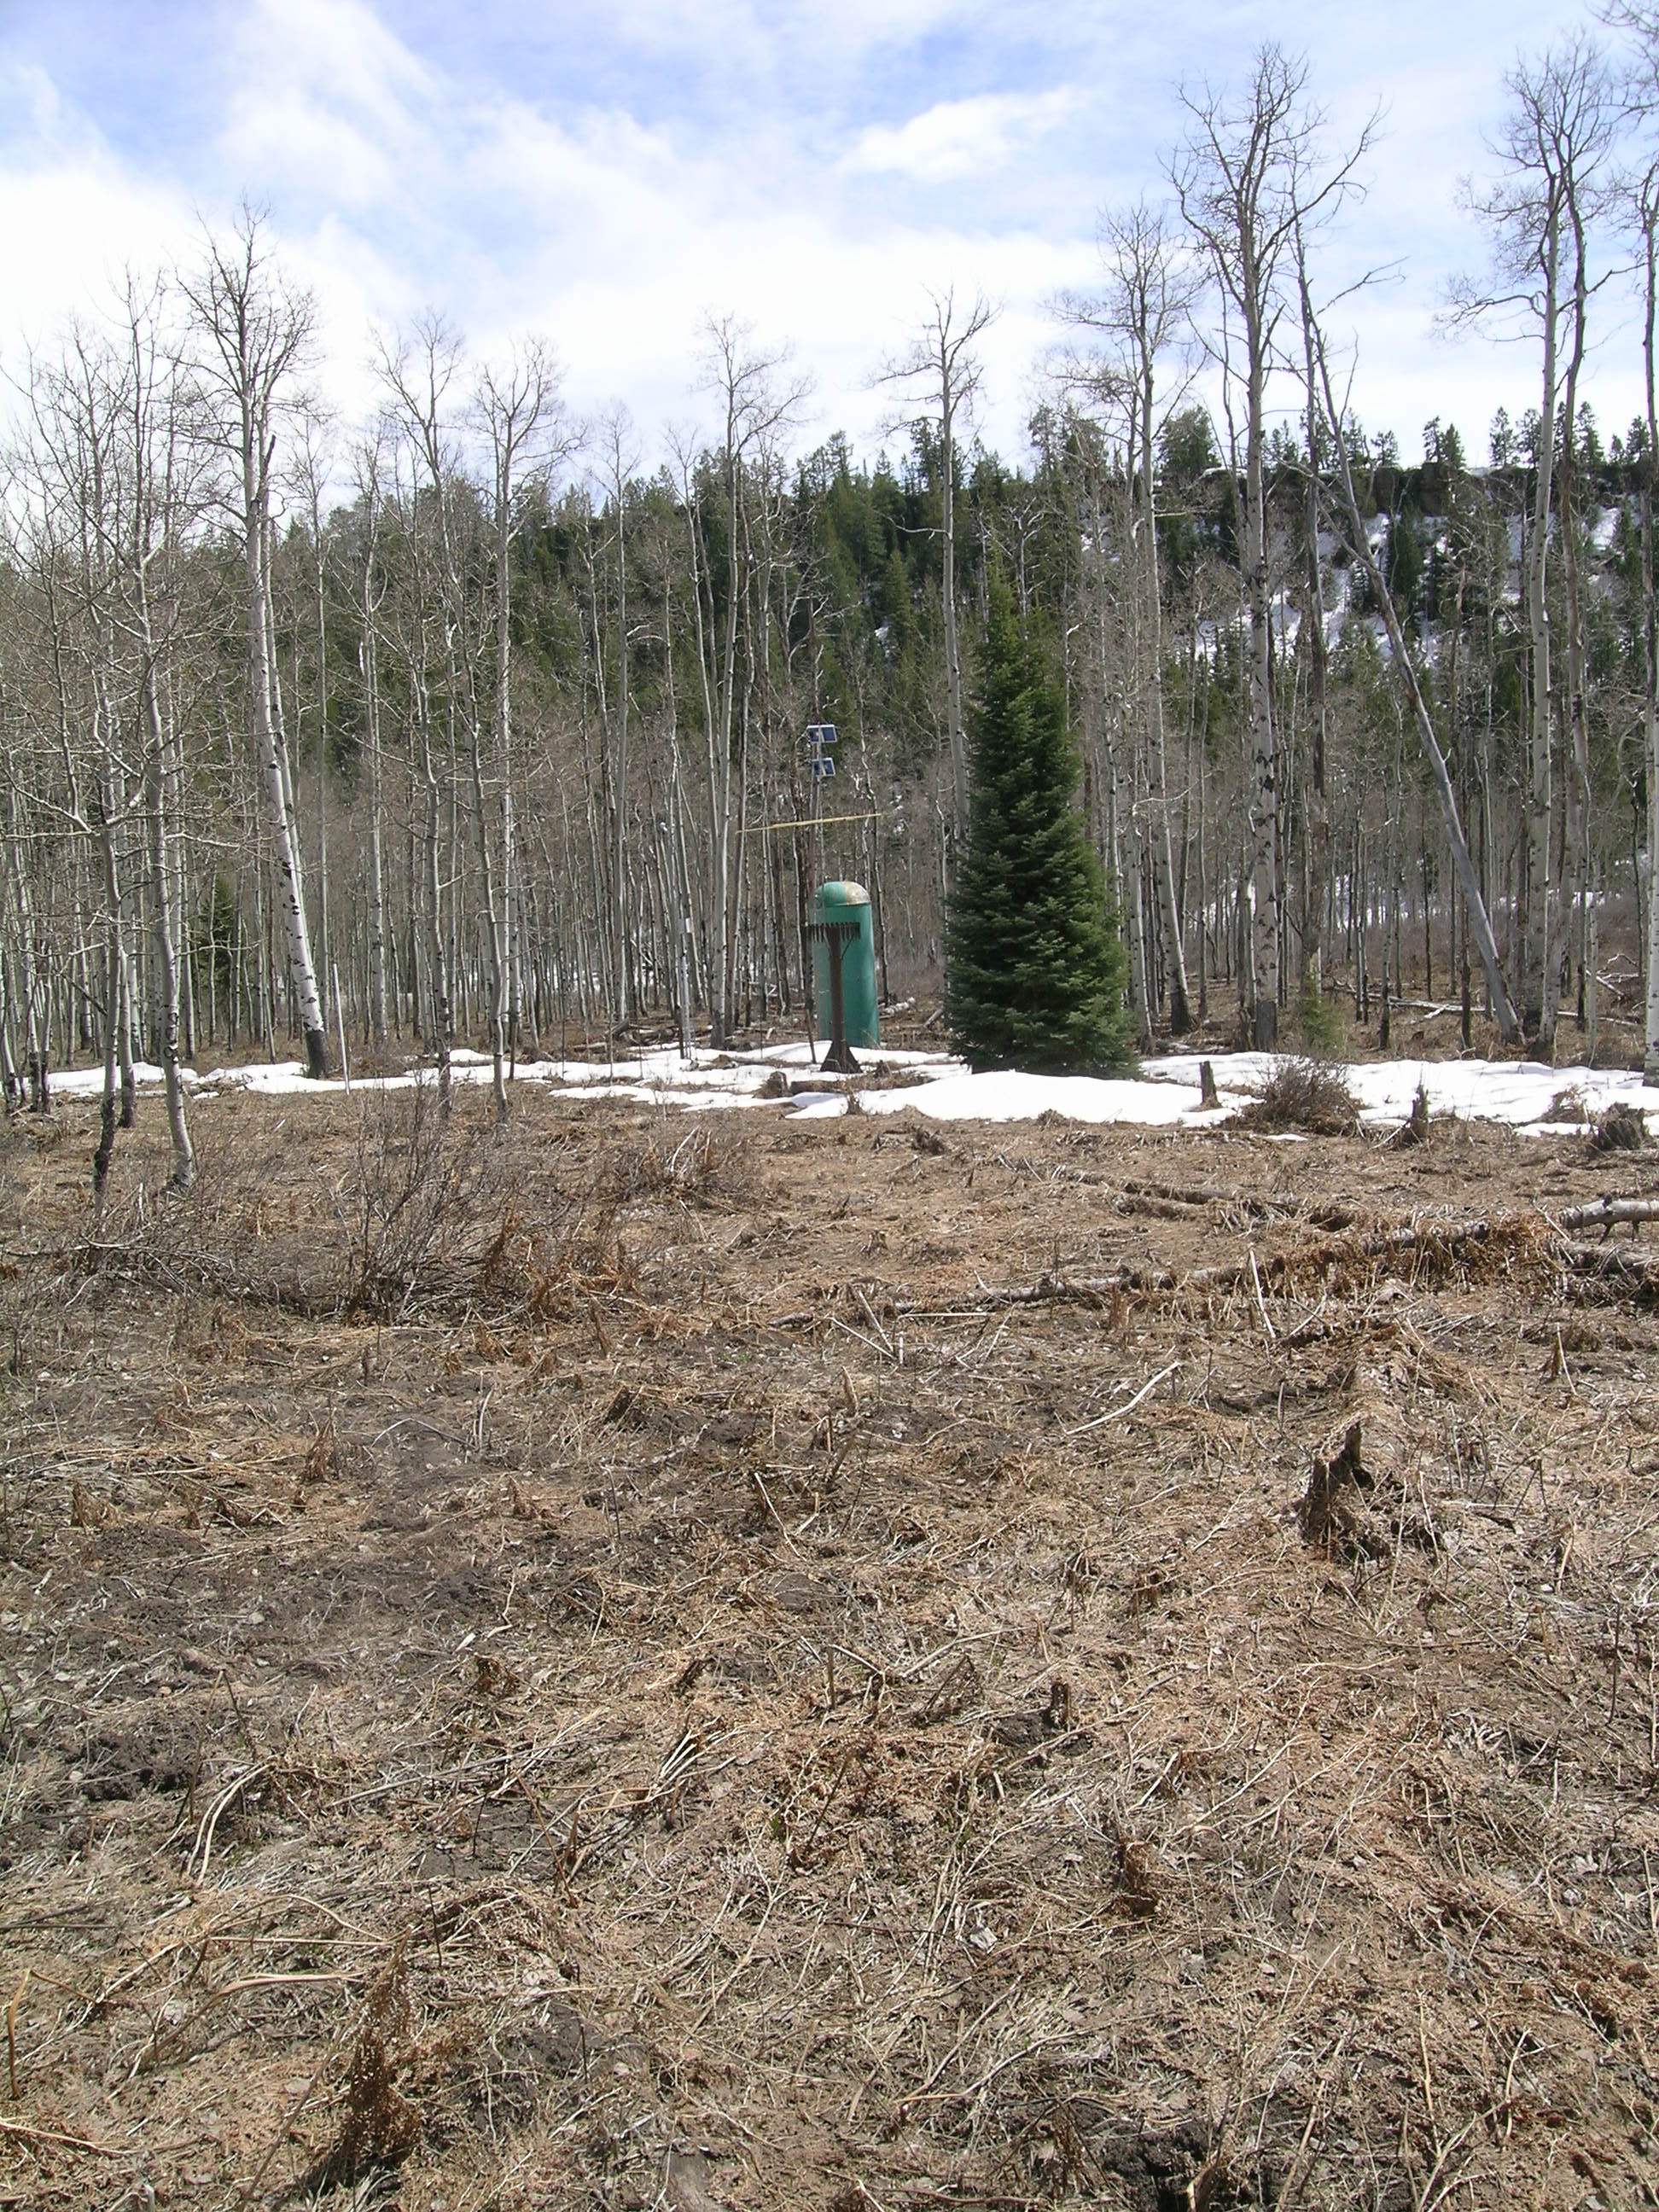
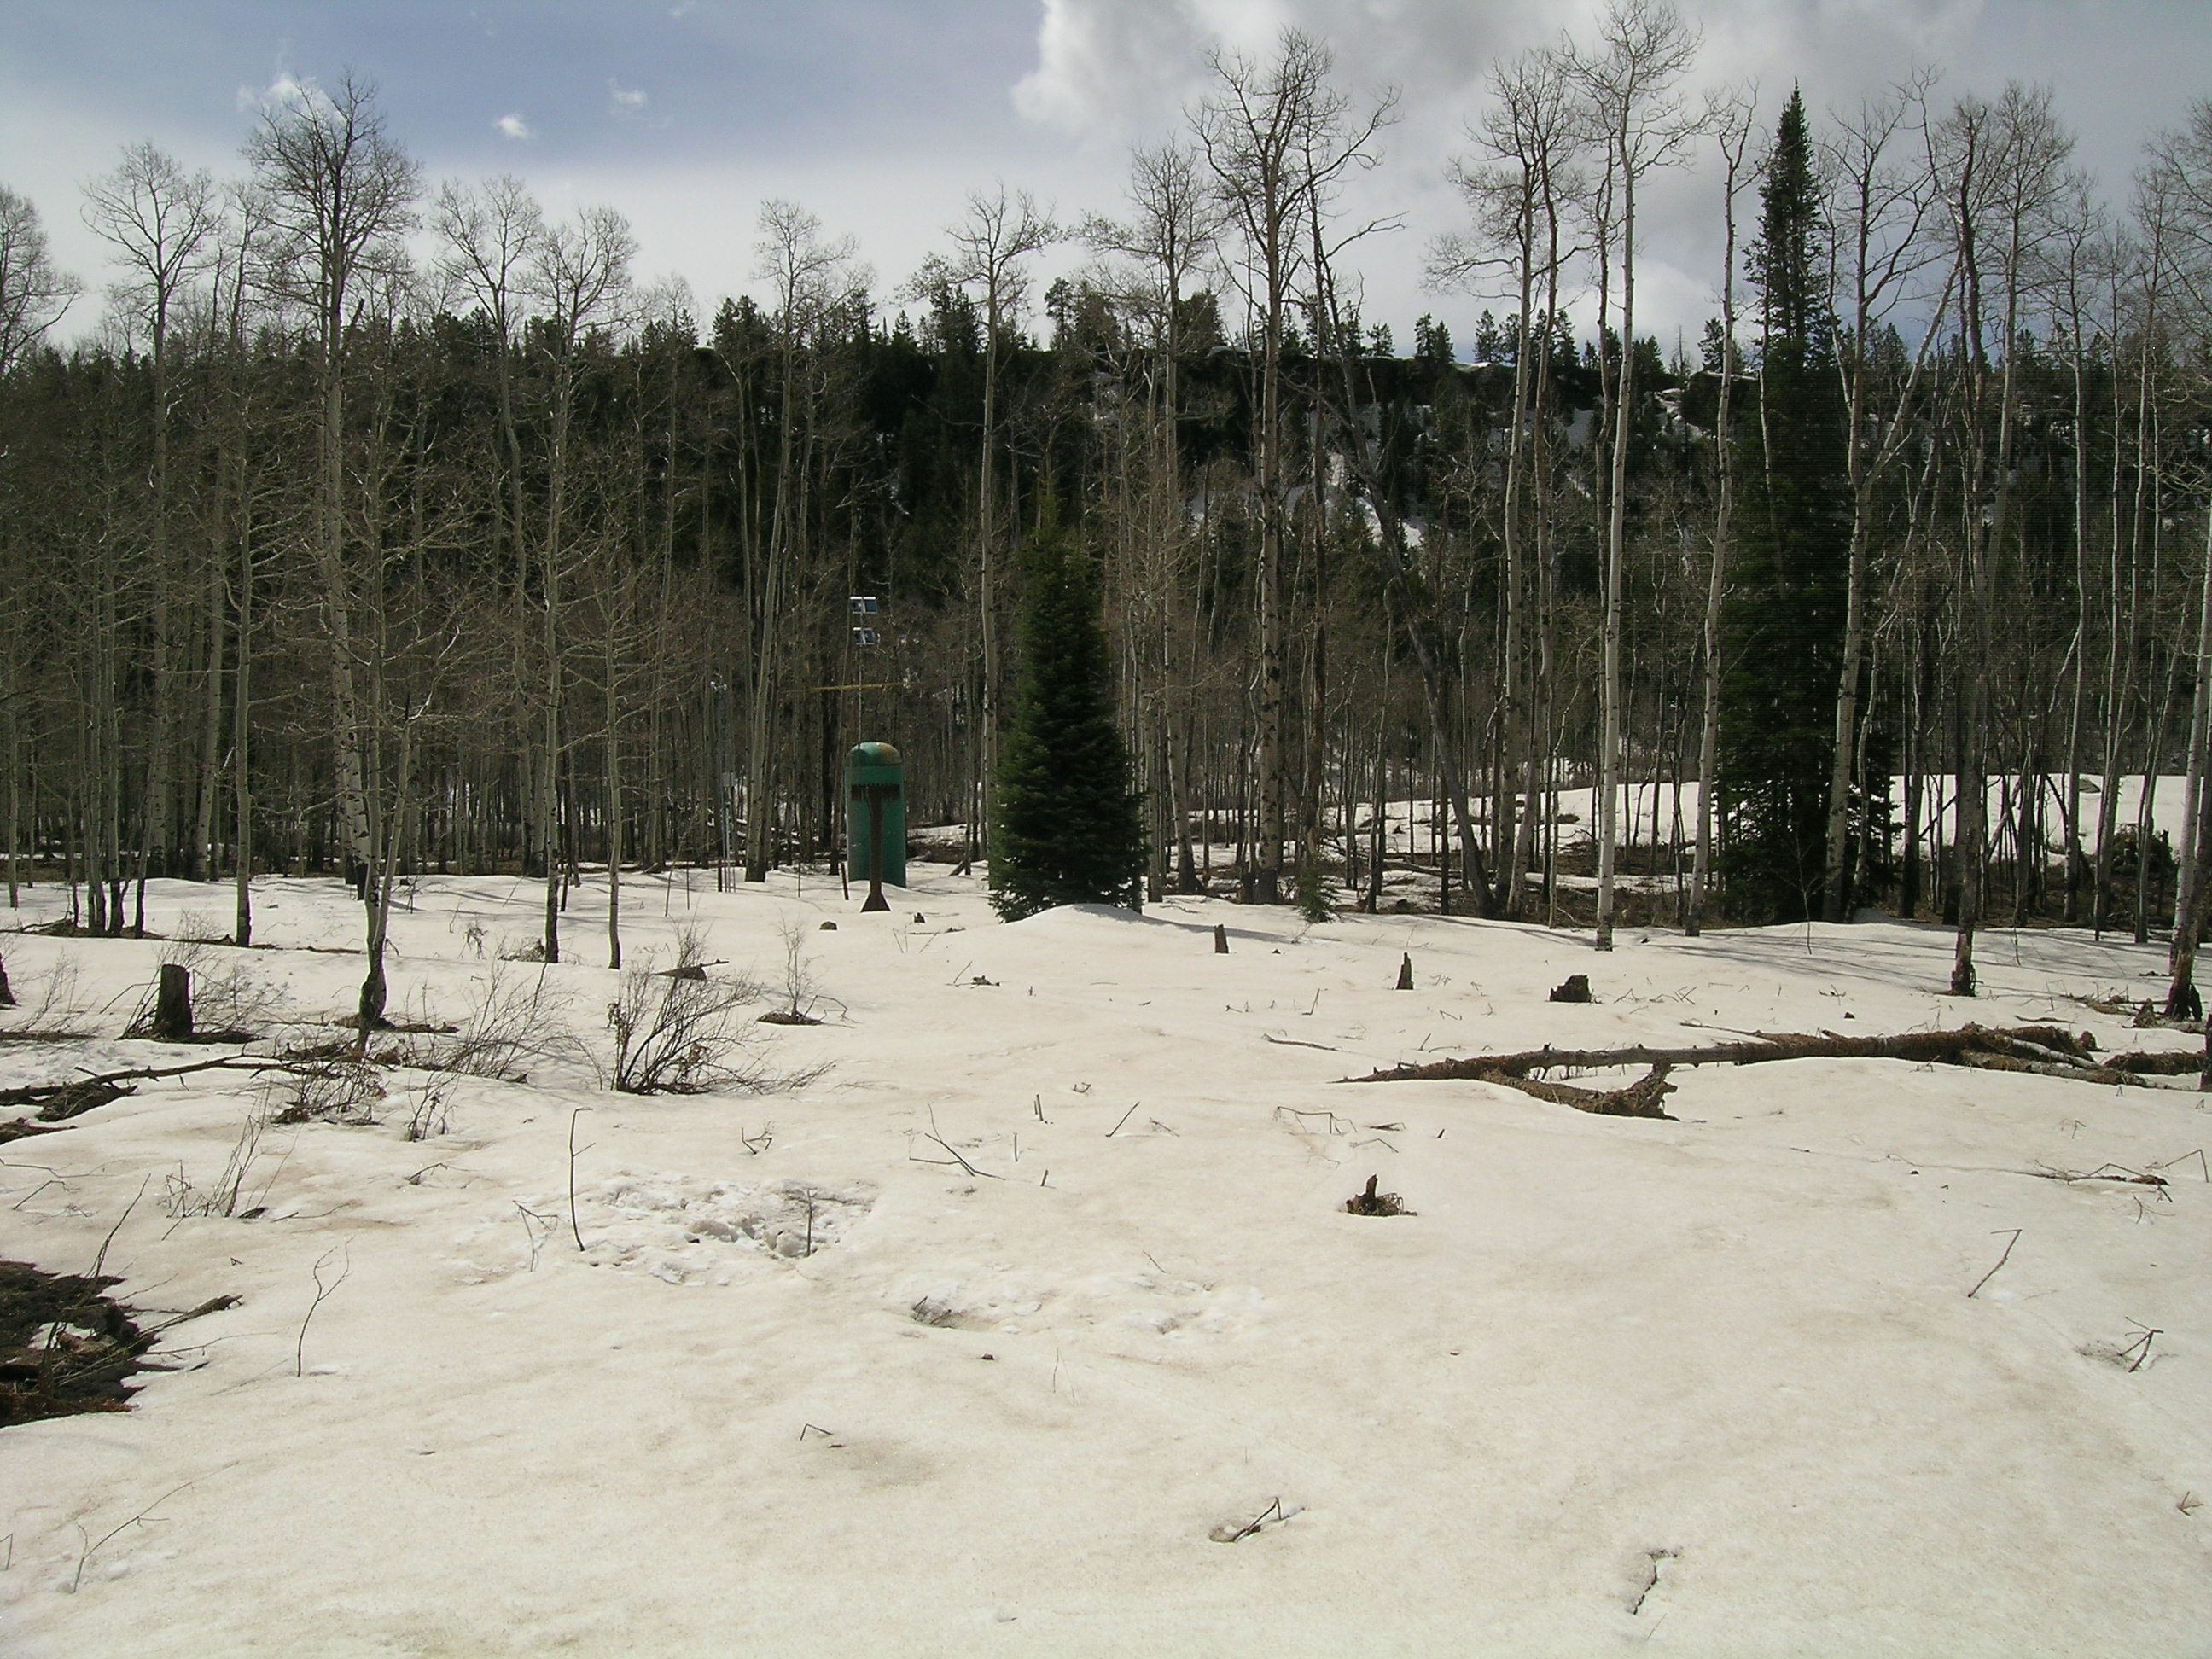
Looking south at the McClure Pass Snotel station, in the background, from the recently snow-free CODOS snowpit site on April 11th, 2012, and from the same location on May 18, 2011. At just 9,500’, the McClure Pass site is among our lowest elevation CODOS plots and typically among the first to reach SAG each spring.
During WY 2011 eleven dust events occurred at Senator Beck Basin containing a total of 14 grams of dust per square meter. Most or all of those events were found in our spring 2011 CODOS snow profiles at McClure Pass, although the final event fell just a few days before McClure Pass Snotel SAG on June 1.
During WY 2012 a similar twelve dust events occurred at Senator Beck Basin containing a total of ~10-12 grams of dust per square meter (see Senator Beck Basin Summary – Dust Log discussion). But, in a dramatic switch, late winter and spring 2012 were exceptionally dry, with widely spaced and comparatively small winter storms (see Senator Beck Basin – Winter Storm Log Discussion). Although SAG may have occurred at the McClure Pass CODOS site before WY 2012 dust layer D8 fell, on April 6th, dust layers corresponding with dust events D1, D3 and D4 were present in the snowpack at that site, in our March 16th snow profile, and reductions in snow albedo at McClure Pass were very similar to those observed in the Senator Beck Basin Study Area a few days earlier. The final four dust events, in late May, likely did fall onto remaining alpine snowpack at the higher elevations surrounding McClure and Schofield Passes, further reducing snow albedo for the remainder of the snowpack season.
Melt Rate
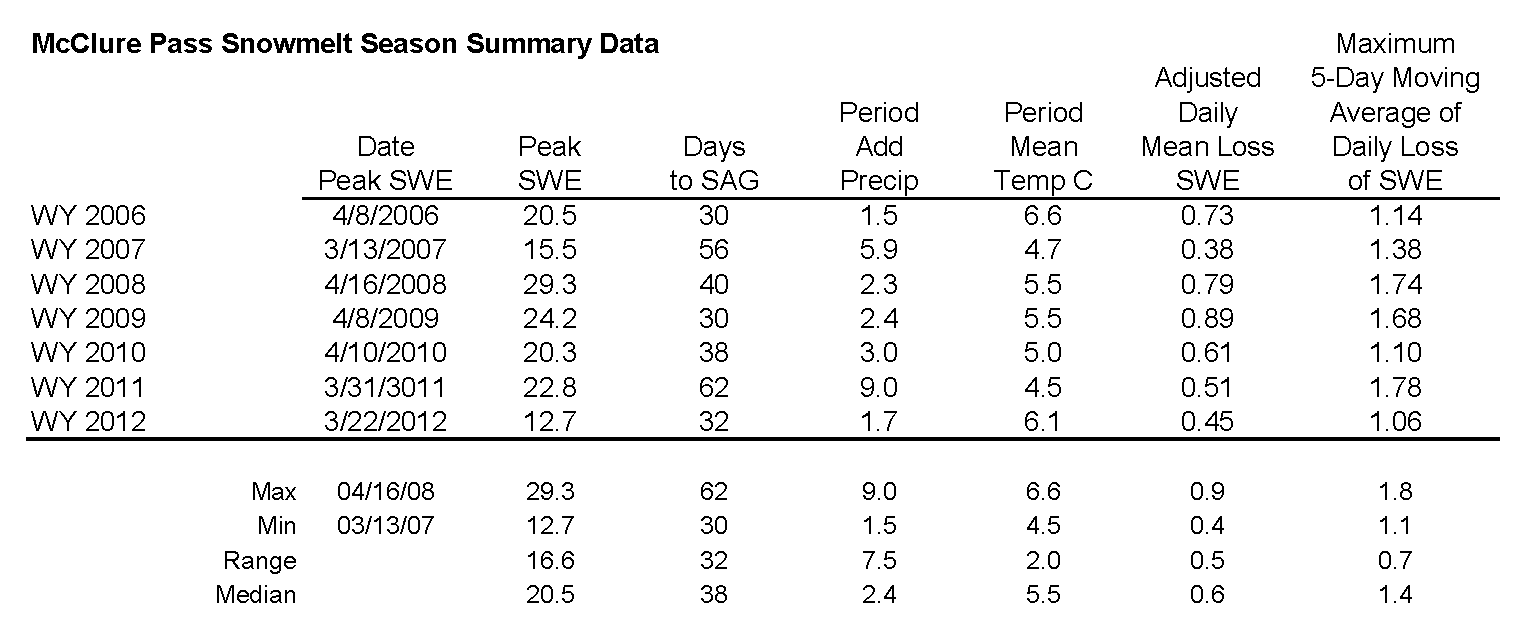
Analysis of McClure Pass Snotel data for 2006-2012 snowmelt seasons showing date and quantity of peak SWE, days from peak SWE to “snow all gone” (SAG), total additional precipitation after date of peak SWE, an “adjusted” mean daily rate of snowmelt adding the additional precipitation to the peak SWE total, the maximum five-day moving average of daily melt, and the mean air temperature over the entire snowmelt period, from peak SWE to SAG.
This discussion references CODOS Snotel site data and analyzes rates of snowmelt from Spring 2006 to the present, spanning the period during which we’ve rigorously observed dust-on-snow at our Senator Beck Basin Study Area, at Red Mountain Pass. As discussed in prior CODOS Updates, many Snotel sites exhibit a radiative regime where surrounding trees reduce the access of incoming solar radiation to snowpack over the SWE measuring snow pillow, and where re-radiation of long wave energy from that vegetation and reduced skyview may inhibit radiant cooling and extend surface snowmelt during nighttime hours. As a consequence, Snotel sites often do not experience the maximum effects of dust-on-snow on snowmelt timing and rates, as compared to generally level, open meadow sites where solar access is unimpeded and snowmelt energy budgets and snowpack ablation are measured. The McClure Pass Snotel site does experience partial shading, by primarily aspen tree trunks (as seen in the photo above). Snowmelt rates at the McClure Pass Snotel do lag those at the slightly south-sloping CODOS snowpit plot just to the north, in an open meadow, but not to the extent observed at more densely forested Snotel sites. The Schofield Pass Snotel site also experiences less reduction in solar access than many Snotel sites.
WY 2012 SWE accumulation and ablation at McClure Pass Snotel, with upper and lower quartiles of period of record shown in light grey, middle quartiles in dark grey surrounding median trace for period of record, and mean trace for 1971-2000 period.
Despite the comparatively early date of WY 2012 peak SWE at McClure Pass Snotel, on April 23rd, spring 2012 produced a steep descending limb in the SWE plot similar to the single, very steep plunge following the second peak SWE in 2011, albeit with a slight ‘bounce’ in SWE just before SAG (see figures above). In a departure from our other CODOS sites, Spring 2012 actually did not produce the earliest date of Peak SWE at McClure Pass in the past seven years. That distinction fell to WY 2007, which also produced the lowest rate of daily SWE loss. However, WY 2012 did record the lowest value of peak SWE and, despite showing the second slowest rate of melt, 2012 also produced the earliest date of SAG in the entire Snotel period of record at McClure Pass.
About 16 miles to the southeast, at 10,700’, and at the headwaters of both the Crystal and East rivers, WY 2012 snowpack ablation at the Schofield Pass Snotel more closely resembled the two-phased process observed at most other CODOS Snotel sites, with a steady but moderate melt rate immediately following peak SWE, an acceleration in early April subsequently interrupted by small rebounds in SWE during stormy weather in mid and late April, followed by a final plunge to SAG. Largely because of the very early start of peak SWE and subsequent snowmelt in WY 2012, compared to the extremely late peak SWE and start of snowmelt in WY 2011, these two back-to-back seasons produced the lowest (0.53” per day in 2012) and highest (1.64” per day in 2011) rates of dust-enhanced daily average SWE loss observed at Schofield Pass, and the highest 5-day moving average rate of melt (at 2.44”) of all our CODOS sites, for all years.
Stream Flows
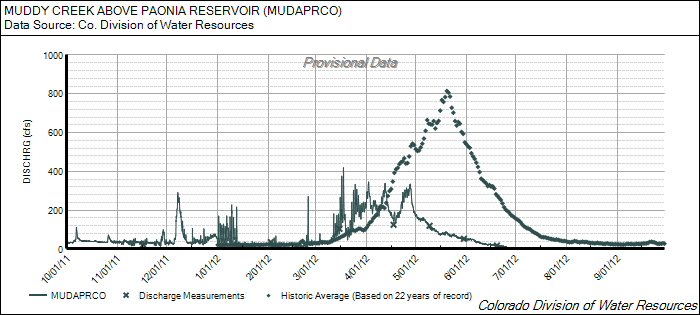
WY 2012 Muddy Creek above Paonia Reservoir stream gauge data for a 246 sq. mi. drainage area; no elevation is given.
Given the very dry spring and sub-par snowpacks throughout the western Elk mountains, below average snowmelt runoff in Muddy Creek and the Crystal River was unsurprising. The Muddy Creek above Paonia Reservoir hydrograph shows an early start to runoff with substantially above-average flows in March and early April to a well-below-average peak, followed by an initially rapid but gradually decelerating decline in flows. As was typical throughout the state, by the end of June streamflows had fallen below levels expected two months later, in September.
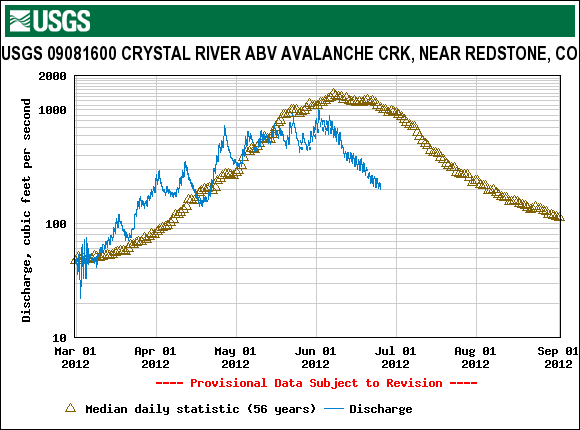
WY 2012 USGS Crystal River above Avalanche Creek stream gauge data for a 167 sq. mi. drainage area in the upper Crystal River valley, above 6,905’. Current year and historic data reflect a few small diversions for irrigation upstream of the gauge.
The Crystal River hydrograph above presents a very similar pattern, with an early start to runoff at substantially above-average flows in March and early April. Flows peaked at half of average discharge but, unlike most sites, near average timing. And, as has been the norm elsewhere, June flows fell to levels expected in late summer.
In addition to the very warm temperatures associated with prolonged periods of dry and sunny weather in late winter and spring 2012, dust-on-snow events D4 (March 6th) and D8 (April 6th) played a role in the early and high runoff levels on the ascending limbs of these hydrographs, reducing snow albedo and hastening the ripening of the snowpack in late March, to isothermal. That and additional dust then continued absorbing and adding solar energy to the snowmelt energy budget during subsequent periods of exposure at the snowpack surface in April and May. Additional dust events in late May, particularly D12 on May 26th, further reduced snow albedo in the scant remaining high elevation snowpack in the western Elk Mountains and hastened the final days of snowmelt runoff.