 Water Year 2012 CODOS Summary
for Park Cone
Summary | Snowpack & Dust | Melt Rates | Stream Flows
Summary
Water Years 2011 and 2012 are a case study in interannual variability of Colorado snowpack formation and ablation driven by vastly different late winter and spring weather conditions, perhaps representing seasonal extremes. In dramatic contrast with the endless storms and tremendous snowpacks of Mar/Apr/May 2011, extremely dry late-winter and spring weather in 2012 resulted in very low values of peak SWE, very early in the spring, in the northern headwaters of the Gunnison Basin, and minimal valley floor snowpack.
On the other hand, overall, the past two seasons produced comparatively similar dust-on-snow conditions in the Colorado mountains, although the Taylor Park locale in particular experienced less dust and albedo reduction than other sites monitored by CODOS. Spring 2012 dust effects on snowpack ablation at Park Cone and elsewhere in the Taylor River watershed occurred in two phases, at different rates. Beginning in March, comparatively weak dust-on-snow layers remained exposed at the snowpack surface for prolonged periods, absorbing enough additional solar energy to advance snowpack warming, enabling snowmelt runoff to begin. During April, despite occasional snowfalls, dust events D4-D8 incrementally reduced snow albedo and snowpack ablation accelerated, aided by unseasonably warm weather. Snowmelt runoff began accelerating well in advance of long-term average timing, then slowed during the unsettled weather in April, then peaked low and early in mid May as the final four dust events of the season fell on the remaining high elevation snowpack.
SnowPack & Dust Discussion
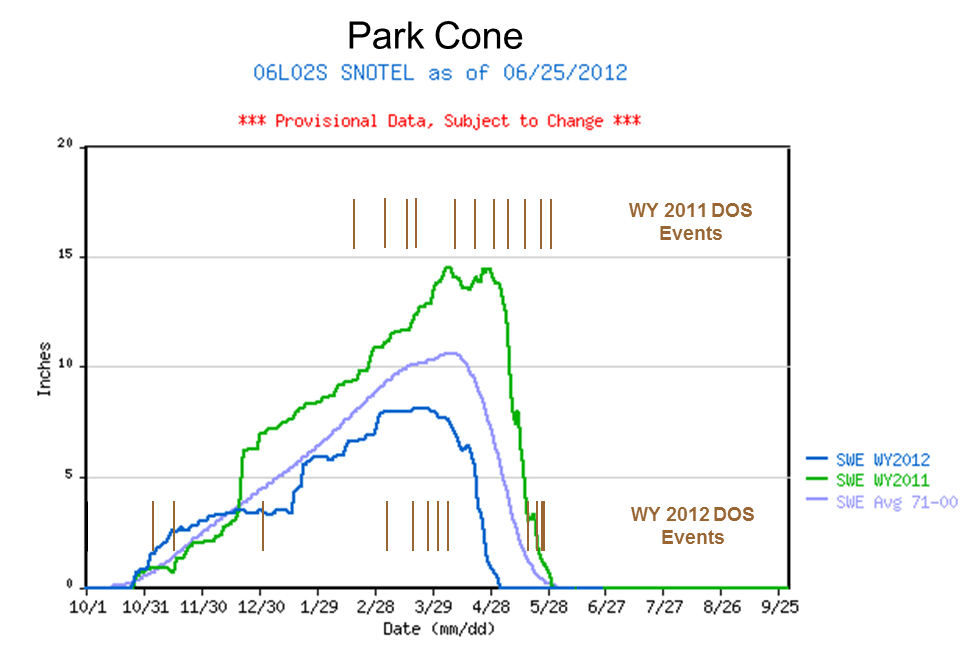
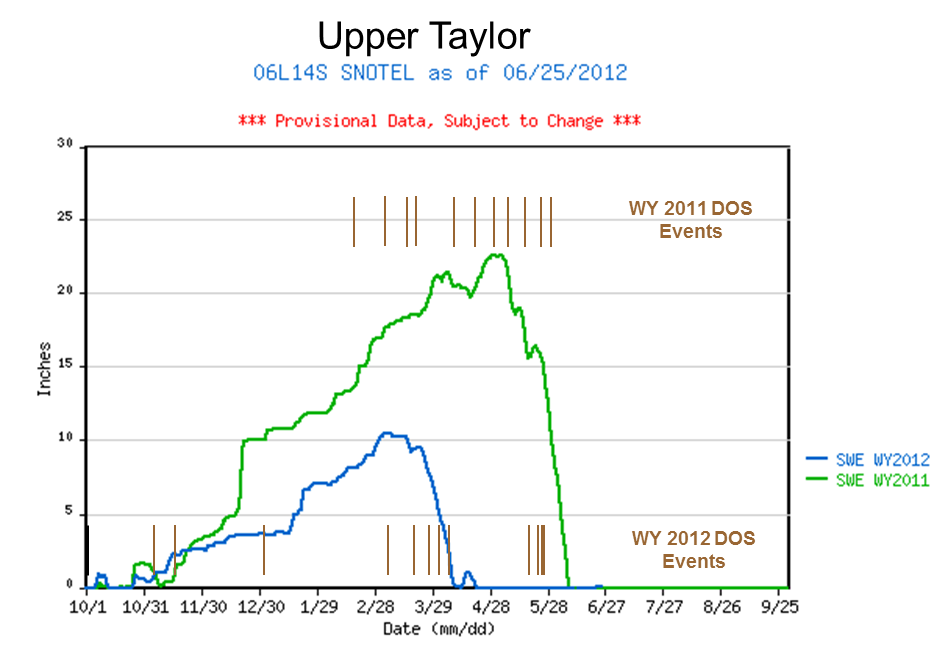
SWE accumulation and ablation for Water Years 2011 and 2012, with dust-on-snow events shown, by date, as brown bars for both water years (as observed at the Senator Beck Basin Study Area). Park Cone and Schofield Pass plots show 1971-2000 mean SWE accumulation data, whereas the period of record at Upper Taylor is just three winters, to-date, and no mean has been calculated.
In a reversal of early winter WY 2011, Water Year 2012 snowpack formation at Park Cone Snotel began well but stalled in December. After a strong rebound in January, Park Cone hovered just below average until stalling again in early March. Due to the very dry late-winter and spring experienced throughout Colorado, WY 2012 peak SWE at Park Cone was only 8.1”, short of the 1971-2000 average of 10.6” and far short of the 14.4” peak of 2011. Peak SWE 2012 also occurred early in the season, on March 27th, eleven days earlier than the 1971-2000 average of April 7th and a full month earlier than the latter of two nearly equal equivalent Peak SWE values in 2011, on April 28th, 2011.
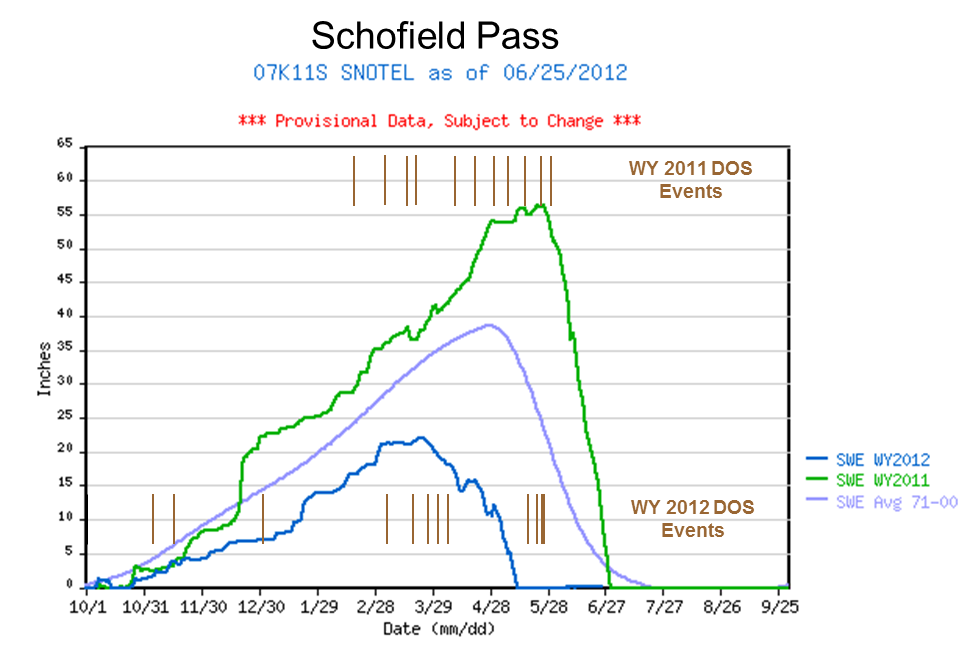
Further up the watershed, the Upper Taylor Snotel recorded a larger but earlier WY 2012 peak SWE of 10.4” on March 7th. To the west, the Schofield Pass Snotel peaked at 21.9” on March 24th, less than half of and two months earlier than peak SWE in 2011 (see Schofield Pass Snotel projection plot). Although WY 2012 peak SWE at Park Cone fell within the lower quartile of data for the period of record (see Park Cone Snotel projection plot below), peak SWE at Schofield Pass occurred at the bottom of the lower quartile of values, and thereafter fell well below all prior period of record daily SWE values for the duration of the season. Of all three of these Snotel sites, Park Cone exhibited less overall variation between WY 2011 and 2012 than Upper Taylor and Schofield Pass, but was still well below par. At lower elevations, we were particularly struck by the absence of snowpack in the Gunnison valley floor during our CODOS field campaigns.
At the CSAS Senator Beck Basin Study Area at Red Mountain Pass the total number of events and approximate total mass of dust deposited during WYs 2011 and 2012 were similar, at 11 and 12 events, and 14 and ~10-12 grams per square meter, respectively (see Senator Beck Basin Summary – Dust Log discussion). However, perhaps because of the same local terrain influences on weather that result in Park Cone being a comparatively dry site, both seasons saw less dust deposited at Park Cone than at Senator Beck Basin, and Park Cone was clearly the least dusty of all our CODOS dust monitoring sites in WY 2012. Nonetheless, dust did play a role in snowpack ablation during both seasons, albeit in very different scenarios.
During WY 2011 eleven dust events occurred at Senator Beck Basin, many of which were confirmed at Park Cone in CODOS snow profiles. However, relentless accumulation of late winter and spring snow routinely buried new dust layers and restored high snow albedo values throughout the State, throughout April and May. That sustained winter-like weather also conserved, for a time, the snowpack cold content measured in our March 29th, 2011 snowpit at Park Cone. Then, sometime prior to our April 22nd, 2011 snowpit, the Park Cone snowpack became isothermal. Within a week, rapid snowmelt began in tandem with several additional dust-on-snow events. Although the Park Cone Snotel was very near “snow all gone” (SAG) during the final and largest dust storm of WY 2011, that D11 event of May 29th did fall onto still-extensive higher elevation snowpacks in the Taylor River watershed, further reducing albedo and enhancing snowmelt rates for the remainder of the very large runoff.
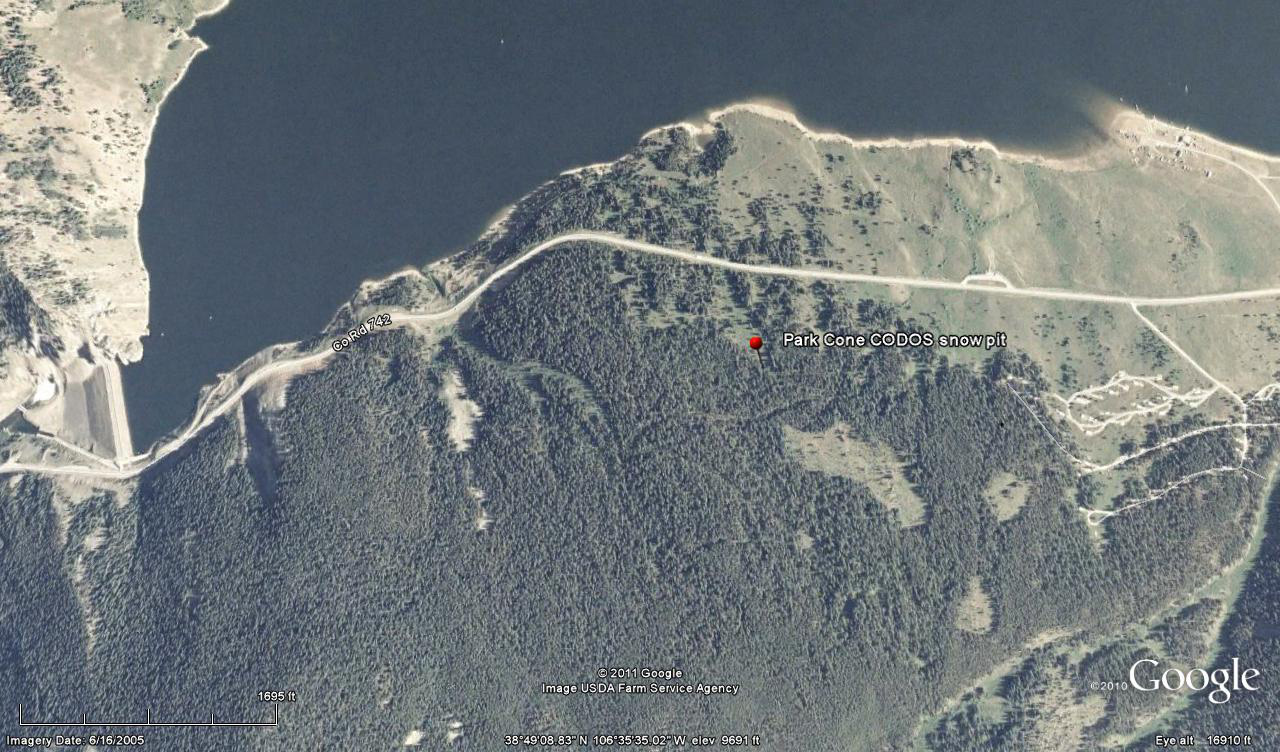
In sharp contrast, late winter and spring 2012 were exceptionally dry, with widely spaced and comparatively small winter storms (see Senator Beck Basin – Winter Storm Log Discussion). WY 2012 dust loading and reductions in snow albedo at Park Cone and in lower Taylor Park were weaker than at the Senator Beck Basin Study Area. Further, because the Park Cone CODOS snow pit site slopes 11° to the north, the angle of incidence of sunlight hitting the snowpack surface is lower. Radiative forcing by dust is less intense at Park Cone, given the same dust loading, than at our Senator Beck Basin study plots, which both slope just 3° to the northeast.
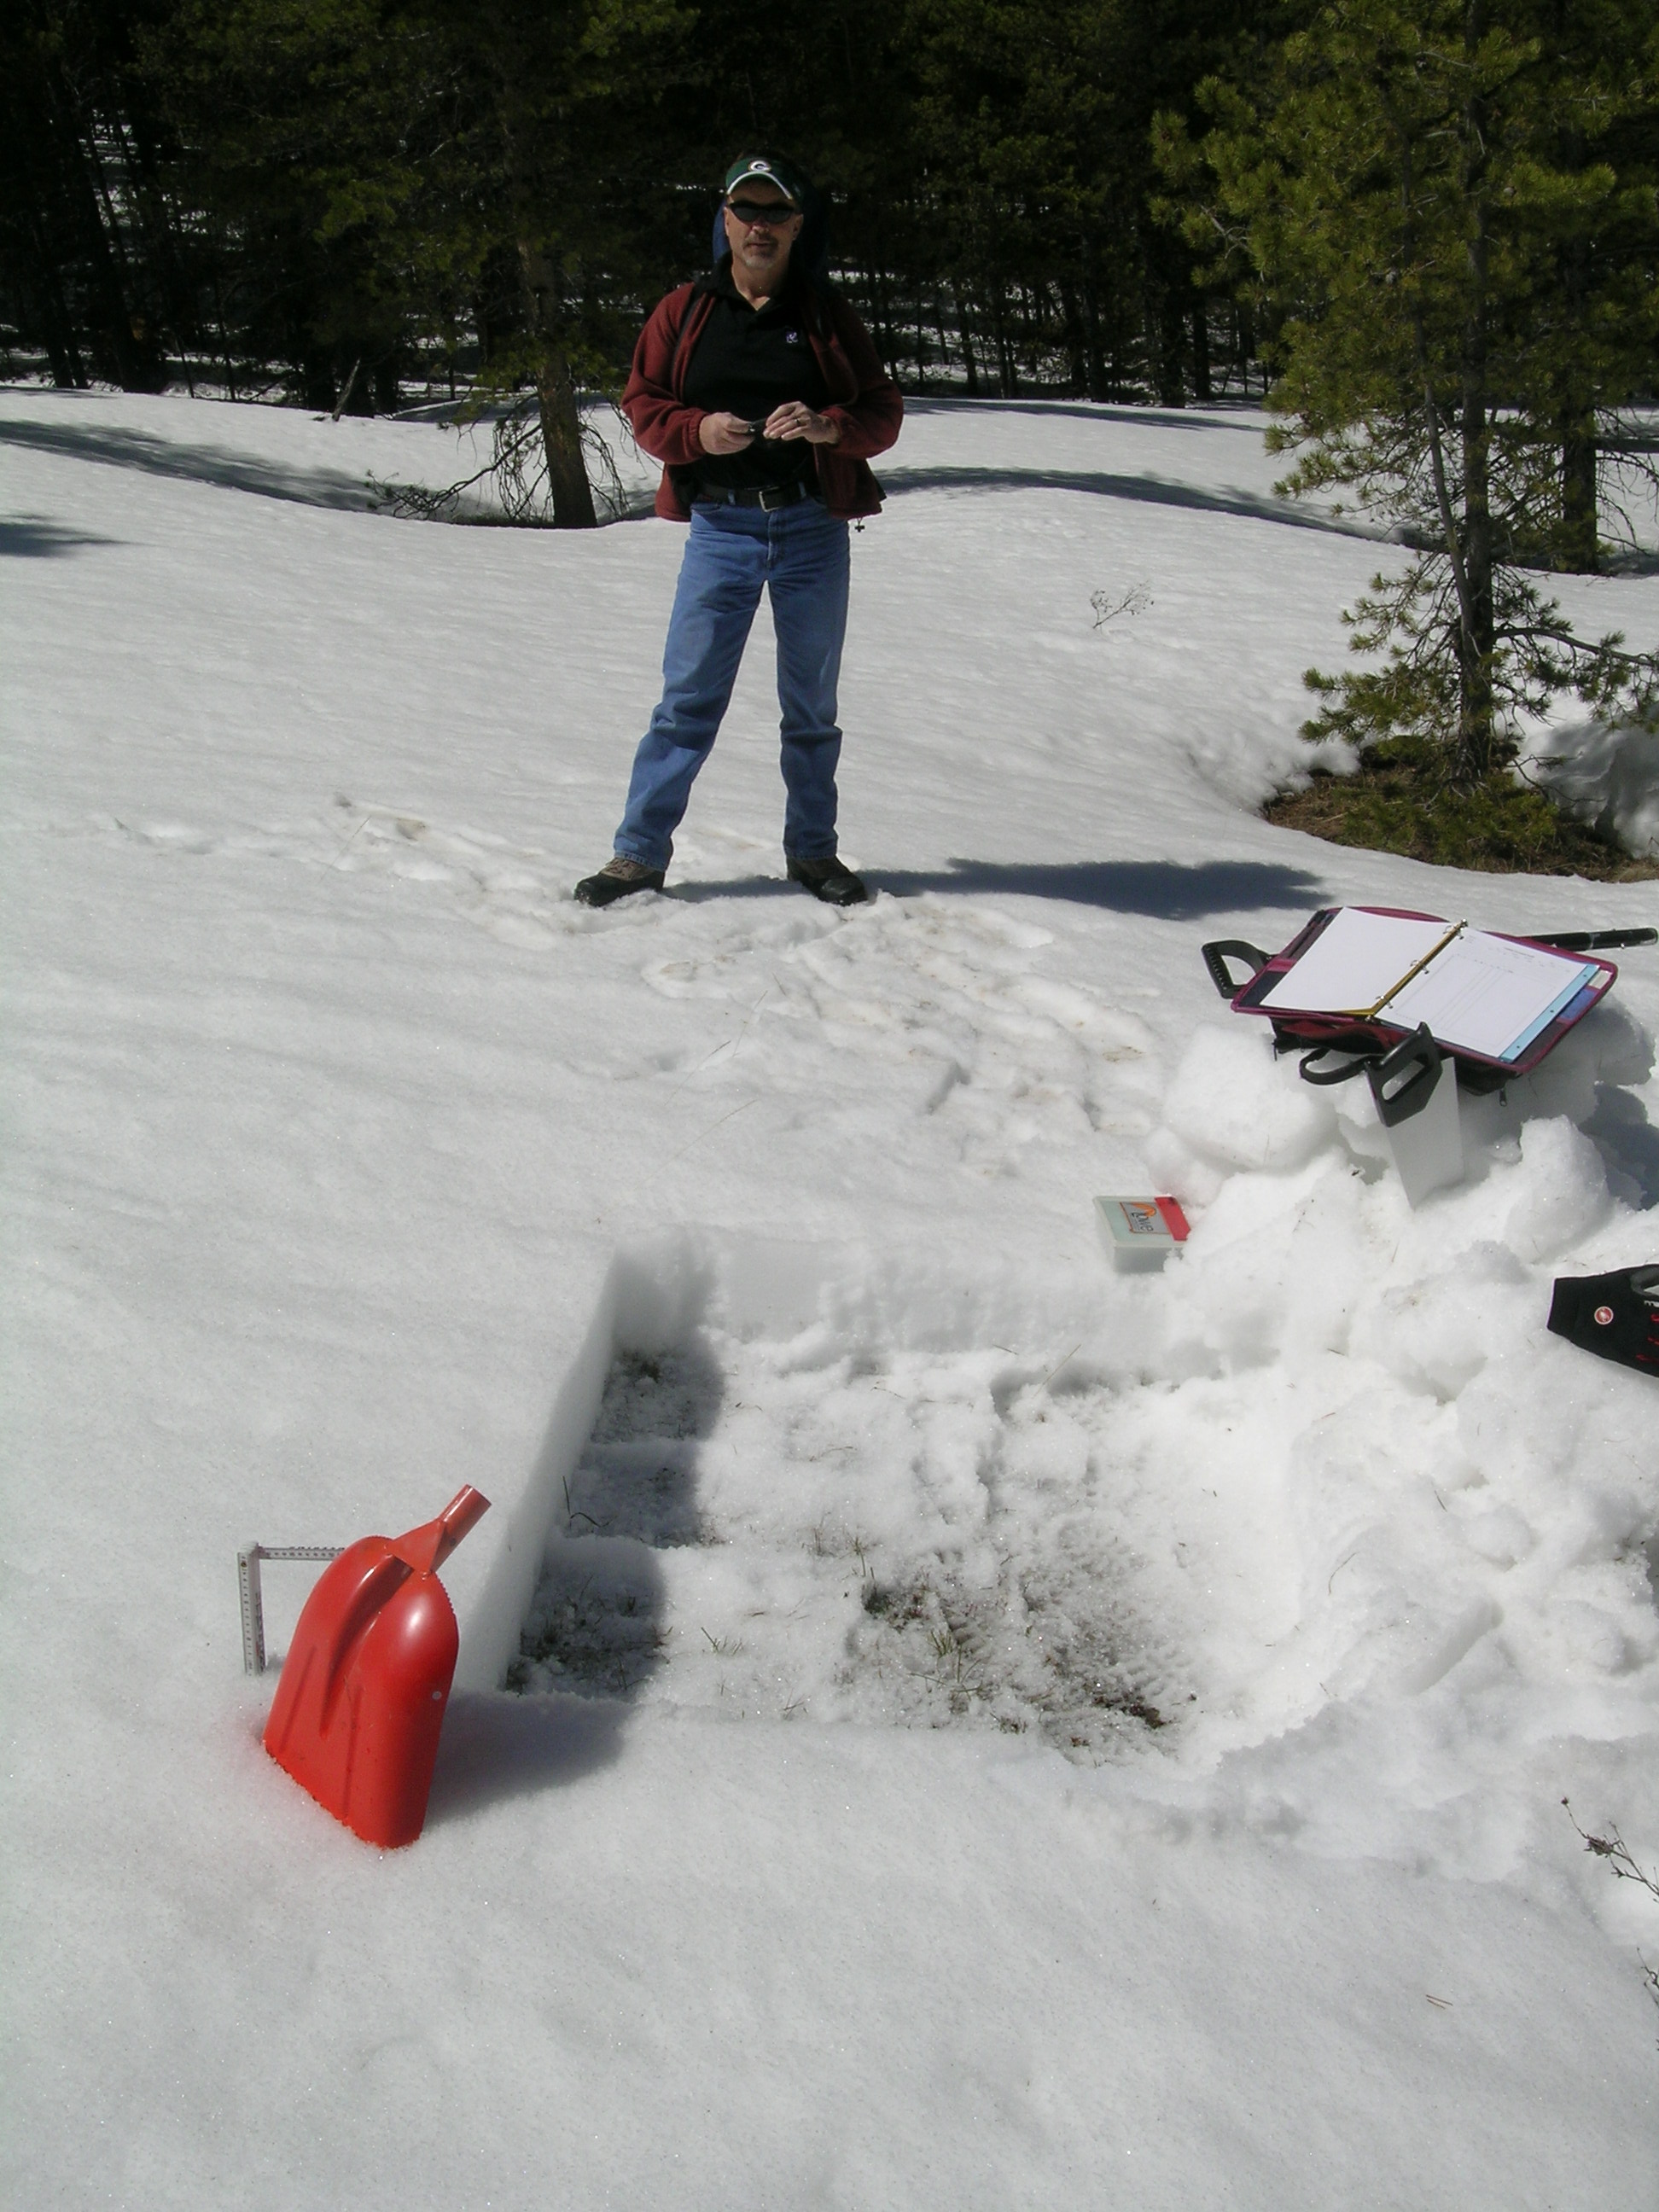 Upper Gunnison River Water Conservancy District general manager Frank Kugel at the Park Cone CODOS snowpit site on April 9th, 2012. This snowpit was isothermal and rapidly approaching “snow all gone” (SAG), with free water throughout the snowpack and with merged dust layers corresponding to WY 2012 events D4-D8 at the surface producing minor reductions in snow albedo.
 During our March 14th snow profile at Park Cone, we found a weak layer of event D4 dust at the snowpack surface, slightly reducing snow albedo. Nonetheless, several inches of melt/freeze, polycrystal grains in the near-surface snow, including actively melting forms, indicated that the reduction in snow albedo was still sufficient to result in surface melt despite an air temperature of -2° C at the time. Even with surface melt in progress, just 10 cm (4”) below the surface the snow temperature was -7° C, and -7.5° C another 10 cm below that, with a mean snowpack temperature of -3.5° C.
Despite the minimal reduction in snow albedo caused by dust layer D4, dust was hastening snowpack warming to 0° C and by our next site visit, on April 9th, the snowpack had long-since become isothermal at 0° C throughout and consisted entirely of polycrystal (melt) forms. Once isothermal, all additional energy absorbed by dust layers D4-D8 (as present) at the Park Cone snowpack surface resulted in enhanced rates of snowmelt and snowpack ablation. Snow all gone (SAG) followed very quickly in our snowpit plot, prior to dust events D9-12, but was more delayed by tree shading at the adjoining Park Cone Snotel site (see Melt Rate discussion below). Those late-season dust events, including D12 on May 26th, did fall onto the remaining high-elevation snowpack in the upper Gunnison watershed, including the Lake Fork locale.
Spring 2012 air temperatures did not vary substantially from prior snowmelt seasons. Despite the minimal snowpack, and the sustained periods of dry, sunny weather supporting the dust-enhanced radiative forcing of snowmelt, the Park Cone Snotel did not record its earliest date of SAG in its period of record, as many CODOS site Snotels and the nearby Schofield Pass Snotel did. Rather, the entire snowmelt cycle remained within the lower quartile of the Park Cone Snotel period of record, to SAG on May 3rd, 2012. Snowmelt at the Slumgullion Pass Snotel also fell within the historically early lower quartile of SAG dates.
Melt Rates
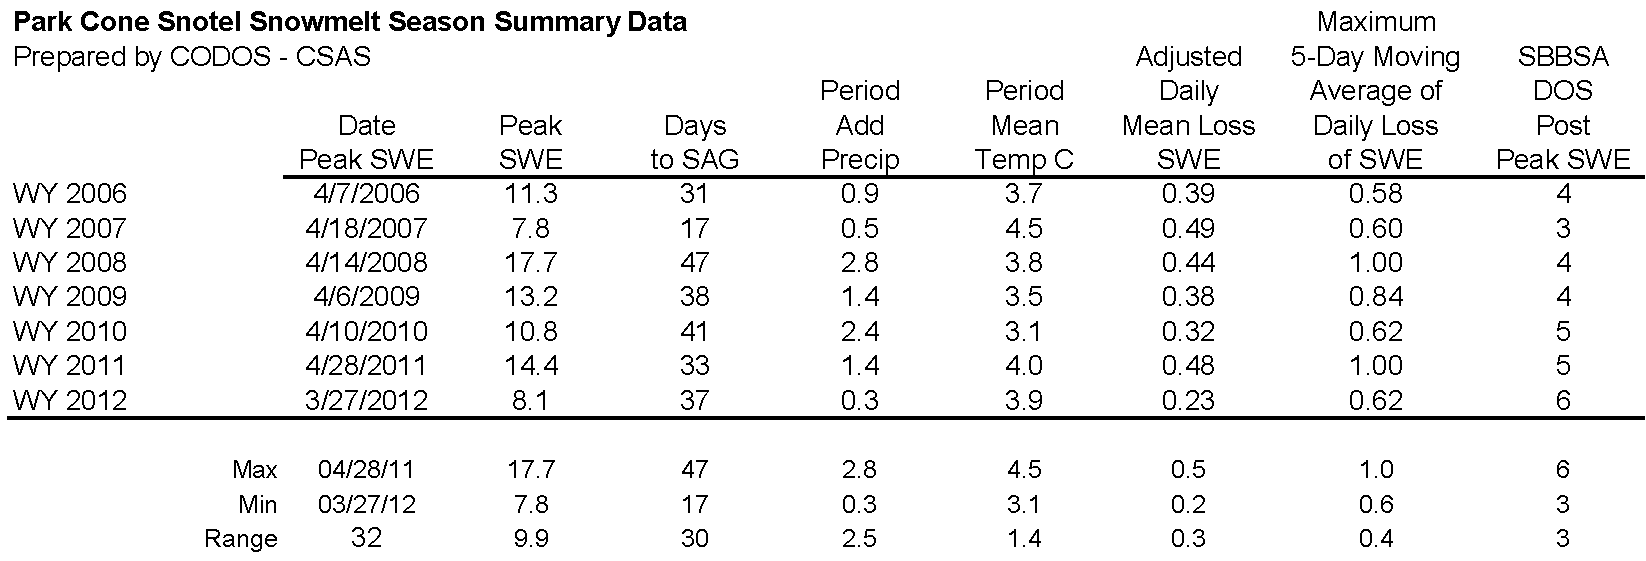
Analysis of Park Cone Snotel data for 2006-2012 snowmelt seasons showing date and quantity of peak SWE, days from peak SWE to “snow all gone” (SAG), total additional precipitation after date of peak SWE, an “adjusted” mean daily rate of snowmelt adding the additional precipitation to the peak SWE total, the maximum five-day moving average of daily melt, and the mean air temperature over the entire snowmelt period, from peak SWE to SAG.
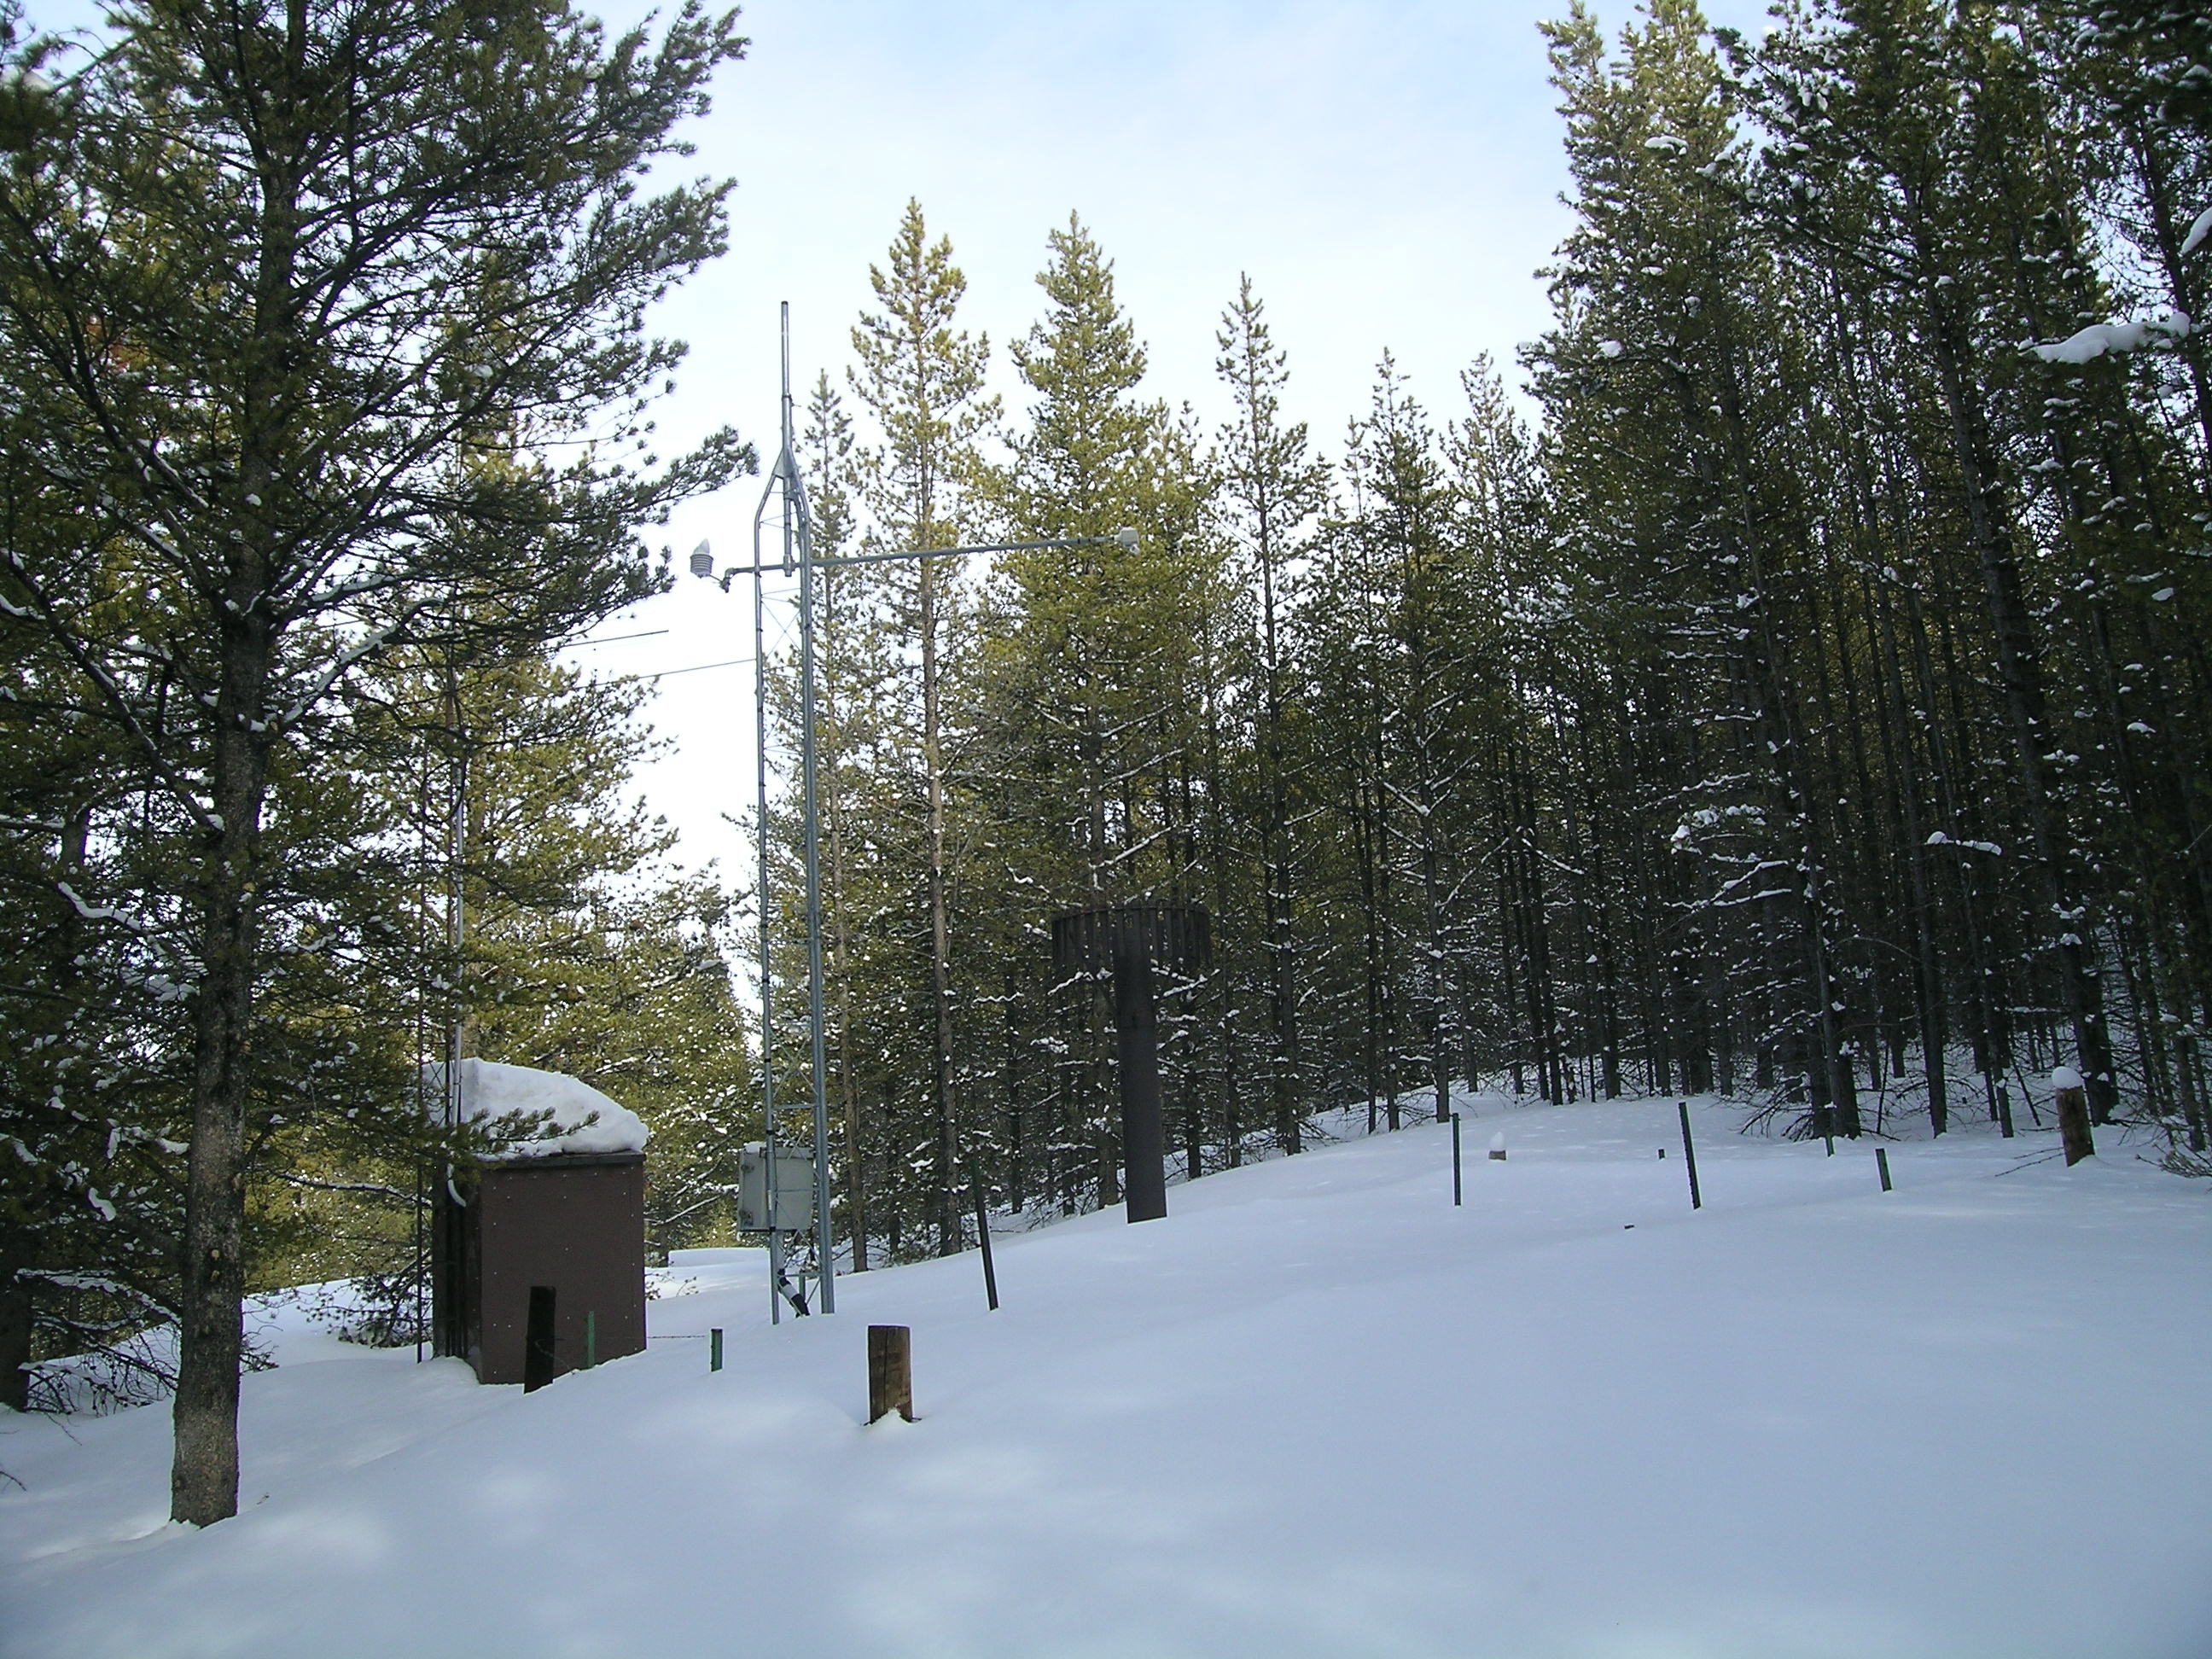
The Park Cone Snotel site on March 29, 2011, with 54” of snow containing 13.4” of SWE, and still gaining SWE. This photo, looking east, shows the adjoining forest cover shading the site from the east, south, and west, blocking direct solar access to the snow surface over the snow pillow and reducing the influence of dust on snowmelt rates at this Snotel site.
This discussion references CODOS Snotel site data and analyzes rates of snowmelt from Spring 2006 to the present, spanning the period during which we’ve rigorously observed dust-on-snow at our Senator Beck Basin Study Area, at Red Mountain Pass. As discussed in prior CODOS Updates, many Snotel sites, including Park Cone, exhibit a radiative regime where surrounding trees reduce the access of incoming solar radiation to snowpack over the SWE measuring snow pillow, and where re-radiation of long wave energy from that vegetation and reduced skyview may sustain periods of surface snowmelt during nighttime hours. As a consequence, Snotel sites often do not experience the maximum effects of dust-on-snow on snowmelt timing and rates, as compared to generally level, open meadow sites where solar access is unimpeded and snowmelt energy budgets and snowpack ablation are measured. Nonetheless, the Snotel network is the only spatially extensive system monitoring snowmelt throughout the Colorado mountains and year-to-year comparisons of Snotel melt rate data may yield insights into dust effects on local watershed-scale processes.
During WY 2012, three fall and early winter dust storms were observed low in the snowpack at Senator Beck Basin, but none of these layers was discernible in the Park Cone snowpack. And, although several dust-on-snow events fell after the date of SAG Park Cone in WY 2012, those later events did nonetheless further reduce snow albedo and enhance snowmelt rates in the remaining snowpack at higher elevations and on shady subalpine aspects in the nearby terrain in the Gunnison River basin.
WY 2012 SWE accumulation and ablation at Park Cone Snotel, with upper and lower quartiles of period of record shown in light grey, middle quartiles in dark grey surrounding median trace for period of record, and mean trace for 1971-2000 period.
Because of the comparatively early date of WY 2012 peak SWE at Park Cone Snotel, on March 27th, and the comparatively weak dust loading and albedo reductions there last season, spring 2012 produced a much different descending limb in the SWE plot than the single, very steep plunge following the second peak SWE in 2011. In 2012, snowpack ablation gradually accelerated in late March and early April until a small rebound from new snow in mid-month. Melt rates then sharply accelerated as dust event D8 emerged and merged with underlying dust. Overall, as seen in the table above, Spring 2012 produced the lowest value and earliest date of Peak SWE in the past seven years. Further, this prolonged snowmelt period required more days (37) to fully ablate the snowpack than were required to melt the much larger snowpack the year before (33 days). Since 2006, WY 2012 experienced the lowest rate of daily SWE loss (0.23” per day) for the full snowmelt period whereas 2011 melt rates were among the highest at Park Cone. The entire WY 2012 snowmelt cycle remained within the historic range of snowmelt timing in the Park Cone period of record. On the southern edge of the Gunnison Basin, the Slumgullion Pass Snotel (also heavily shaded by adjoining forest) also experienced the full snowmelt cycle within the lower quartile of the period of record.
This was not the case at the Schofield Pass Snotel, where peak SWE on March 24th, 2012 matched the lowest value of SWE in the entire period of record for that day (see Schofield melt rate table). Schofield remained outside the historic range of SWE values for the remainder of the snowmelt cycle to SAG on May 10th. The Schofield Pass Snotel site is less shaded than most Snotel sites, affording better solar access to the snowpack over the snow pillow. Dust effects on snowmelt rates at this Snotel more closely resemble those in a level, open meadow.Stream Flows
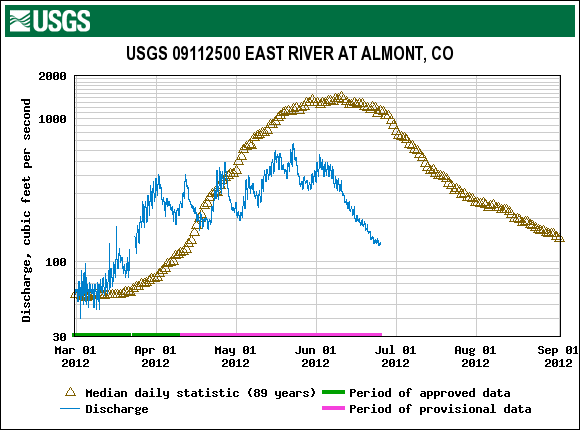
WY 2012 USGS East River at Almont Stream Gauge data for a 289 sq. mi. drainage area in the upper East River watershed, above 8,006’. Current year and historic data reflect diversions for 7,400 of irrigation upstream.
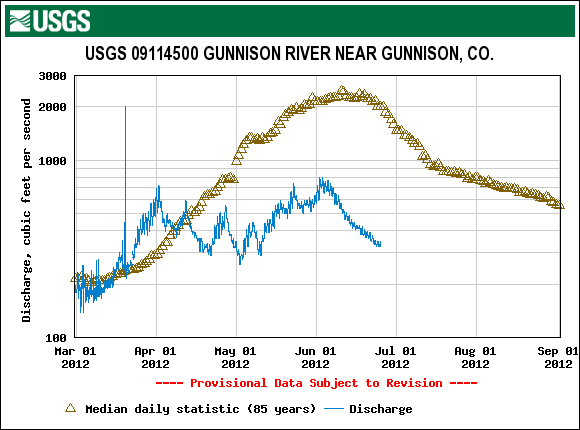
WY 2012 USGS Gunnison River near Gunnison Stream Gauge data for a 1,012 sq. mi. drainage area in the upper Gunnison River watershed, above 7,655’. Current year and historic data reflect regulated flows from Taylor Park Reservoir and diversions for ~22,000 of irrigation upstream of the gauge.
Streamflow data from the USGS East River at Almont and Gunnison River near Gunnison gauges reflect an early and severely reduced snowmelt runoff in WY 2012. Enhanced by unseasonably warm and dry weather and comparatively minor but nonetheless effective reductions in snow albedo from dust in March and throughout April, streamflows surged to several times average discharge levels for late March until intersecting with median levels in mid-April and then falling and remaining well below median rates for the duration. Both gauges recorded peak flows well in advance of normal peak date and more than 50% below normal discharge values. Steep declines in discharge then followed in early June and fell to levels normally seen by September 1st.

WY 2012 USGS Lake Fork at Gateway stream gauge data for a 334 sq. mi. drainage area in the Lake Fork of the Gunnison watershed, above 7,828’. Current year and historic data reflect diversions for 1,600 of irrigation upstream of the gauge.
Overall, these East River and Gunnison River hydrographs present large advances in the timing of WY 2012 runoff at both locations, with the center of their substantially reduced runoff mass occurring several weeks earlier than normal. In addition to the very warm temperatures associated with prolonged periods of dry and sunny weather, dust-on-snow was also factor in these runoff patterns, hastening the “ripening” of the snowpack in March, to isothermal, and then absorbing and adding additional solar energy to the snowmelt energy budget in April and the remainder of the unusually dry spring season.
Farther south, due to the somewhat better snowpack in the northern San Juan Mountains, median or better flows were sustained in the Lake Fork of the Gunnison until peak flow in late May. Dust concentrations in this locale were stronger than those observed in Taylor Park. Eventually, here too, June flows fell rapidly to levels normally expected two months later, at the end of August.