 CODOS Summary for Willow Creek Pass
Summary | Snowpack | Melt Rate | Stream Flows
Summary
Water Years 2011 and 2012 are a case study in interannual variability of Colorado snowpack formation and ablation driven by vastly different late winter and spring weather conditions, perhaps representing seasonal extremes. In dramatic contrast with the unrelenting storms of Mar/Apr/May 2011, extremely dry late-winter and spring weather in 2012 resulted in low values of peak SWE, very early in the spring.
On the other hand, the past two seasons produced comparatively smaller differences in dust-on-snow conditions, with WY 2012 coming close to matching WY 2011 at the Senator Beck Basin Study Area, our baseline monitoring site. Following the extremely early date of peak SWE, on March 8th, mid-March 2012 desert dust concentrations in the Willow Creek Pass locale were similar to those observed at Grizzly Peak and Berthoud Summit and the Willow Creek Pass CODOS site snowpack was isothermal in mid-March. Snowmelt then rapidly accelerated and the CODOS site was “snow all gone” (SAG) before April 10th, our next site visit. Streamflow data from the Willow Creek above Willow Creek Reservoir gauge show high flows when the gauge was activated in early April, peak flow in late April, and a very steep descending limb for what was an apparently compressed runoff cycle.
SnowPack Discussion

SWE accumulation and ablation for Water Years 2011 and 2012, with dust-on-snow events shown, by date, as brown bars for both water years (as observed at the Senator Beck Basin Study Area).
Water Year 2012 snowpack formation at the Willow Creek Pass Snotel site began well. Then, in early December, snowpack accumulation began to lag and by mid-December SWE accumulations had fallen into the lower quartile of SWE values for the period of record where they remained until April (see Snotel projection plot below). Peak SWE occurred very early, on March 8th, at just 7.7”, well short of the 1971-2000 average of 14.3” and seven weeks earlier than the April 27th average date of peak SWE. Peak SWE in 2011 was 27.1” and occurred on May 4th. On/about April 1st SWE values fell below any prior measured values in the period of record for a short period before just returning to the lowest quartile of values.
During WY 2011 eleven dust events occurred at Senator Beck Basin containing a total of 14 grams of dust per square meter. Most of those major dust layers were found in CODOS snow profiles that season at the Willow Creek Pass CODOS site. However, relentless accumulation of late winter and spring snow routinely buried new dust layers and restored high snow albedo values throughout April and May, until the final and perhaps largest event of the season on May 29th.
Last season, during WY 2012, a similar twelve dust events occurred at Senator Beck Basin containing a total of ~10-12 grams of dust per square meter (see Senator Beck Basin Summary – Dust Log discussion). But, in a dramatic switch, late winter and spring 2012 were exceptionally dry, with widely spaced and comparatively small winter storms (see Senator Beck Basin – Winter Storm Log Discussion) leaving dust exposed at the snowpack surface for extended periods, beginning in early March.
In our March 15th snow profile at our Willow Creek Pass CODOS site, we found dust layer D4 at the surface of the shallow, 74 cm (29”) snowpack, in wet melt/freeze polycrystal forms. The snowpack retained virtually no cold content on this date and was effectively isothermal, with a mean snowpack temperature of -0.1° C. This snowpack was extremely weak and our team produced massive snowpack collapses in this open meadow upon approaching the site.
By our next site visit on April 10th, the Willow Creek Pass CODOS site was snow-free. A year earlier, on April 24th, 2011 the snowpack at this site was 126 cm (50”) deep and the Snotel site was still approaching peak SWE.
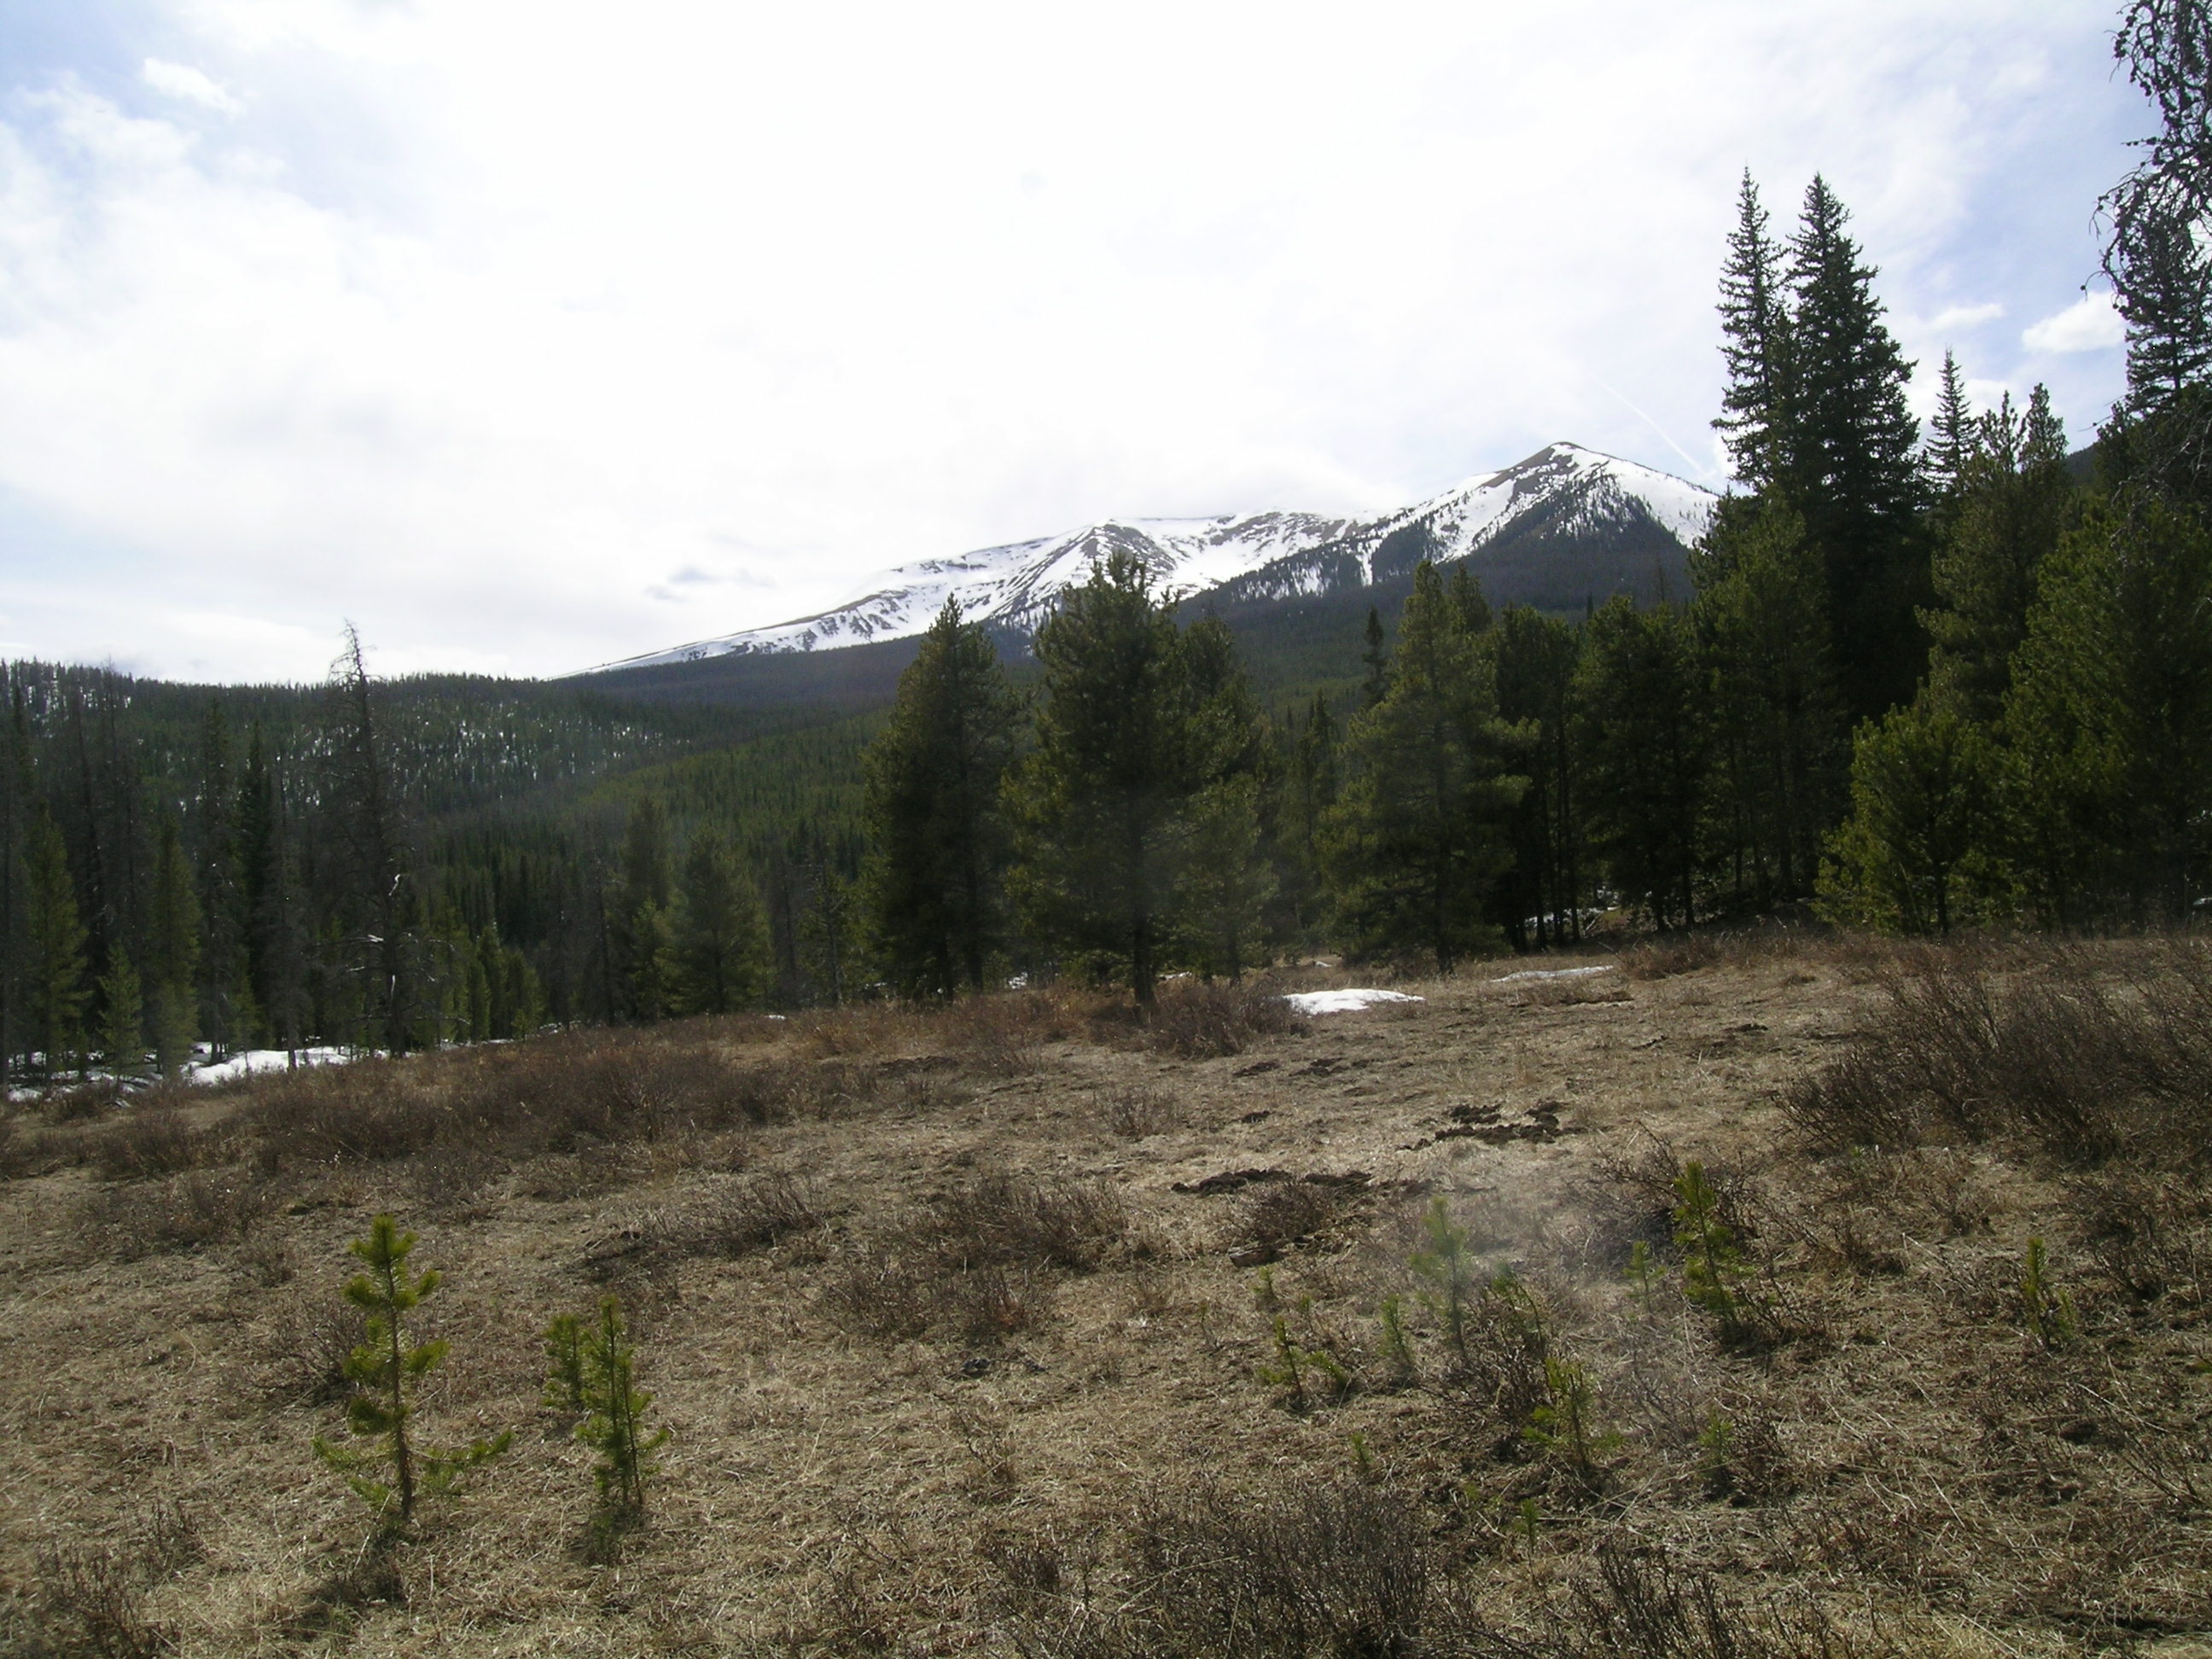
The long-since snow-free Willow Creek Pass CODOS snowpit site on April 9th, 2012 and over a month later in the prior season, on May 17th, 2011, still with an 88 cm (35”) deep snowpack.
Melt Rate
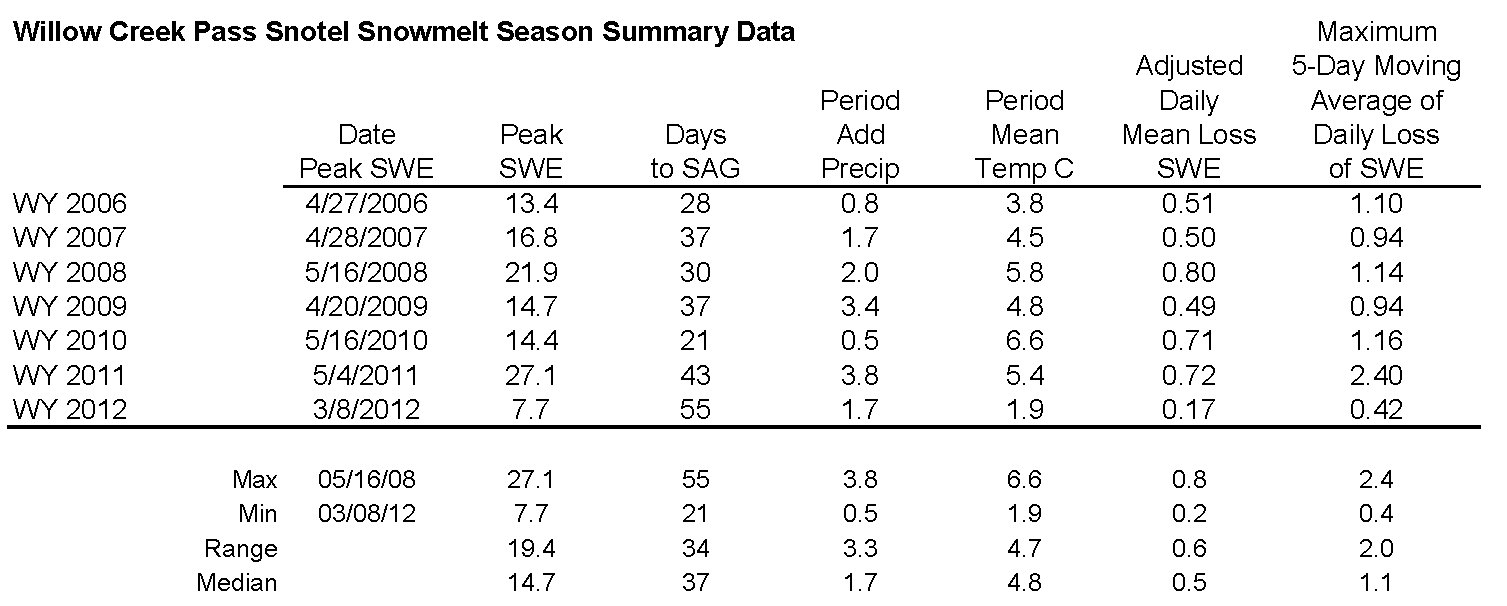
Analysis of Willow Creek Pass Snotel data for 2006-2012 snowmelt seasons showing date and quantity of peak SWE, days from peak SWE to “snow all gone” (SAG), total additional precipitation after date of peak SWE, an “adjusted” mean daily rate of snowmelt adding the additional precipitation to the peak SWE total, the maximum five-day moving average of daily melt, and the mean air temperature over the entire snowmelt period, from peak SWE to SAG.
This discussion references CODOS Snotel site data and analyzes rates of snowmelt from Spring 2006 to the present, spanning the period during which we’ve rigorously observed dust-on-snow at our Senator Beck Basin Study Area, at Red Mountain Pass. Since the Snotel network is the only spatially extensive system continuously monitoring snowmelt throughout the Colorado mountains, year-to-year comparisons of Snotel melt rate data may yield insights into dust effects on local watershed-scale processes that our occasional CODOS snowpit measurements can’t reveal.
However, as we often note, many Snotel sites exhibit a radiative regime where surrounding trees reduce the access of incoming solar radiation to snowpack over the SWE measuring snow pillow, and where re-radiation of long wave energy from that vegetation and reduced skyview may inhibit radiant cooling and extend surface snowmelt during nighttime hours. Although beetle kill has perhaps reduced the surrounding forest’s density since our 2008 photo below, the Willow Creek Pass Snotel site is still shaded by trees to the south and, as a consequence, does not experience the maximum effects of dust reductions in snow albedo, and short-wave radiative forcing, as compared to the adjacent open meadow and our CODOS snowpit site where solar access is comparatively unimpeded. This difference in dominant radiation regimes (long-wave in shady forests versus short-wave in sunny, open terrain) is routinely seen where snow-free open meadows immediately adjoin forest retaining snowpack.
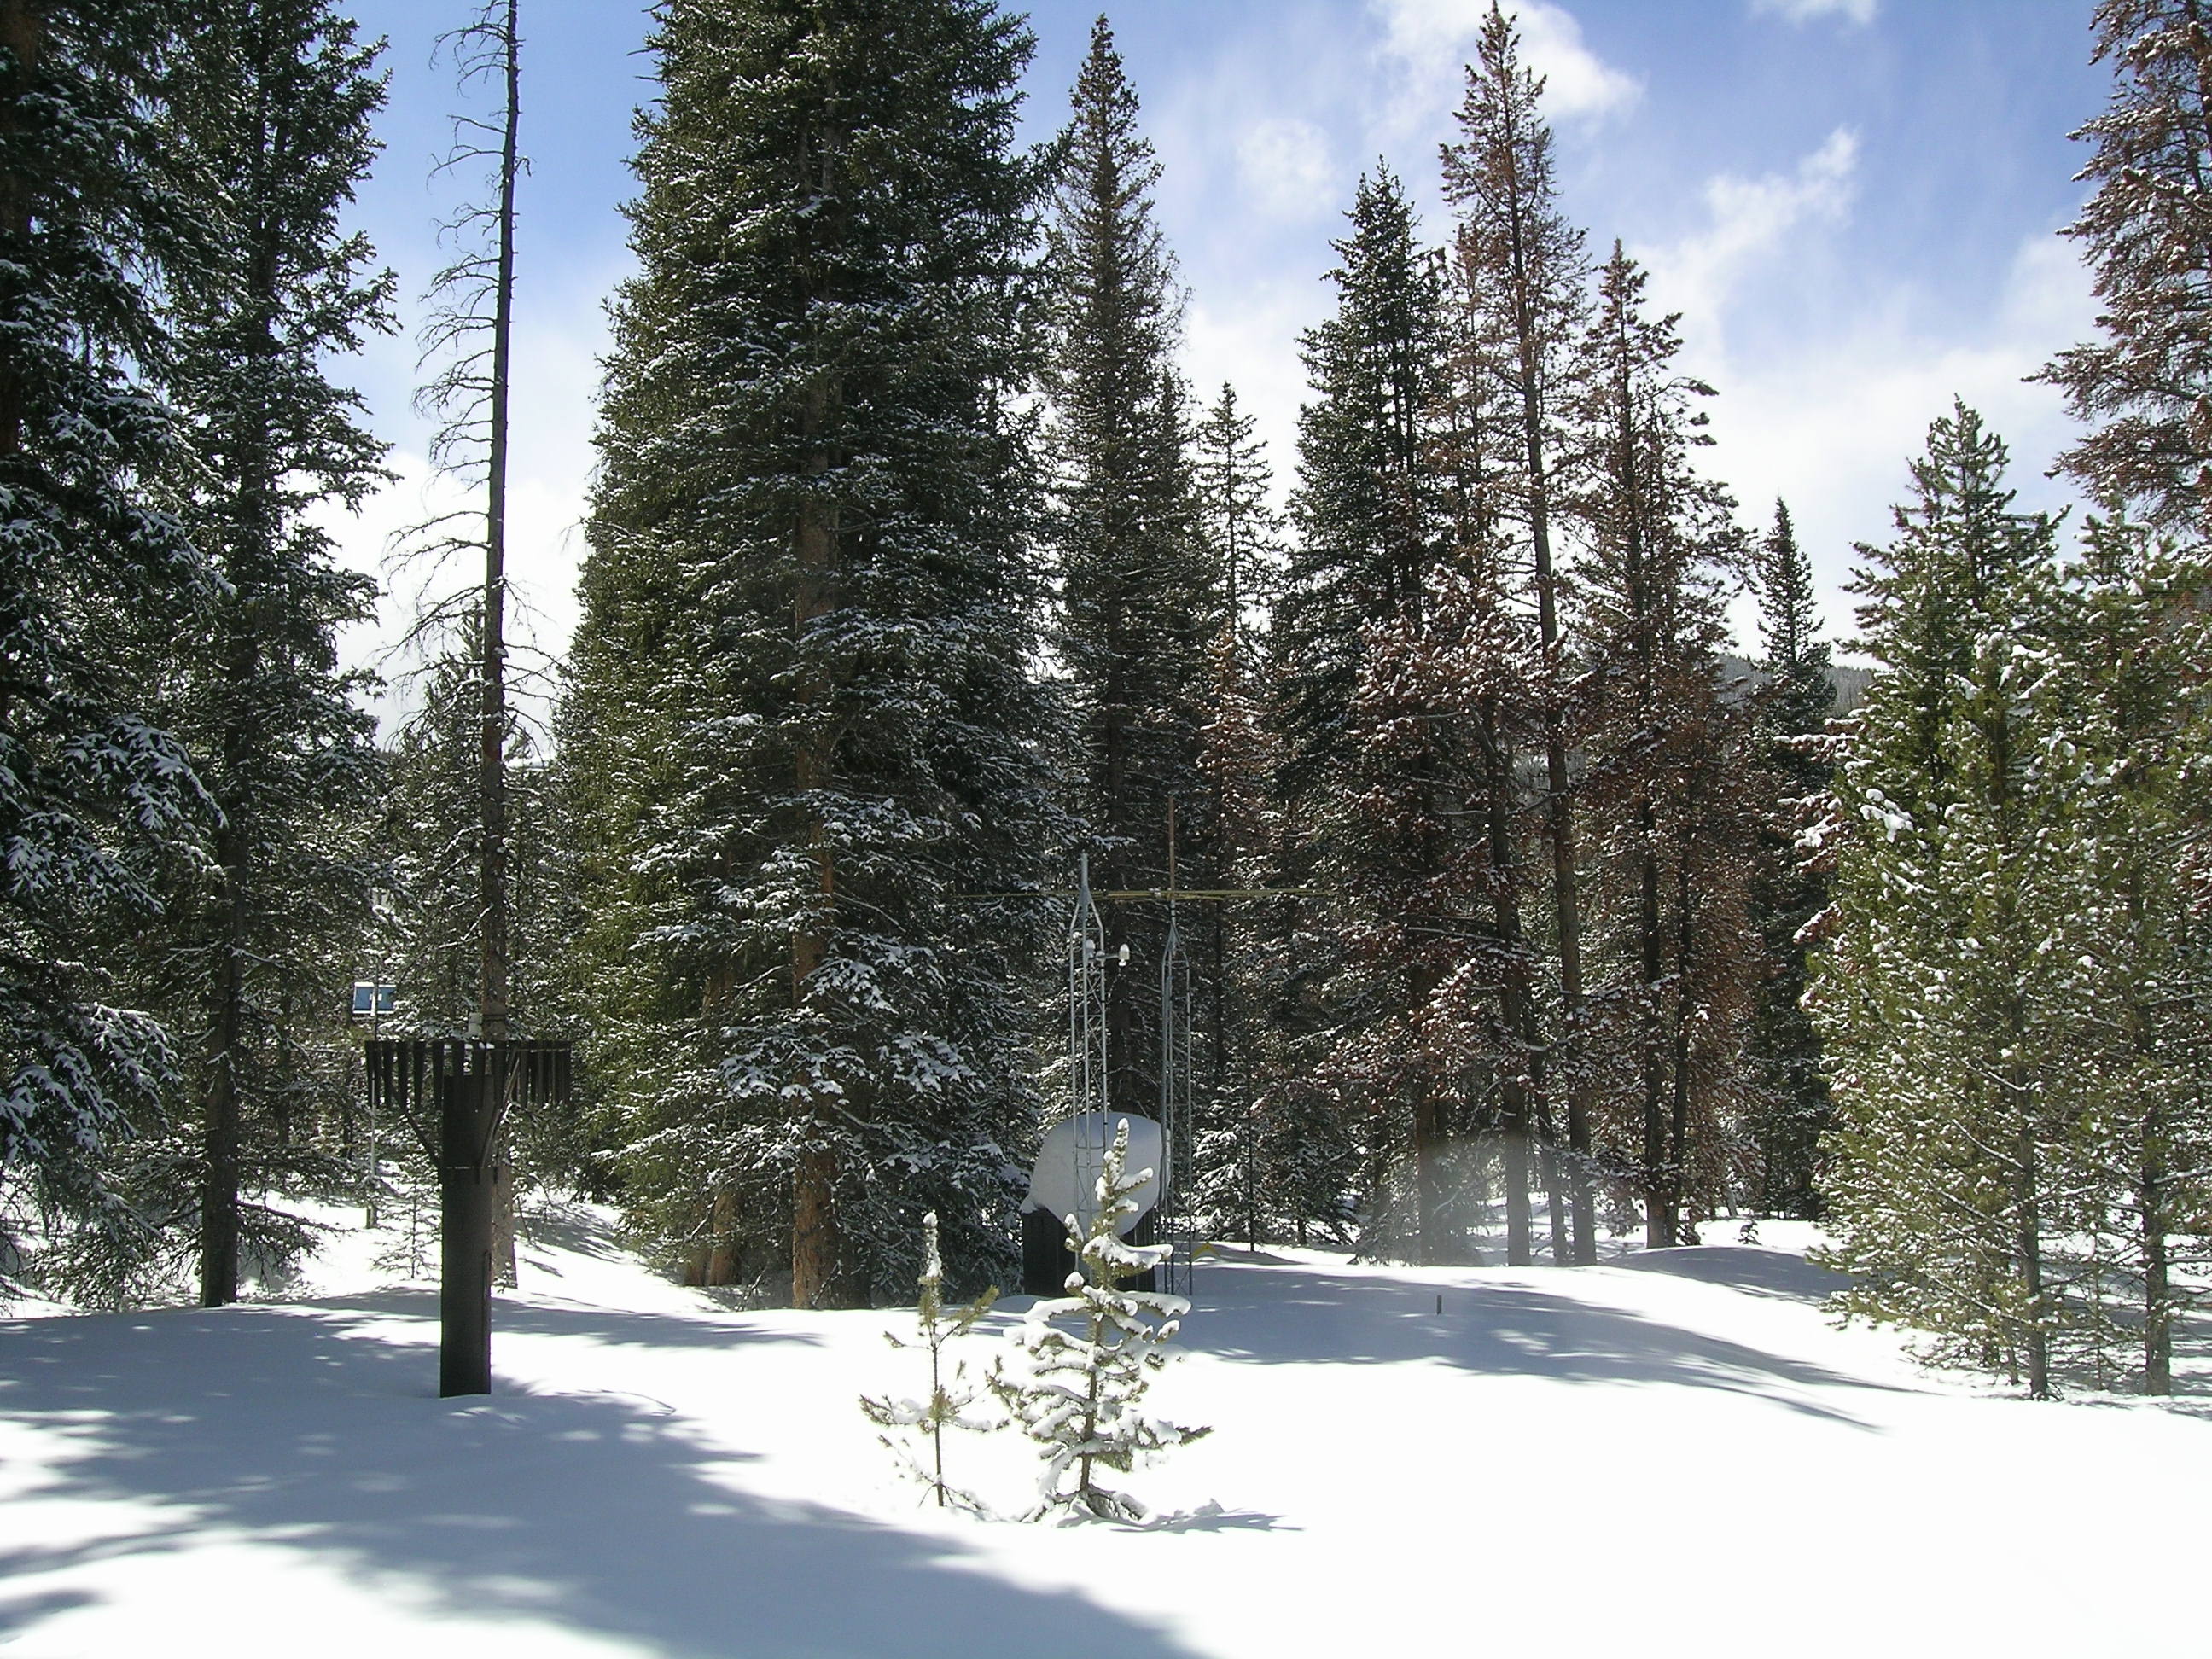
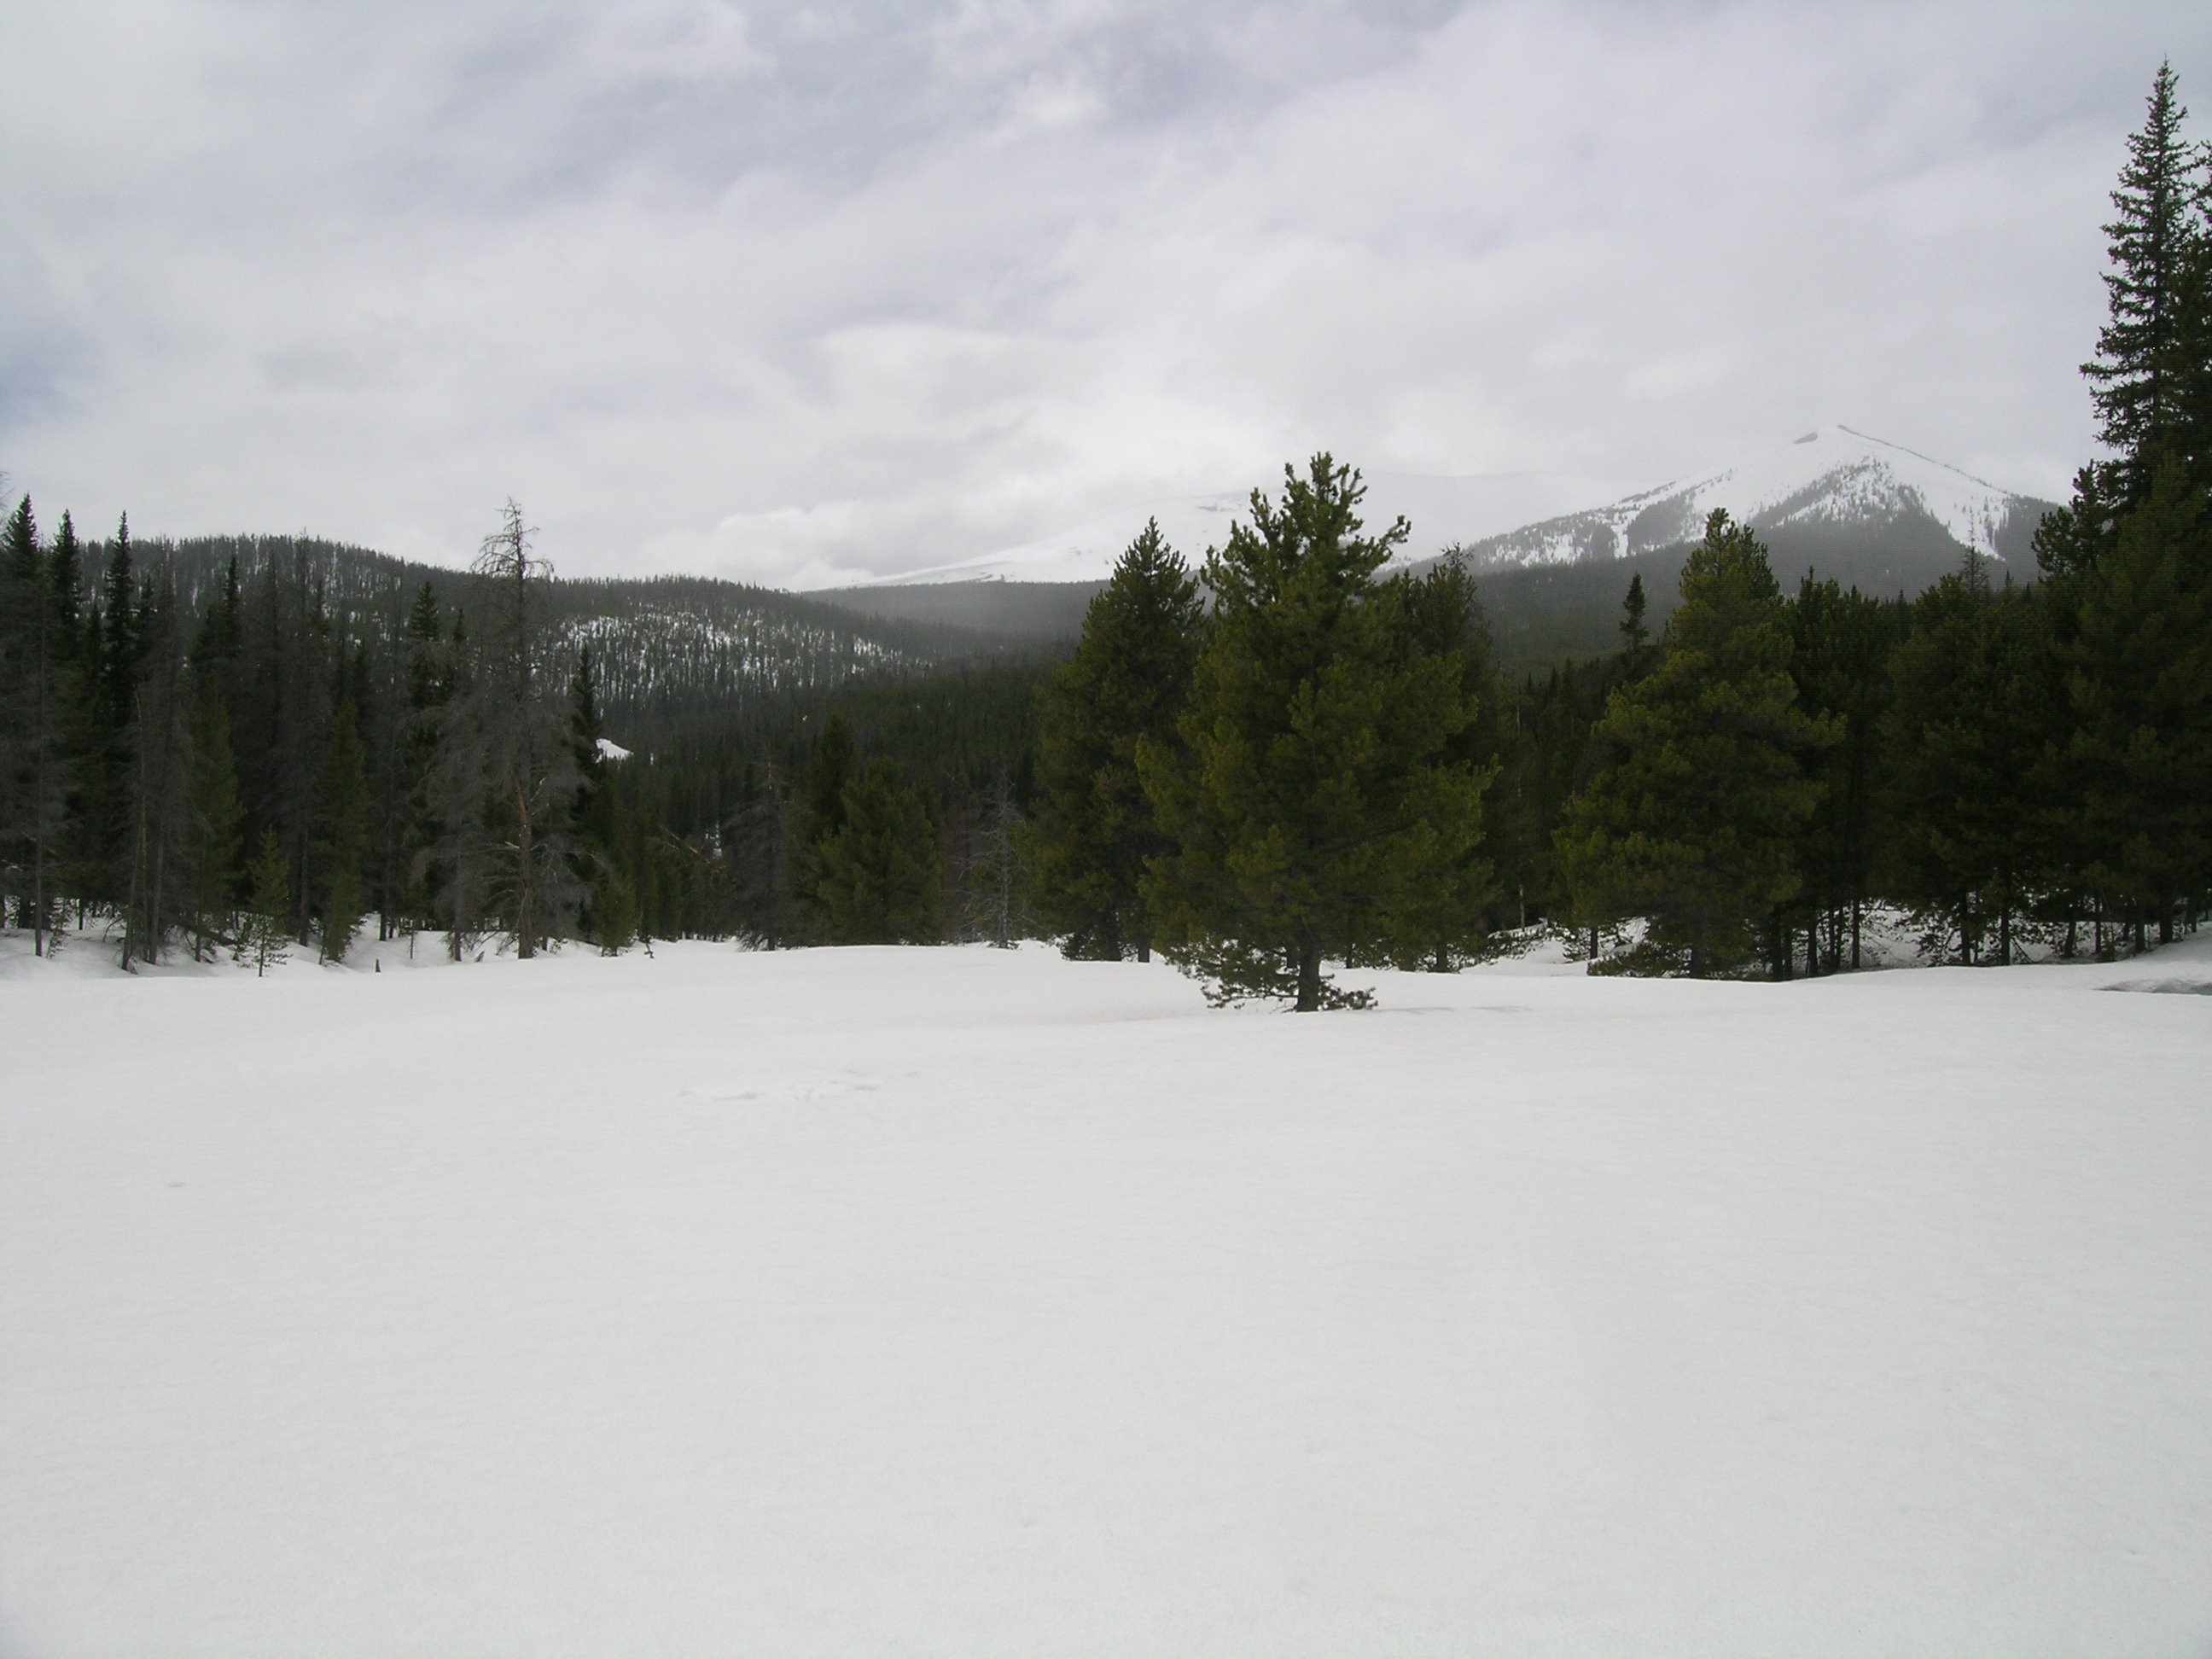
A view of the Willow Creek Pass Snotel site looking south on April 17th, 2008. Although beetle kill may have further reduced the density of this tree cover, some shading of the snow pillow is still reducing the influence of dust on snowmelt rates at this site.
During WY 2012, three fall and early winter dust storms were observed low in the snowpack at Senator Beck Basin, but none of these layers were discernible at Willow Creek Pass in our CODOS snow profiles. And, although dust-on-snow events D8-D12 fell after the date of SAG at our Willow Creek Pass CODOS site in WY 2012, those later events further reduced snow albedo and enhanced snowmelt rates in the remaining snowpack at higher elevations and on shady subalpine aspects in the nearby terrain.
WY 2012 SWE accumulation and ablation at Willow Creek Pass Snotel with upper and lower quartiles of period of record shown in light grey, middle quartiles in dark grey surrounding median trace for period of record, and mean trace for 1971-2000 period.
Because of the early date of WY 2012 peak SWE at Willow Creek Pass Snotel, on March 8th, spring 2012 produced a two-step descending limb in the SWE plot rather than the single, steep plunge following the very delayed peak SWE in 2011. In 2012, snowpack ablation at this Snotel site gradually accelerated in late March and early April until mid-April storms produced a small rebound in SWE. Then, in late April, under the influence of unseasonably warm temperatures and reductions in snow albedo, primarily from dust layer D4, melt rates accelerated a second time, to a much higher rate. Overall, the Willow Creek Pass Snotel site required some 55 days to ablate 9.4” of SWE (including 1.7” of precipitation after peak SWE), averaging just 0.17” of SWE loss per day.
STREAM FLOWS
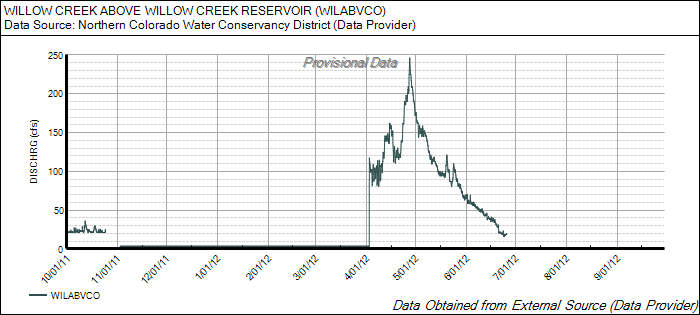
WY 2012 stream gauge data Willow Creek above Willow Creek Reservoir. Data are provided by Northern Water Conservancy District. No additional station information is available and median flow data for the period of record at this gauge are not included in the hydrograph provided.
Given the very dry spring and sub-par snowpacks throughout the Front Range and Northern Colorado mountains, below average snowmelt runoff in those watersheds was unsurprising. Although the Willow Creek hydrograph above does not include historic flow level data, the plot may show evidence of an early start to a high-amplitude but compressed runoff cycle, with substantially above-average flows in April and an early peak in late April. Runoff immediately began a very rapid decline in early May to levels in late June that appear to match late fall 2011 base flows.
In addition to the very warm temperatures associated with prolonged periods of dry and sunny weather in late winter and spring 2012, dust-on-snow event D4 (March 6th) played a role in this apparently early Willow Creek runoff, reducing snow albedo and hastening the ripening of the snowpack in mid-March, to isothermal. Dust then continued absorbing and adding solar energy to the snowmelt energy budget during subsequent periods of exposure at the snowpack surface in early April, up to SAG. Additional dust events later in April and May, particularly D8 on April 6th and D12 on May 26th, further reduced snow albedo in the scant remaining high elevation snowpack in this locale and rapidly drying streams fed by Rabbit Ears Range snowmelt.