 Water Year 2012 CODOS Summary
for Wolf Creek Pass
Summary | Snowpack | Melt Rate | Stream Flows
Summary
Water Years 2011 and 2012 are a case study in interannual variability of Colorado snowpack formation and ablation driven by vastly different late winter and spring weather conditions, perhaps representing seasonal extremes. In dramatic contrast with the endless storms of Mar/Apr/May 2011, extremely dry late-winter and spring weather in 2012 resulted in low values of peak SWE, very early in the spring, in the headwaters of the Rio Grande and San Juan rivers.
On the other hand, the past two seasons produced comparatively smaller differences in dust-on-snow conditions, with WY 2012 coming close to matching WY 2011 at the Senator Beck Basin Study Area, our baseline monitoring site. Spring 2012 snowpack ablation at the CODOS Wolf Creek Pass snowpit site was rapid, enhanced by dust layers D4-D8. By March 17th, dust-on-snow layer D4 was enhancing snowpack warming at the Wolf Creek Pass CODOS snowpit, already near isothermal. In late March both the San Juan and Rio Grande were recording strong surges in streamflows reaching several times their respective average flows for that period. Three weeks later, on April 9th the Wolf Creek Pass site was isothermal and had lost nearly half of its SWE. Despite a sequence of high amplitude runoff surges in both rivers, peak flows fell short of average before steep declines began in late May, reaching very low, late summer flows by the end of June. Overall, WY 2012 snowmelt runoff in both the San Juan and Rio Grande rivers was advanced several weeks ahead of median timing.
SnowPack Discussion
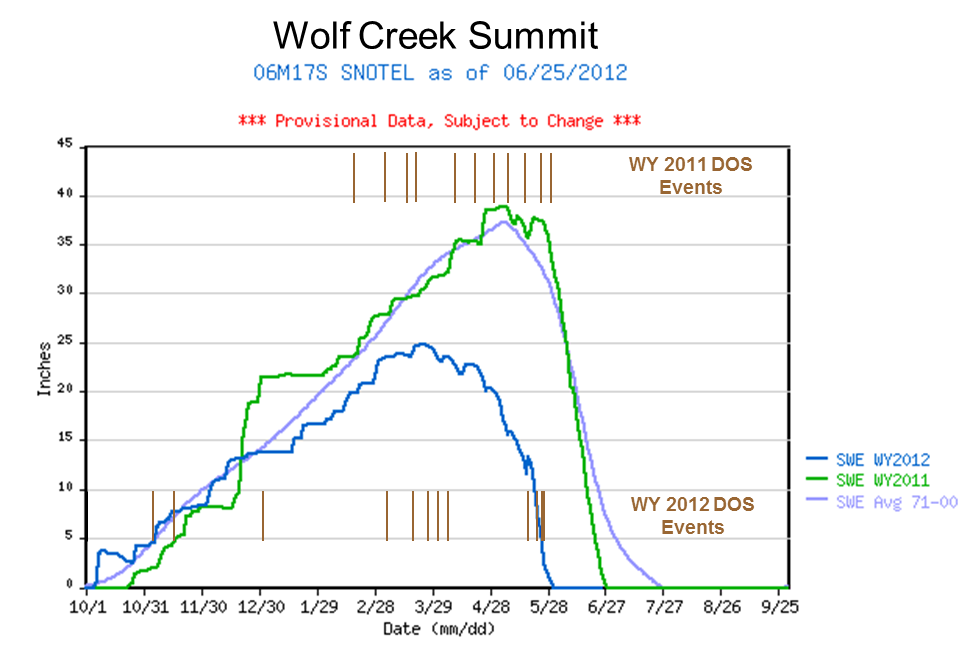
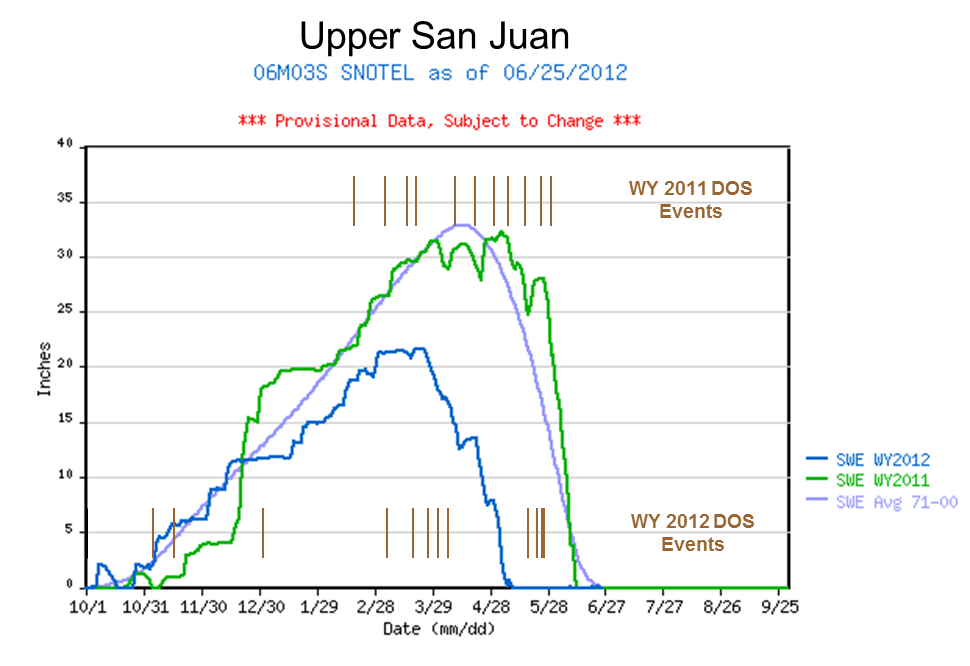
Caption for 2-year Snotel plots: SWE accumulation and ablation for Water Years 2011 and 2012, with dust-on-snow events shown, by date, as brown bars for both water years (as observed at the Senator Beck Basin Study Area). Differences in site characteristics are discussed below (see Melt Rates discussion).
Water Year 2012 snowpack formation at Wolf Creek Pass began very well, with a major October storm enabling the ski area to open immediately thereafter. Then, after remaining near-average through mid-December, snowpack and SWE accumulation at the Wolf Creek Summit and Upper San Juan Snotels stalled in late December, falling to and then remaining somewhat below average until early March, in the second quartile of SWE values for their periods of record (see Snotel projection plot below).
Due to the very dry late-winter and spring experienced throughout Colorado, WY 2012 peak SWE at Wolf Creek Summit was only 24.8”, well short of the 1971-2000 average of 37.2” and the 38.9” peak of 2011. Peak SWE 2012 also occurred early in the season, on March 25th, a full six weeks earlier than the 1971-2000 average of May 5th and the day of Peak SWE 2011. Just a few miles west and 800’ lower in elevation, the Upper San Juan Snotel recorded a lower WY 2012 peak SWE of 21.7” on March 23rd, also short of the mean of 32.9” and three weeks ahead of the average date of April 13th.
Peak SWE at both Wolf Creek Summit and Upper San Juan Snotels occurred on the boundary between the second and lower quartiles of the period of record and thereafter remained in the lower quartile to “snow all gone” SAG, at both sites.
During WY 2011 eleven dust events occurred at Senator Beck Basin containing a total of 14 grams of dust per square meter. Most or all of those events were found in CODOS snow profiles in the Wolf Creek Pass snowpack. However, relentless accumulation of late winter and spring snow routinely buried new dust layers and restored high snow albedo values throughout the State, throughout April and May.
Last season, during WY 2012 a similar twelve dust events occurred at Senator Beck Basin containing a total of ~10-12 grams of dust per square meter (see Senator Beck Basin Summary – Dust Log discussion). But, in a dramatic switch, late winter and spring 2012 were exceptionally dry, with widely spaced and comparatively small winter storms (see Senator Beck Basin – Winter Storm Log Discussion). WY 2012 dust layers and reductions in snow albedo in the Rio Grande watershed were similar to those observed in the Senator Beck Basin Study Area
In our March 17th snow profile at our Wolf Creek Pass CODOS site, we found dust event D4 at the snowpack surface where it had been reducing snow albedo and generating surface melt for some time, producing a thick layer of melt/freeze polycrystals at the snowpack surface. The snowpack contained 556 mm (21.9”) of SWE but retained very little cold content by this date, with a mean snowpack temperature of -0.7° C.
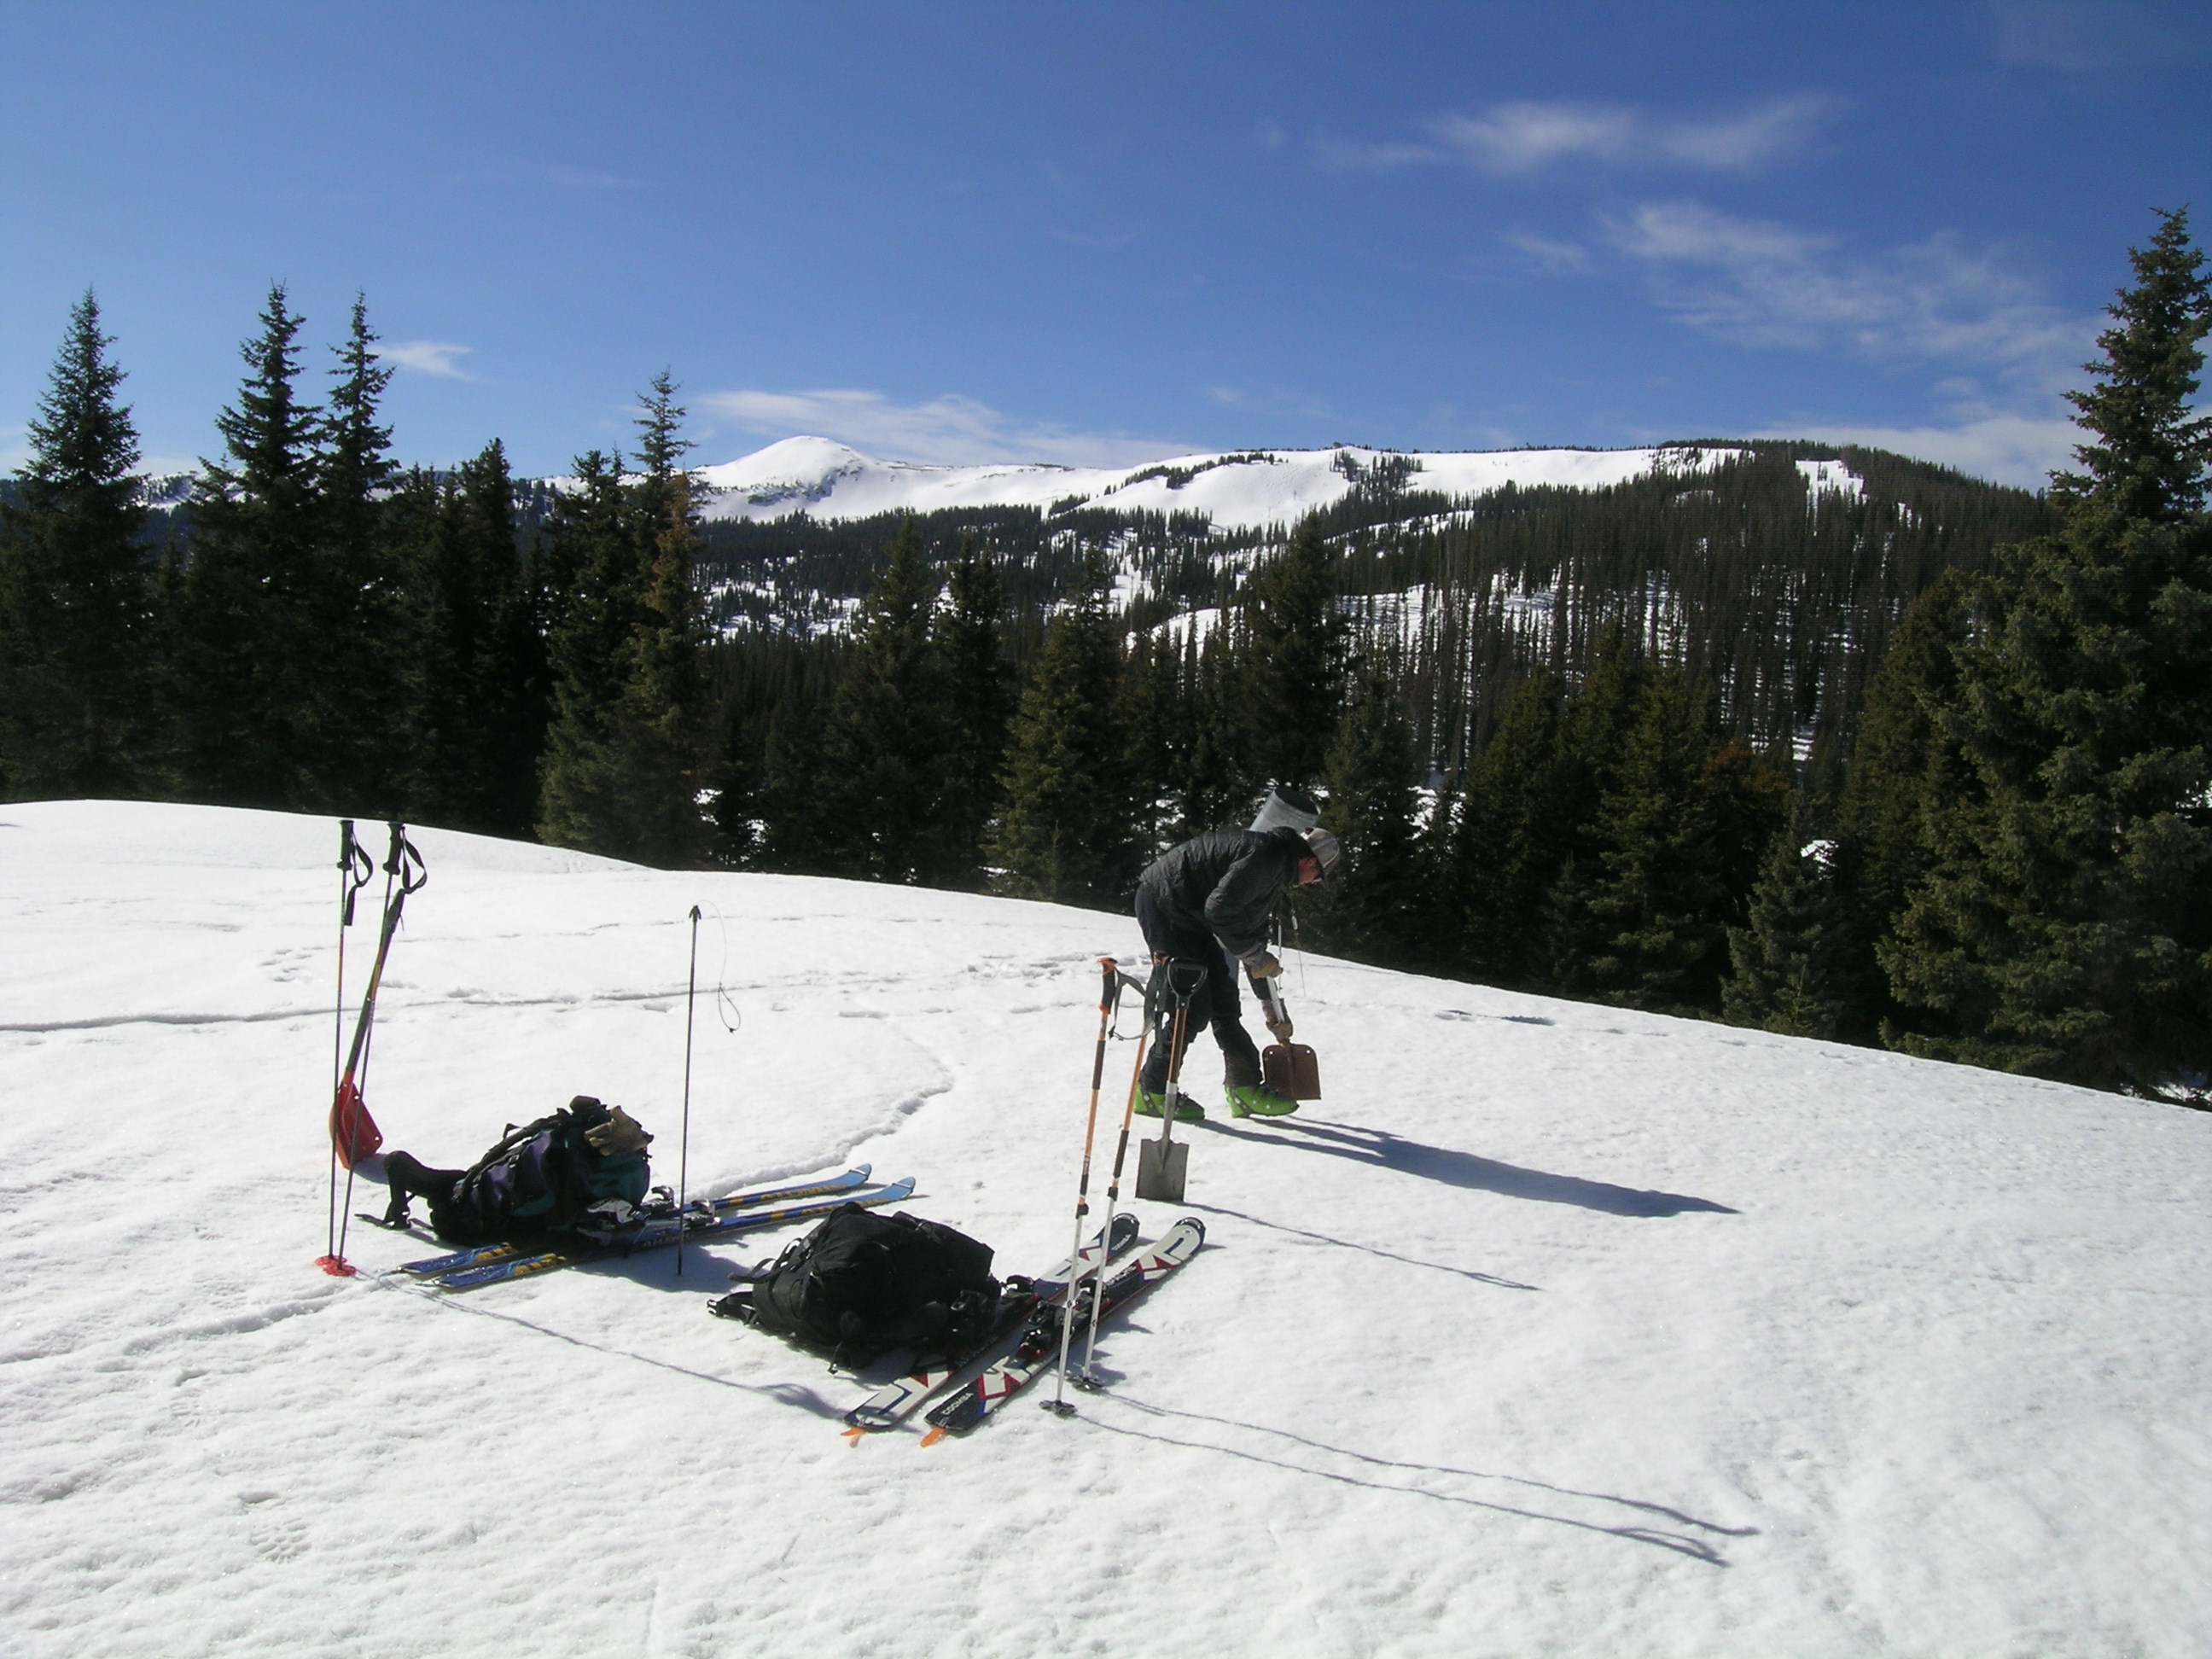
CSAS field assistant Andrew Temple beginning the 63” deep snowpit at the Wolf Creek Pass CODOS site on March 17th, 2012. Wolf Creek ski are is seen in the distance.
The Wolf Creek Pass CODOS snowpit site approaching SAG on May 1, 2012, with dust layers D3-8 merged at the snowpack surface.
By our return on April 9th, the Wolf Creek Pass CODOS site retained only 320 mm (12.6”) of SWE, having lost 9.3” in 23 days, and was fully isothermal. Dust layers D4-8 had merged at the snowpack surface reducing snow albedo to levels comparable to those observed at Senator Beck Basin the day before, and additional layers of dust would soon merge and further reduce albedo, as seen during the May 1st site visit, on the verge of SAG.
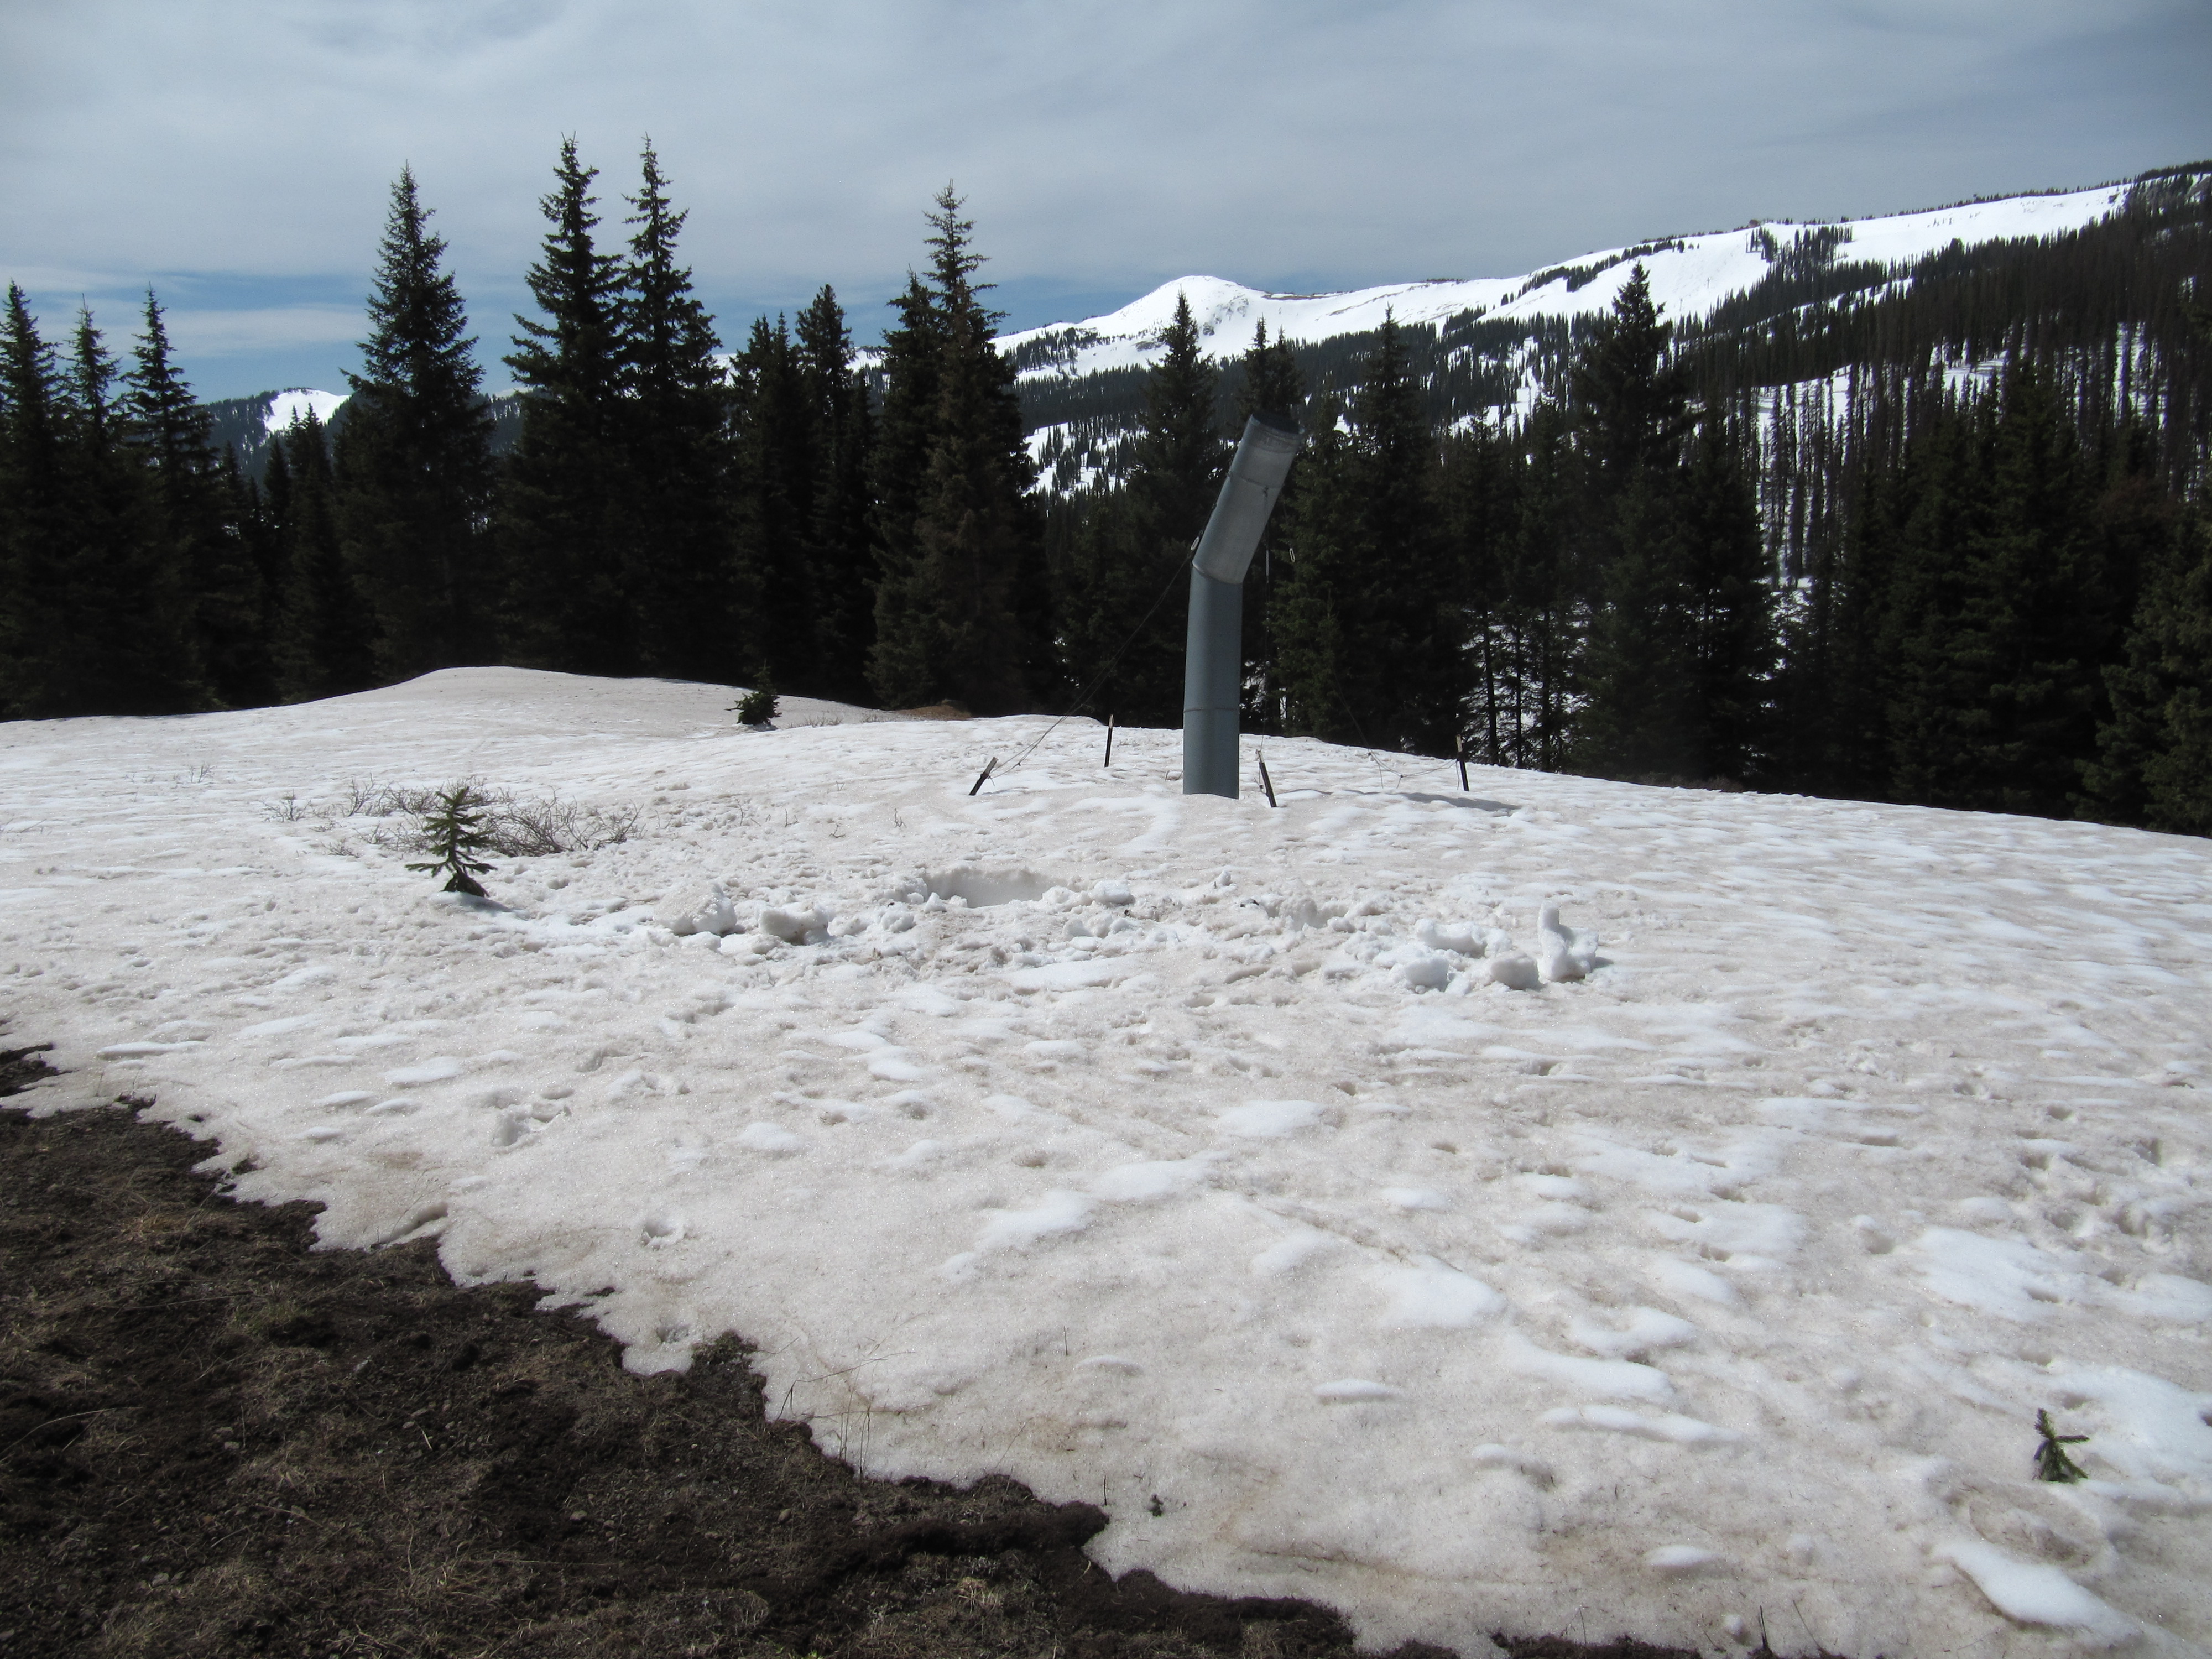
Although the Wolf Creek Summit Snotel site retained 19.8” of SWE contained in 48” of snow on May 1, the downvalley Upper San Juan Snotel, a few miles west and 800’ lower than the Wolf Creek Summit site, had just 7.1” of SWE. The Wolf Creek Summit Snotel site is in dense forest whereas the Upper San Juan site has a few scattered trees, only on its northern flank, leaving the snowpack on the Snotel pillow open to sunlight on the east, south, and west.
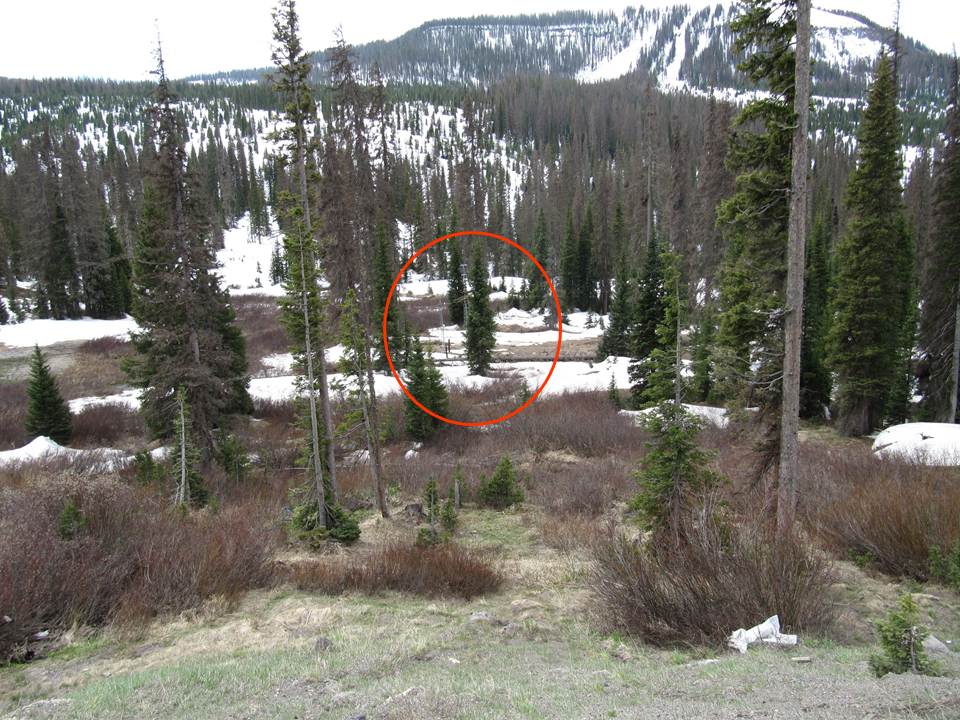
The Upper San Juan Snotel site on May 1, 2012 looking south from the Highway 160 shoulder. The Snotel station is circled. This open site experiences direct solar inputs comparable to our CODOS snowpit site at Wolf Creek Pass.
Melt Rate
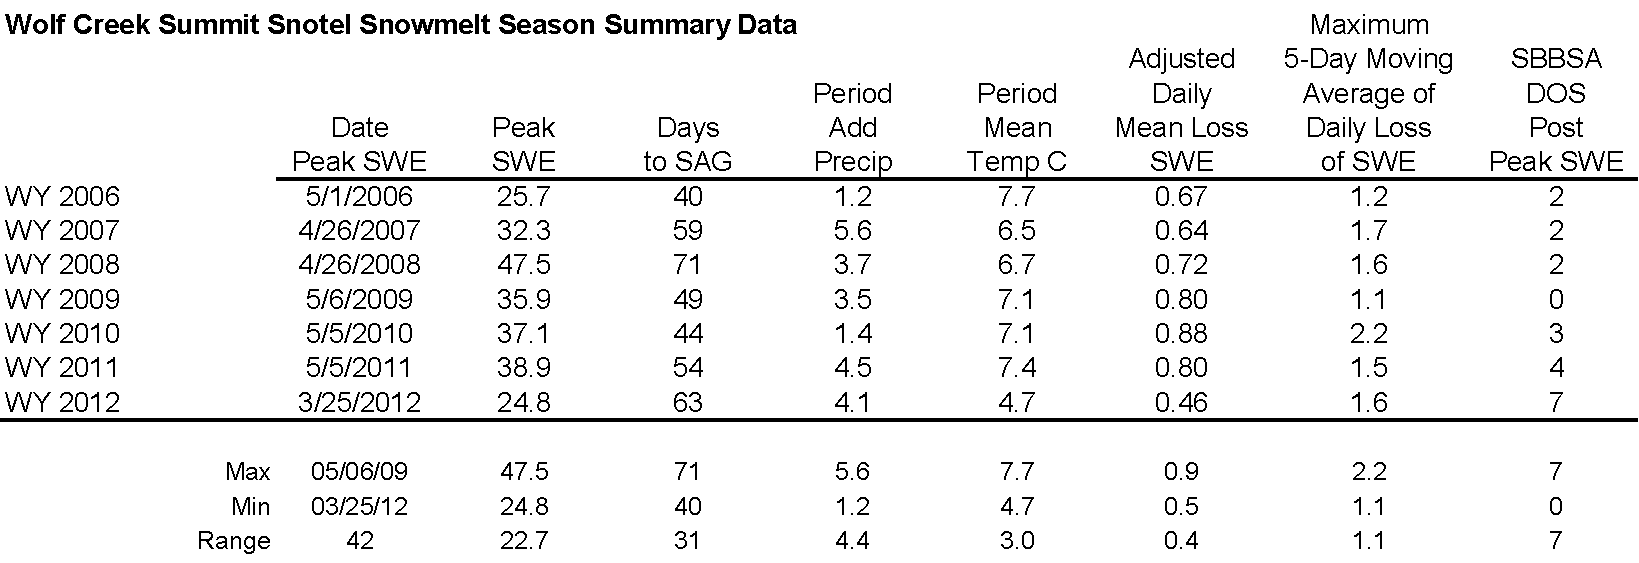
Analysis of Wolf Creek Summit Snotel data for 2006-2012 snowmelt seasons showing date and quantity of peak SWE, days from peak SWE to “snow all gone” (SAG), total additional precipitation after date of peak SWE, an “adjusted” mean daily rate of snowmelt adding the additional precipitation to the peak SWE total, the maximum five-day moving average of daily melt, and the mean air temperature over the entire snowmelt period, from peak SWE to SAG.
This discussion references CODOS Snotel site data and analyzes rates of snowmelt from Spring 2006 to the present, spanning the period during which we’ve rigorously observed dust-on-snow at our Senator Beck Basin Study Area, at Red Mountain Pass. Since the Snotel network is the only spatially extensive system continuously monitoring snowmelt throughout the Colorado mountains, year-to-year comparisons of Snotel melt rate data may yield insights into dust effects on local watershed-scale processes that our occasional CODOS snowpit measurements can’t reveal.
However, as we often note, many Snotel sites exhibit a radiative regime where surrounding trees reduce the access of incoming solar radiation to snowpack over the SWE measuring snow pillow, and where re-radiation of long wave energy from that vegetation and reduced skyview may inhibit radiant cooling and extend surface snowmelt during nighttime hours. The Wolf Creek Summit Snotel site exhibits these attributes and, as a consequence, does not experience the maximum effects of dust reductions in snow albedo, and short-wave radiative forcing, as compared to open meadow sites where solar access is unimpeded and snowmelt and snowpack ablation are measured (e.g., Swamp Angel Study Plot). This difference in dominant radiation regimes (long-wave in shady forests versus short-wave in sunny, open terrain) is routinely seen where snow-free open meadows immediately adjoin forest retaining substantial snowpack.
In contrast to Wolf Creek Summit, the very nearby Upper San Juan Snotel (see photo above) does experience comparatively unimpeded solar access to the east, south, and north, with only scattered trees on its northern flank. The Upper San Juan site is close enough to U.S. Hwy 160 to perhaps experience road dust deposition on occasion. Despite that potential complication, the Upper San Juan site may better capture the radiative impact of desert dust deposition on snowmelt timing and rates in the Wolf Creek Pass locale than the Wolf Creek Summit Snotel site. Hence, both sites are evaluated below.
During WY 2012, three fall and early winter dust storms were observed low in the snowpack at Senator Beck Basin, and some of these layers were discernible at Wolf Creek Pass in our CODOS snow profiles. And, although dust-on-snow events D9-D12 fell after the date of SAG at our Wolf Creek Pass CODOS site in WY 2012, those later events further reduced snow albedo and enhanced snowmelt rates in the remaining snowpack at higher elevations and on shady subalpine aspects in the nearby terrain in the upper Rio Grande and San Juan river basins.
WY 2012 SWE accumulation and ablation at Wolf Creek Summit Snotel and Upper San Juan Snotel, with upper and lower quartiles of period of record shown in light grey, middle quartiles in dark grey surrounding median trace for period of record, and mean trace for 1971-2000 period.
Because of the early date of WY 2012 peak SWE at Wolf Creek Summit Snotel, on March 25th, spring 2012 produced a two-step descending limb in the SWE plot rather than the single, very steep plunge following the very delayed peak SWE in 2011. In 2012, snowpack ablation at Wolf Creek Summit Snotel progressed in fits and starts during April, then accelerated to a higher rate of melt to SAG. Overall, Wolf Creek Summit took 63 days to ablate 28.9” of SWE (including 4.1” of precipitation after peak SWE), averaging 0.46” of SWE loss per day.
In contrast, melt rates immediately accelerated after peak SWE at the Upper San Juan Snotel with D4 at the snowpack surface. Dust event D8 fell onto already merged layers D4-7 on April 6th, slighly accelerating melt rates until a mid-April storm that restored some SWE and higher snow albedo to the snowpack. Merged dust layers D4-9 quickly re-emerged, dropping albedo and, in tandem with unseasonably warm weather, accelerating melt rates even farther for the duration of snowpack. The entire melt cycle at Upper San Juan, from peak SWE on March 24th to SAG on May 10th, took 47 days to ablate 25.5” of SWE (including 3.8” of precipitation following peak SWE), averaging 0.54” of SWE loss per day, a 17% higher rate than at Wolf Creek Summit. SAG at Upper San Juan was on May 10th, 17 days earlier than SAG at Wolf Creek Summit, on May 27th.
At the north edge of the Rio Grande watershed, the Slumgullion Pass Snotel (heavily shaded) also produced the slowest melt rate (0.33”/day) and lowest value and earliest date of Peak SWE in the past seven years at that site. In the Rio Grande headwaters, Beartown Snotel (only partially shaded) immediately attained and sustained, apart from a mid-April storm rebound, a higher snowmelt rate following peak SWE in late March, averaging 0.50” of SWE loss per day, still the lowest melt rate, from the earliest date of peak SWE at that site since 2006.
Stream Flows
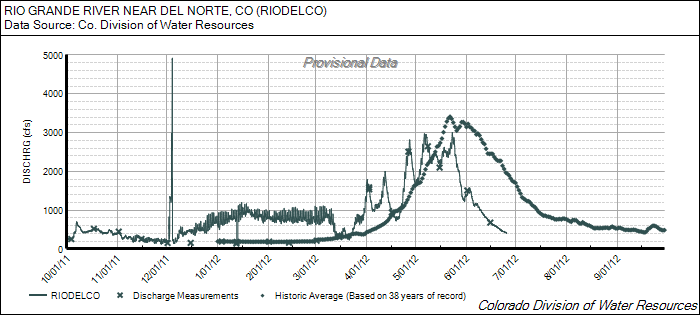
WY 2012 Rio Grande River near Del Norte Stream Gauge data for a 1,320 sq. mi. drainage area in the upper Rio Grande River watershed, above 7,980’.
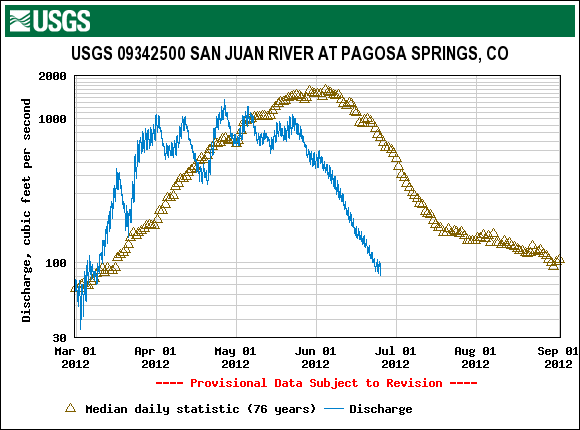
WY 2012 USGS San Juan River at Pagosa Springs Stream Gauge data for a 281 sq. mi. drainage area in the upper San Juan River watershed, above 7,048’.
Both the above San Juan and Rio Grande River hydrographs present an early and erratic ascending limb of snowmelt runoff, with very similar numbers and timing of surges, followed by rapid descending limbs. Unseasonably warm and dry weather combined with gradually increasing reductions in snow albedo by dust in March and April produced streamflows surging to several times average discharge levels in late March, April and early May, and retreating to average flow levels between surges. Peak flow on the San Juan occurred over a month earlier than the median date whereas the Rio Grande saw nearly identical peaks bracketing a near-normal date of peak flow. That decline in flows between the two peaks on the Rio Grande may be explained by an upslope precipitation event originating in eastern Colorado delivering over an inch of precipitation as far west as Wolf Creek Summit, restoring a higher snow albedo to at least the eastern portion of the remaining snowpack in that watershed. By late May, steep declines in discharge had begun in both watersheds and resulted in flows on July 1st that are not normally seen until September.
Given the very dry spring and below-average snowpacks throughout the San Juan Mountains, below average snowmelt runoff yields in both watersheds are unsurprising. However, both the Rio Grande and San Juan river hydrographs document substantial advances in the timing of WY 2012 runoff, with the center of their respective runoff masses occurring several weeks earlier than normal. In addition to the very warm temperatures associated with prolonged periods of dry and sunny weather, dust-on-snow was also factor in this early and highly erratic runoff, hastening the “ripening” of the snowpack in March, to isothermal, and then absorbing and adding additional solar energy to the snowmelt energy budget throughout the remainder of the snowmelt season.