 2012 CODOS Summary

Water Years 2011 and 2012 have provided a case study in interannual variability of Colorado snowpack formation and ablation. Although both winters were under La Niña influence, dramatically different late-winter and spring conditions produced diametrically opposing snowmelt scenarios, perhaps representing seasonal extremes. Unrelenting storms in Mar/Apr/May 2011 produced very large or record snowpacks and very late dates of peak SWE. Snowmelt began late but, enhanced by early June temperatures and considerable dust-in-snow, rapidly attained and sustained high rates and record or near-record streamflows ensued.
In sharp contrast, extremely dry Mar/Apr/May weather in 2012 resulted in low or very low values of peak SWE, very early in the spring. Prolonged periods of dust-on-snow exposure at the snowpack surface, along with dry, sunny, and sometimes unseasonably warm weather beginning in early March, enabled snowpack ablation to begin early. Snowmelt proceeded in a notably synchronized pattern throughout the Colorado mountains, with early and high initial levels of runoff in March and early April, to sub-par peak discharge levels, followed by very steep declines in runoff to extremely low flows in late June.
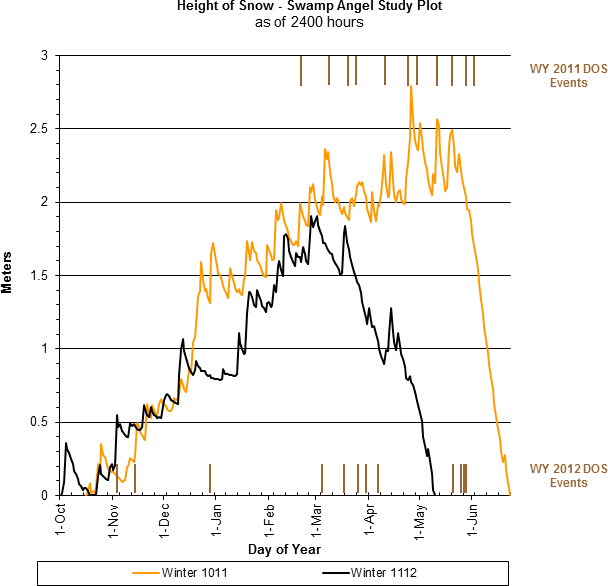
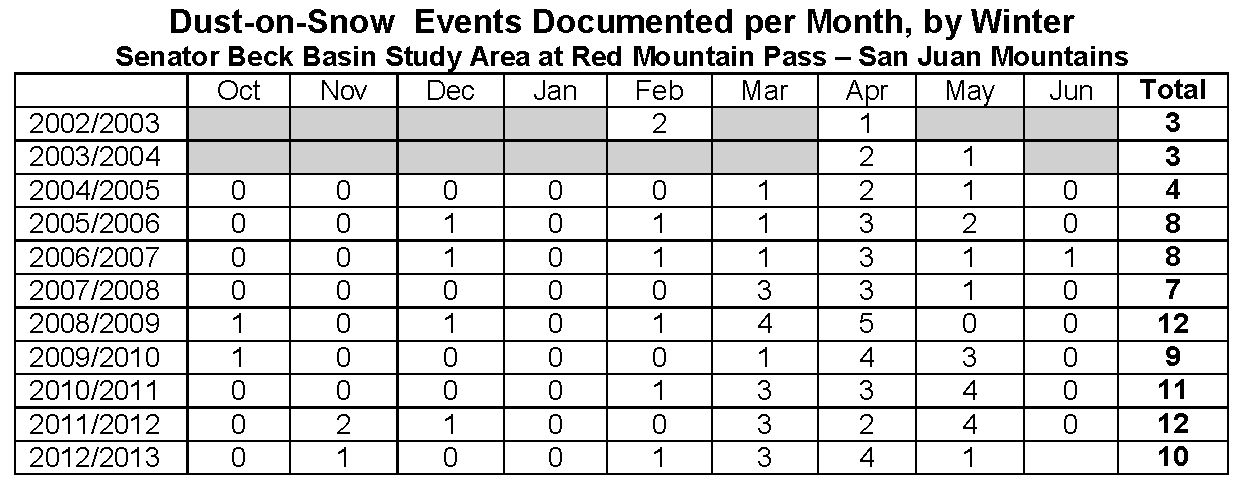
Despite vastly different Mar/Apr/May precipitation regimes, Water Years 2011 and 2012 produced much smaller differences in spring dust-on-snow conditions, with WY 2012 coming close to matching WY2011 at the Senator Beck Basin Study Area, our baseline monitoring site. We observed 12 dust-on-snow events in WY 2012 at our Swamp Angel Study Plot, compared to 11 events in WY 2011 (see graph above showing dust events for past two years as brown bars), but the total mass of dust deposited was somewhat lower in 2012 than in 2011. Given the very early ablation of snowcover statewide, several dust events in May 2012 may have fallen without effect onto mostly bare ground, rather than snow, as was the case at SASP. However, even the final event, D12 on May 26th, found some lingering alpine snow cover and further reduced snow albedo, in Senator Beck Basin and elsewhere in the state.
2010/2011 (WY 2011): Feb 19, Mar 6, Mar 17, Mar 21, April 8, April 21, April 29, May 9, May 18, May 26, May 29
2011/2012 (WY2012): Nov 5, Nov 13, Dec 31, Mar 6, Mar 18, Mar 26, Apr 1, Apr 6, May 18, May 23, May 25, May 26
See the complete CODOS dust log for dust-on-snow dates during other years and links to windroses for each event.
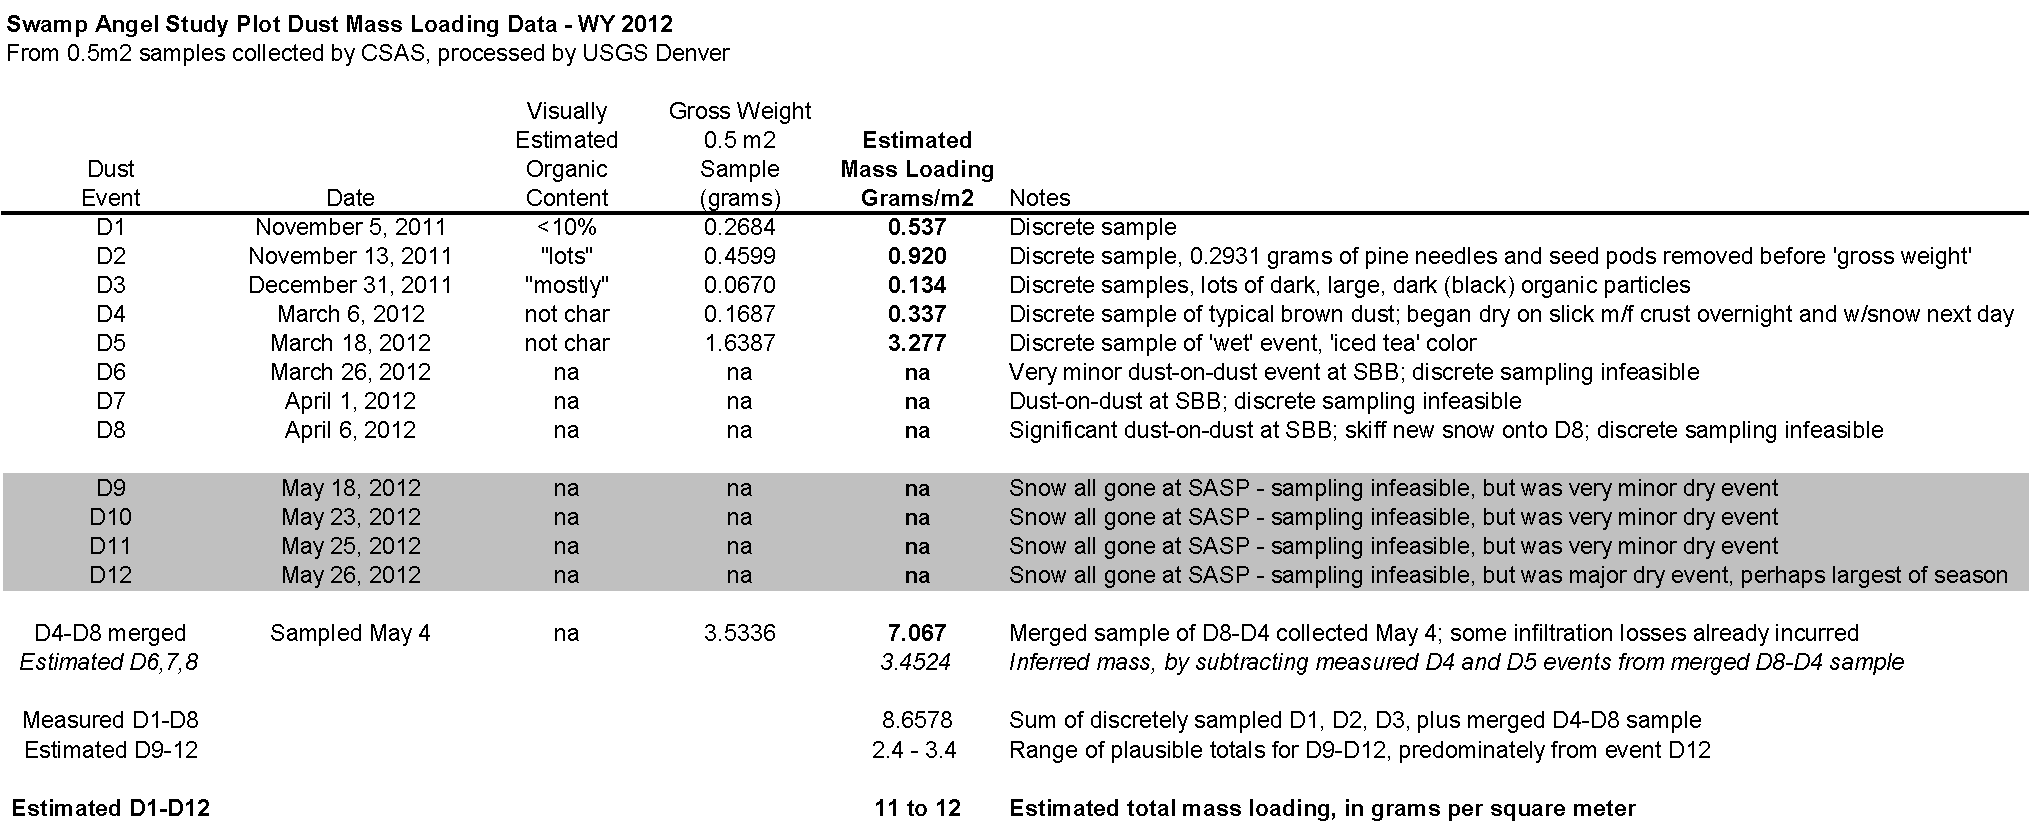
Throughout the winter season, beginning with the first snowcover until “snow all gone” (SAG) in the spring, CSAS/CODOS collects, as feasible, a time series of 0.5m2 samples of individual dust layers at Swamp Angel Study Plot. Samples are processed by USGS lab technicians with the Geology and Environmental Change Science Center conducting research on “effects of climatic variability and land use on American drylands”.
The total number of dust-on-snow events in WYs 2011 and 2012 (at 11 and 12 dust storms, respectively) and their season dust mass loading totals were notably similar, at 14 grams per square meter in WY2011 and an estimated 11-12 grams per square meter in WY 2012 (mass of the final four events was estimated, due to loss of snowcover at Swamp Angel Study Plot).

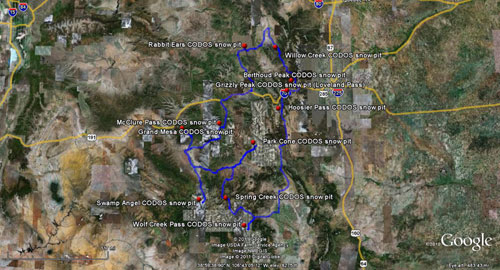
The Center for Snow and Avalanche Studies conducted three CODOS field campaigns in spring 2012, visiting our ten additional CODOS monitoring sites in a 1,000+ mile circuit and issuing site-specific CODOS Updates on the go. Between circuits, CSAS issued a number of Dust Alerts, as new dust-on-snow events were observed at Senator Beck Basin. By our final field campaign in early May, many sites had already experienced SAG and the remaining sites were rapidly approaching SAG, pre-empting a fourth circuit.
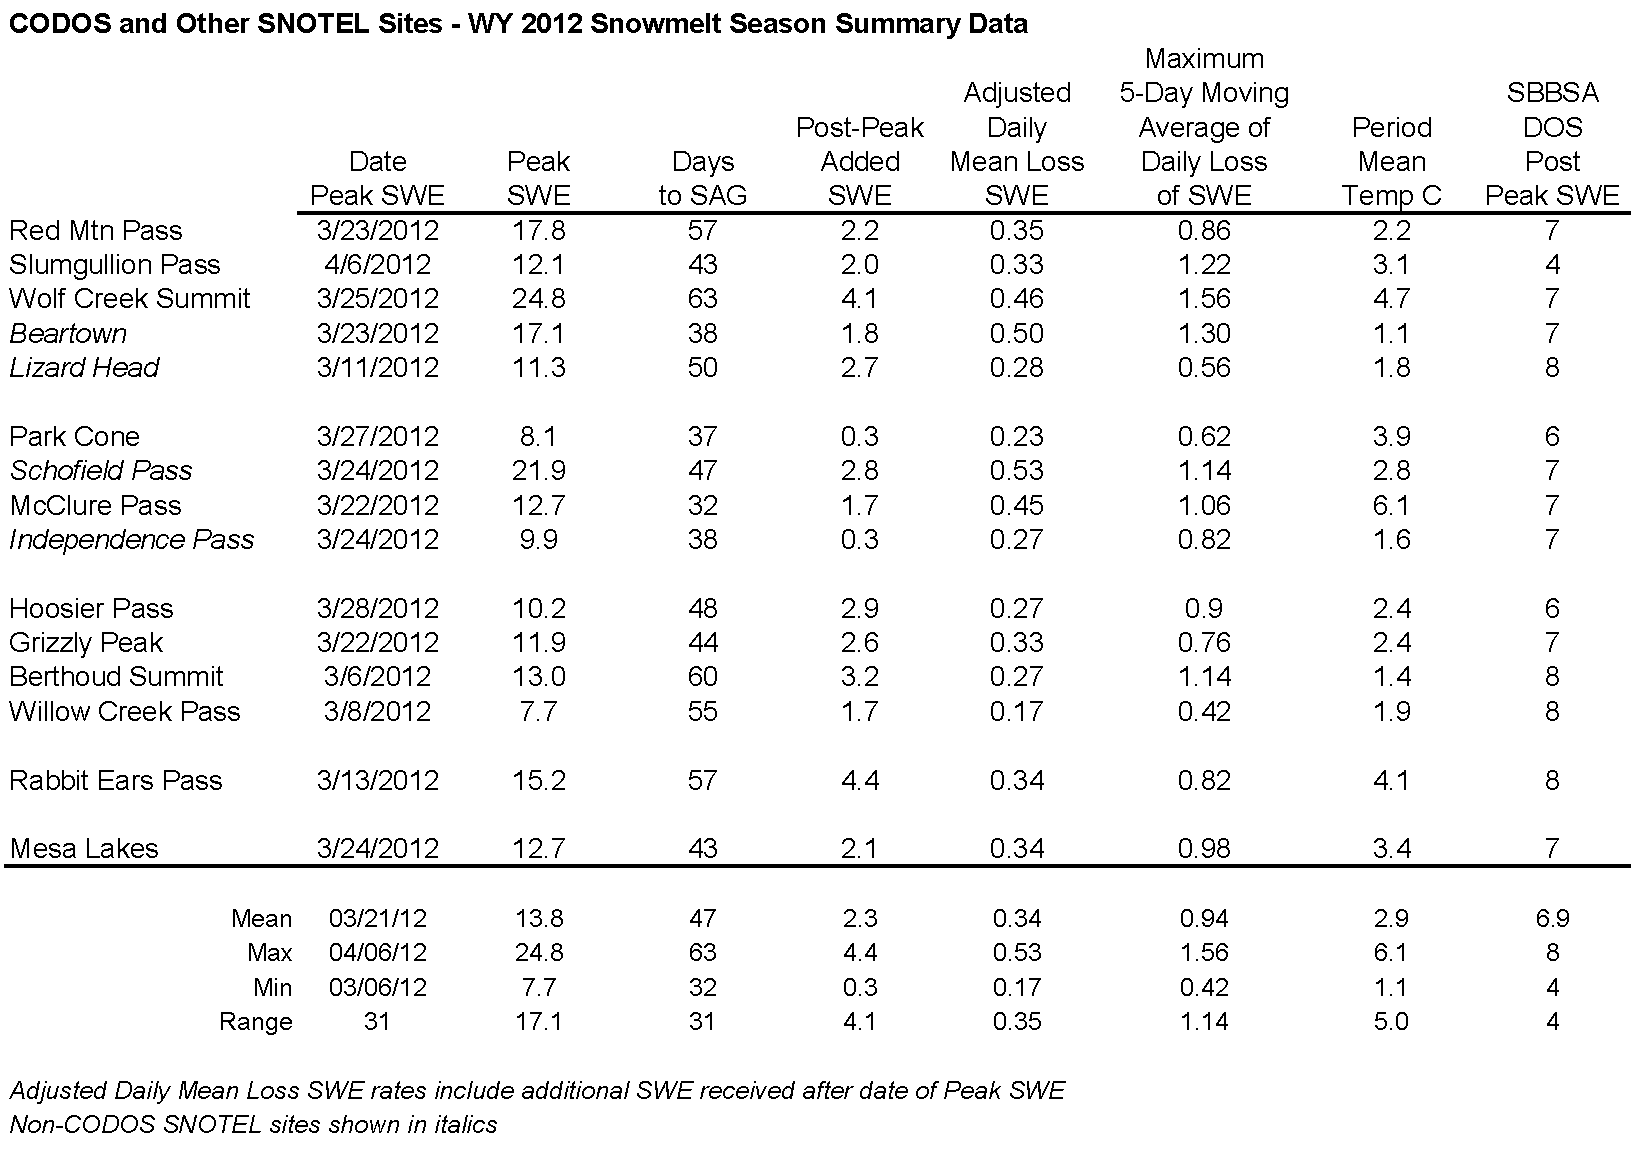
Analysis of WY2012 melt rate data at fifteen Snotel sites, showing date and quantity of peak SWE, days from peak SWE to “snow all gone” (SAG), total additional precipitation after date of peak SWE, an adjusted mean daily rate of snowmelt adding the additional precipitation to the peak SWE total, the maximum five-day moving average of daily melt, and the mean air temperature over the entire snowmelt period, from peak SWE to SAG. The number of dust-on-snow events logged at the Senator Beck Basin after the date of peak SWE at a given Snotel site is shown in the last column.
The table above summarizes Snotel site data from ten CODOS sites and five additional locations, summarizing rates of snowmelt from spring 2006 to spring 2012, the period during which we’ve rigorously observed dust-on-snow at our Senator Beck Basin Study Area, at Red Mountain Pass. Since the Snotel network is the only spatially extensive system continuously monitoring snowmelt throughout the Colorado mountains, year-to-year comparisons of Snotel melt rate data may yield insights into dust effects on local watershed-scale processes.
However, as we often note, each Snotel site has unique site characteristics. Many Snotel sites experience a radiative regime where surrounding trees reduce the access of direct, incoming solar radiation to the snowcover on the snow pillow, and where re-radiation of long wave energy from that vegetation, and reduced skyview, may inhibit radiant cooling and extend surface snowmelt during nighttime hours. As a consequence, many Snotel sites do not experience the maximum effects of dust reductions in snow albedo, and snowmelt forcing, that we observe at Senator Beck Basin study sites, where solar access is unimpeded. Among the Snotel sites we visit, the Berthoud Summit site most closely resembles the radiative regime at our subalpine Swamp Angel Study Plot in Senator Beck Basin.
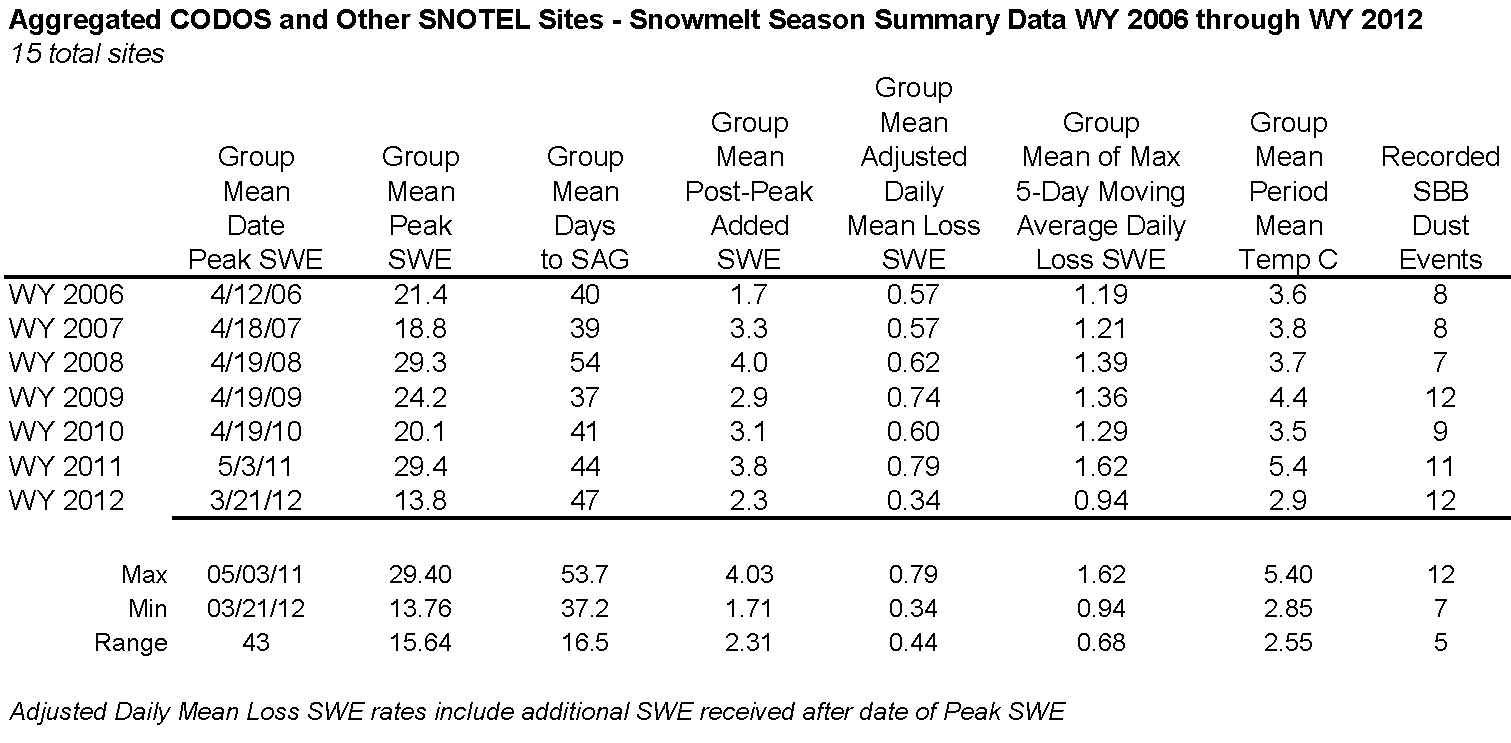
Although some seasons present substantial regional variations in snowpack properties and snowmelt timing and rates across the Colorado mountains, aggregating these fifteen Snotel site data by season further highlights just how different Water Years 2012 and 2011 were (table above). Both years required a similar number of days to fully ablate their snowpacks (entire period following peak SWE), but 2012 peak SWE was less than half of 2011 peak SWE, and melt rates in 2011 were more than double those in 2012. Although air temperature differences would support higher melt rates in 2011, and the role of direct solar energy is reduced by shading at Snotel sites, the shift in 2011 snowmelt season to late May and June also resulted in near maximum solar energy inputs contributing to the Colorado snowmelt energy budget, as the sun approached its seasonal zenith and day length approached the solstice maximum. The much earlier peak SWE and start to snowpack ablation in 2012, in March, resulted in a lower total potential solar energy contribution to the snowmelt energy budget, before SAG.
Given the very dry winter and sub-par snowpacks statewide, below average snowmelt runoff was unsurprising. However, in response to periods of dry, sunny, unseasonably warm weather and sustained exposure of significant dust-on-snow, spring 2012 hydrographs statewide also exhibited early runoff onset at unusually high rates, with a corresponding early and steep descending limb to very low levels.
In addition to the very warm temperatures associated with prolonged periods of dry and sunny weather in late winter and spring 2012, dust-on-snow events D4 (March 6th) through D8 (April 6th) played a significant role in this early statewide runoff, reducing snow albedo and hastening the warming of the snowpack to isothermal (at 0° C throughout) in late March or early April. Those dust layers continued absorbing and adding solar energy to the snowmelt energy budget during subsequent periods of exposure at the snowpack surface in April and May. Most systems produced peak streamflows well in advance of normal timing, at well below-average levels. By early June, snowcover was largely ablated, statewide, and streamflows began a rapid and steep decline to very low levels normally not seen until the end of summer.
----------
These site-specific summaries are intended to stand alone as individual reports:
Berthoud Summit | Grand Mesa | Grizzly Peak | Hoosier Pass | McClure Pass | Park Cone | Rabbit Ears Pass | Senator Beck BasinSpring Creek Pass | Willow Creek Pass | Wolf Creek Pass