 Water Year 2012 CODOS Summary for
Senator Beck Basin Study Area
Summary | Dust Log | Winter Storm Log | Snowpack | Melt Rate |
Stream Flows | Open Questions
Summary
Water Years 2011 and 2012 produced a case study in interannual variability of Colorado snowpack formation and ablation driven in large part by vastly different late winter and spring precipitation, perhaps representing seasonal extremes. On the other hand, the two seasons produced comparatively similar dust-on-snow conditions in the Colorado mountains.
Unusually stormy winter weather in spring 2011 resulted in relentless snowfalls interrupting and postponing sustained dust-on-snow effects until late May, just as historically large or record-breaking snowpacks peaked. Dust-in-snow then enhanced the delayed but rapid snowmelt and runoff in June, at a sustained, high rate.
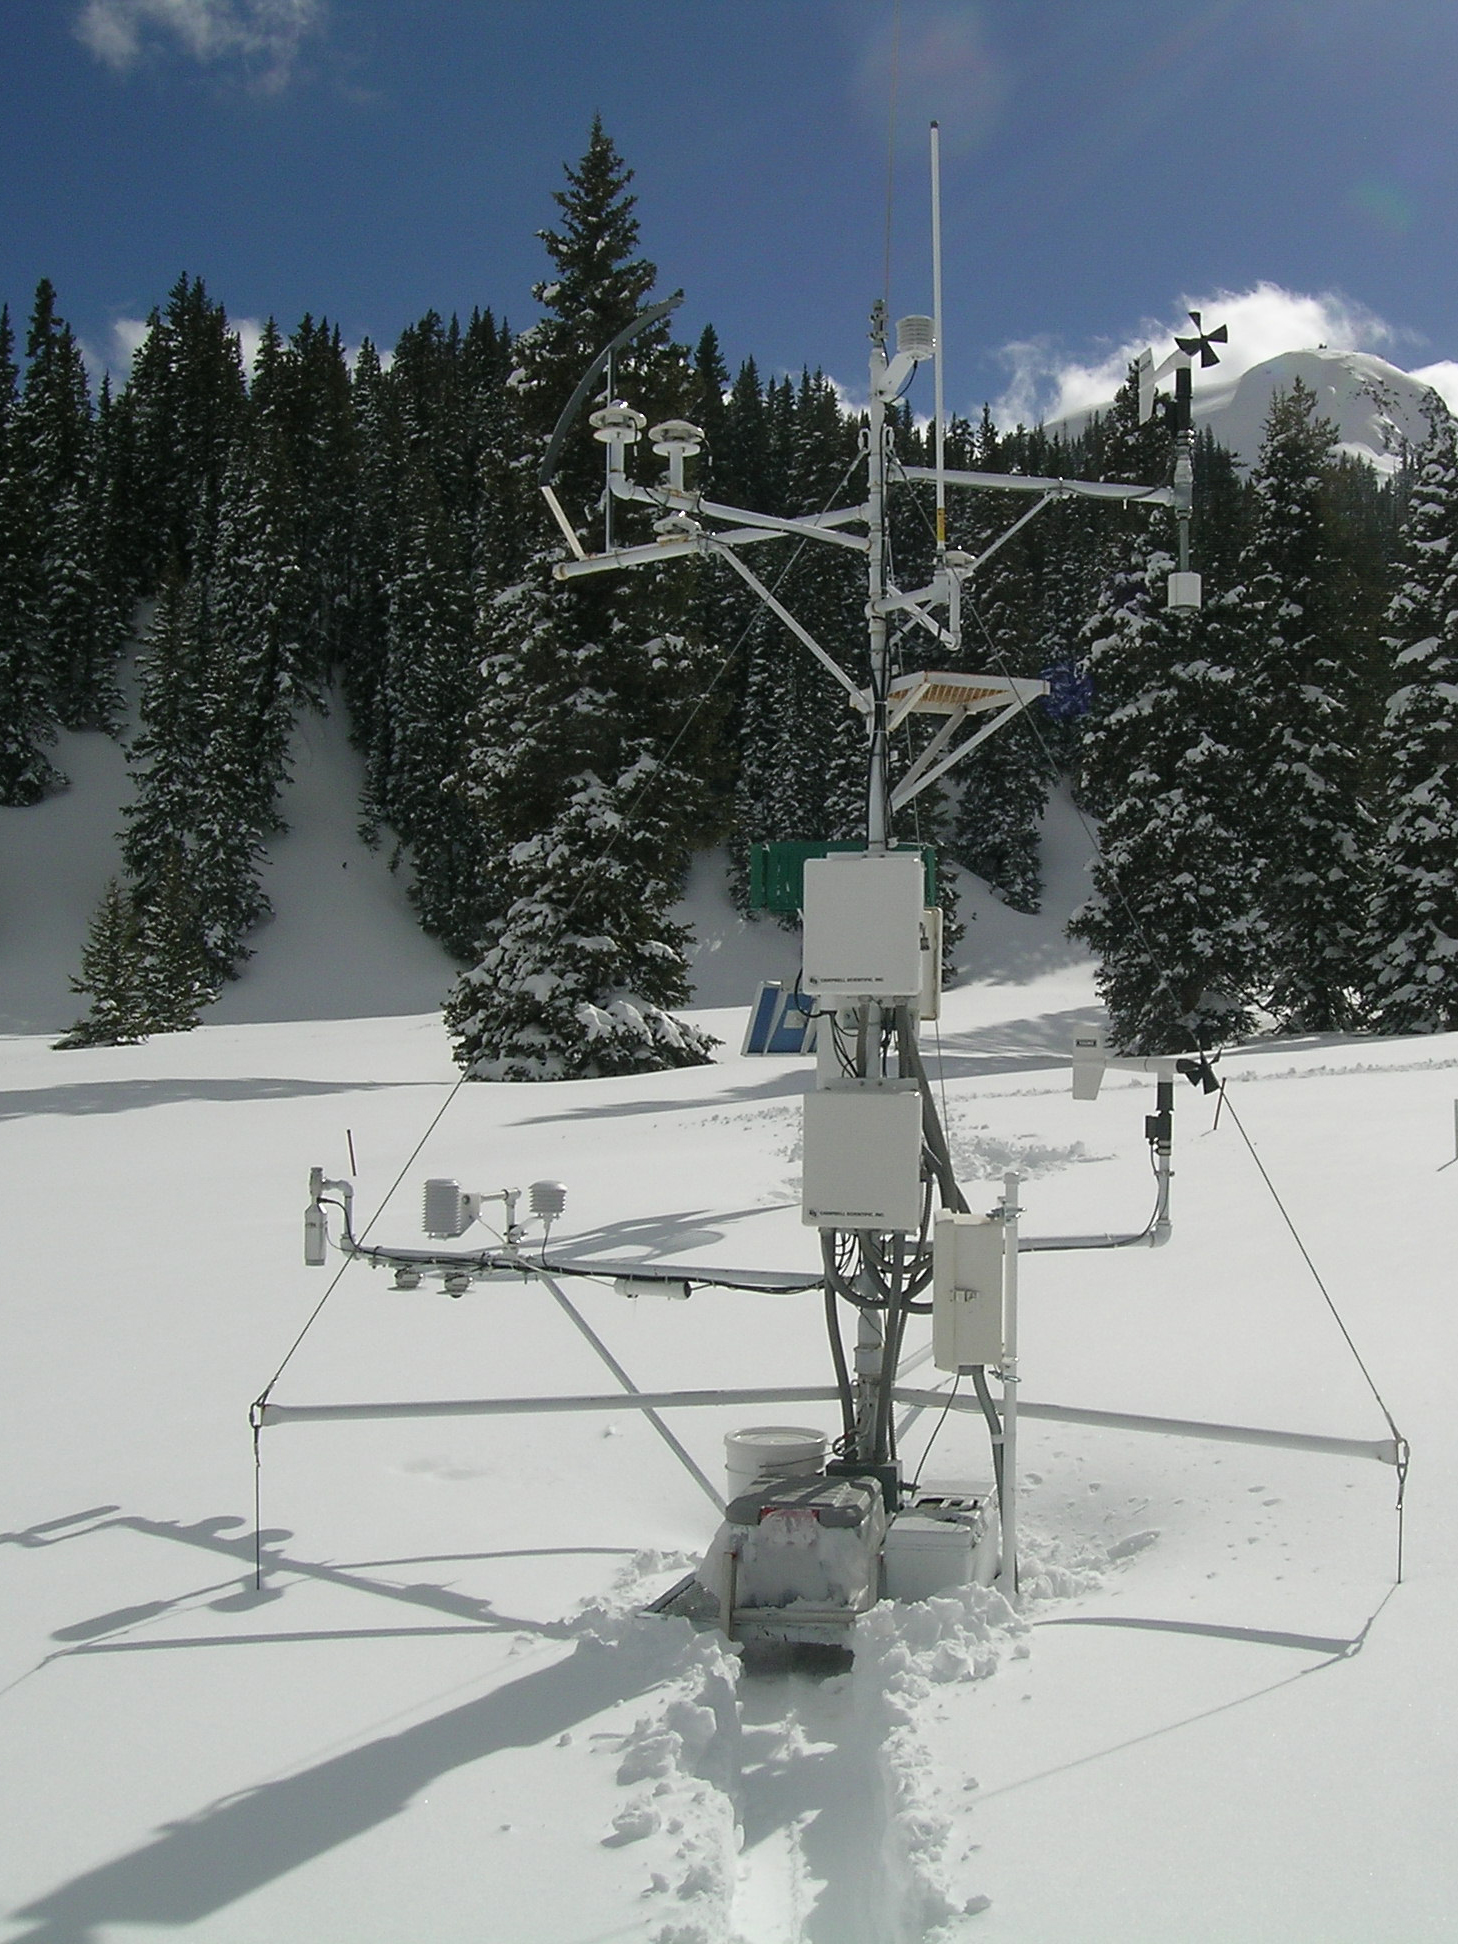 May 11, 2011 |
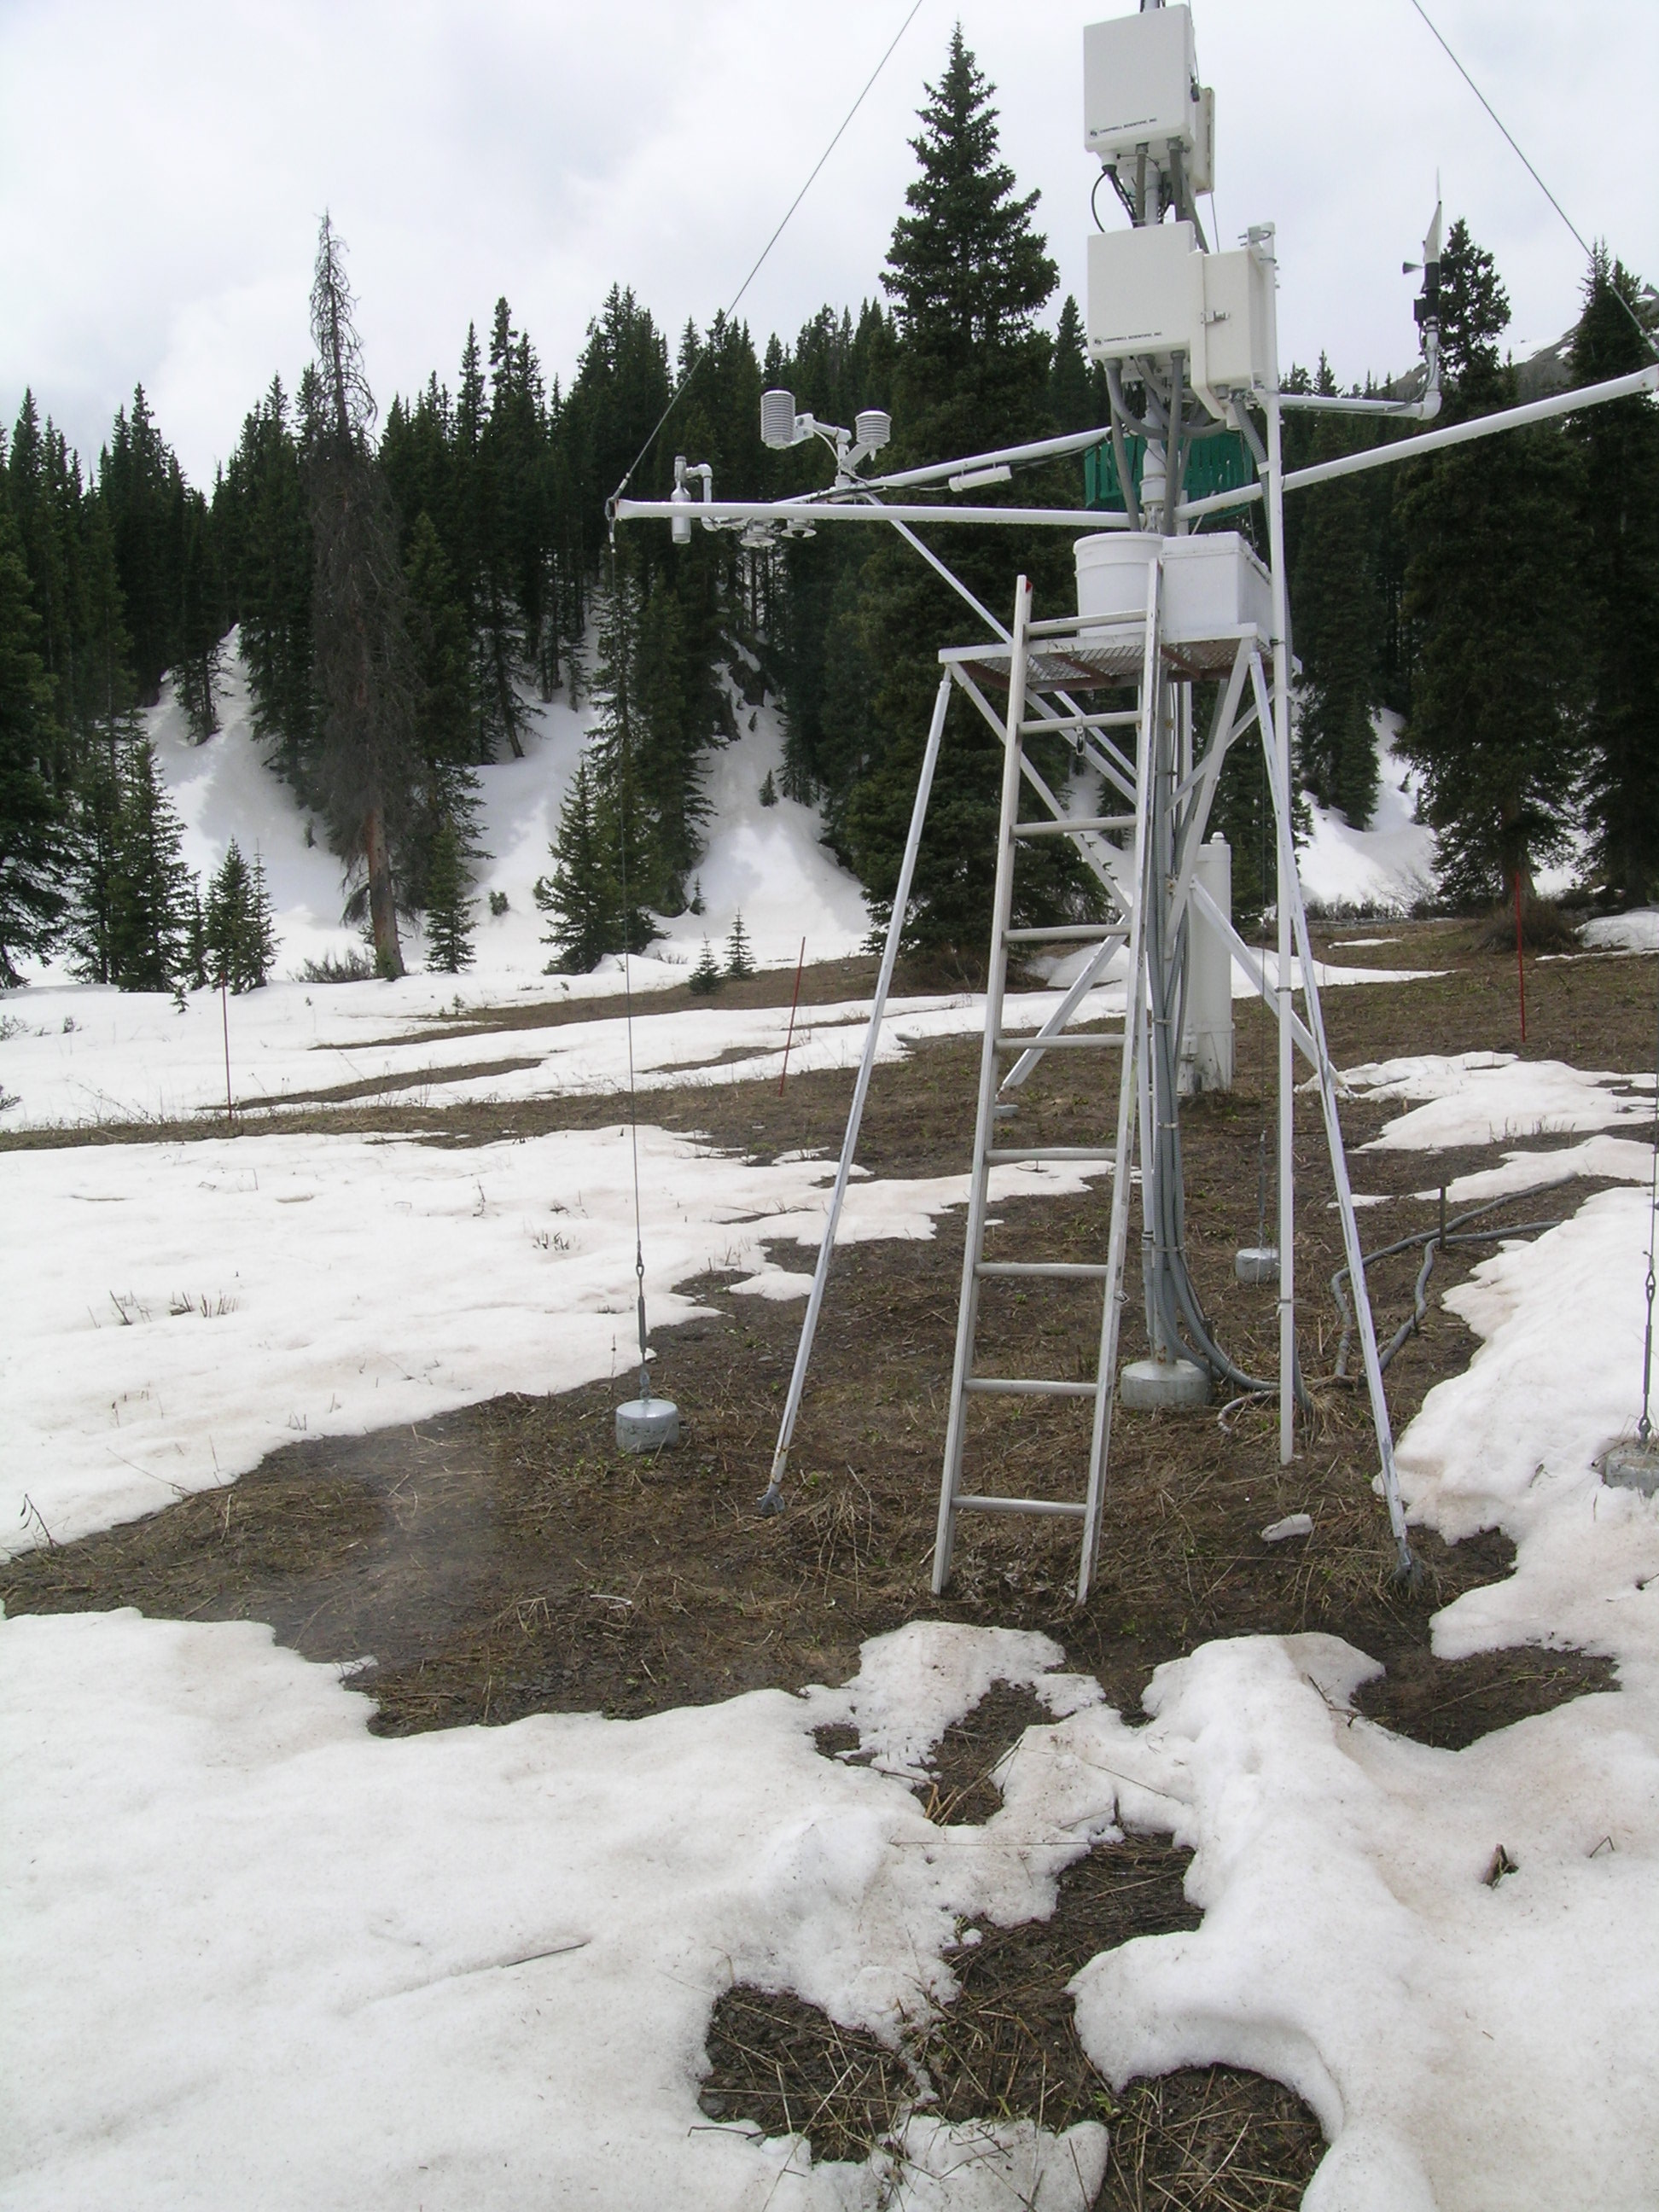 May 12, 2012 |
| Swamp Angel Study Plot in Senator Beck Basin Study Area near Red Mountain Pass with a 2.6 meter (8.5 feet) difference in snowpack depth | |
In dramatic contrast, extremely dry late-winter and spring weather conditions in 2012 resulted in very low values of peak SWE and an unusually early and dust-enhanced start to snowpack ablation. Beginning in March, dust-on-snow layers remained exposed at the snowpack surface for prolonged periods, absorbing enough additional solar energy to initiate and enhance snowmelt and runoff well in advance of long-term average timing. That early phase of dust-enhanced snowmelt was then disrupted in April by frequent but small storms. A second phase of more rapid, dust-enhanced snowmelt followed in May and, in conjunction with sub-par snowpacks, generated an early and well-below-normal peak in snowmelt runoff followed by a rapid decline in runoff flows in June to levels normally observed in late summer.
Dust LOg
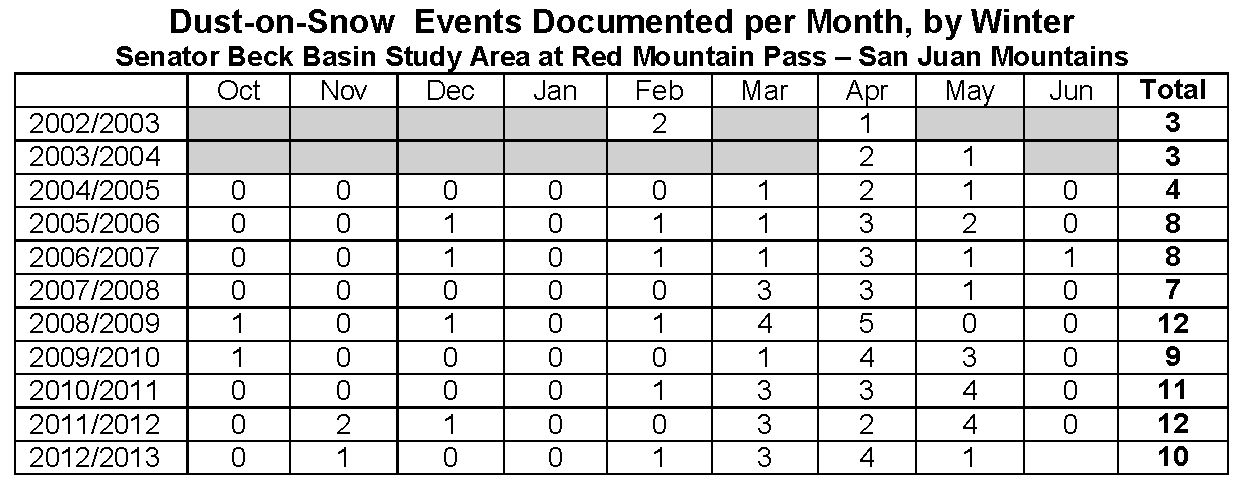
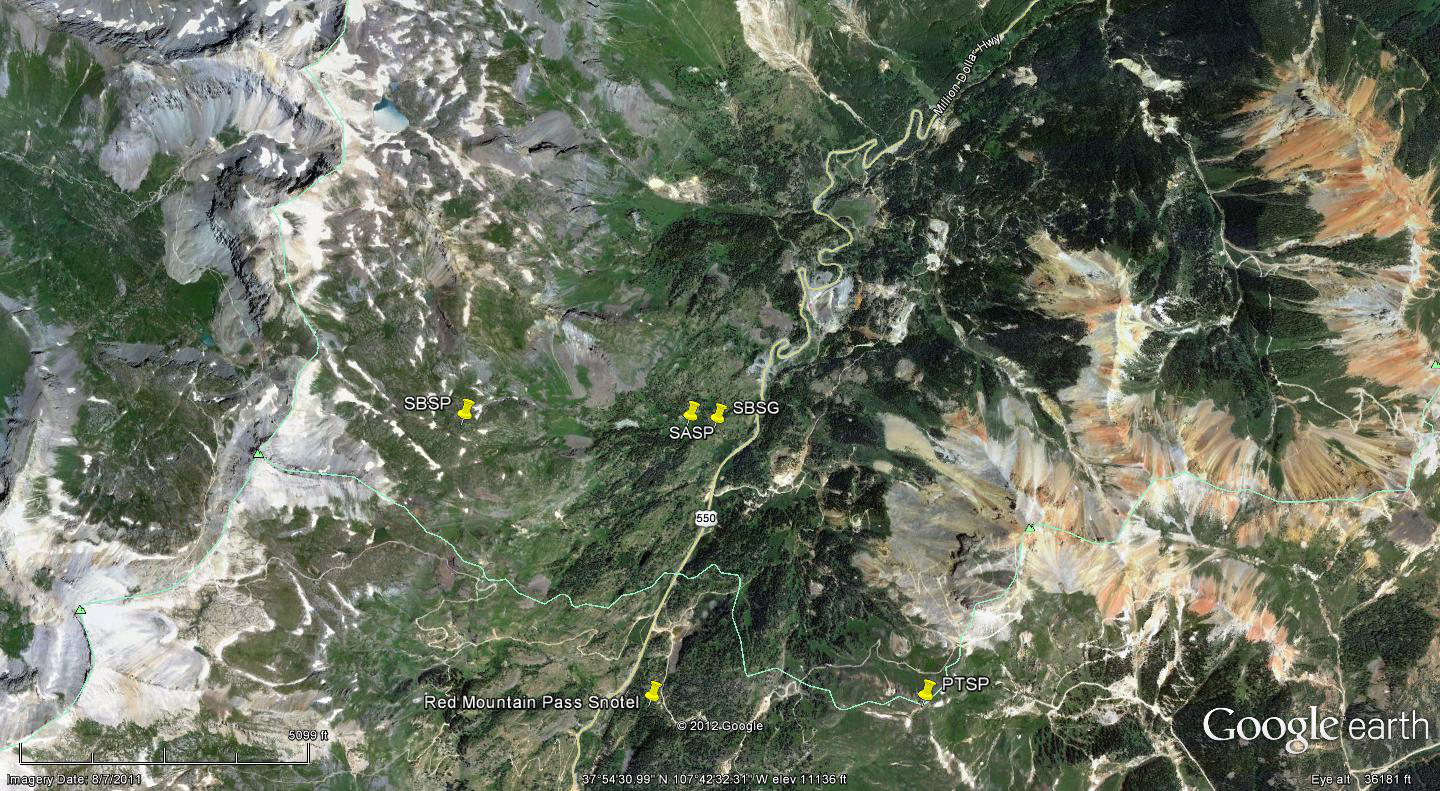
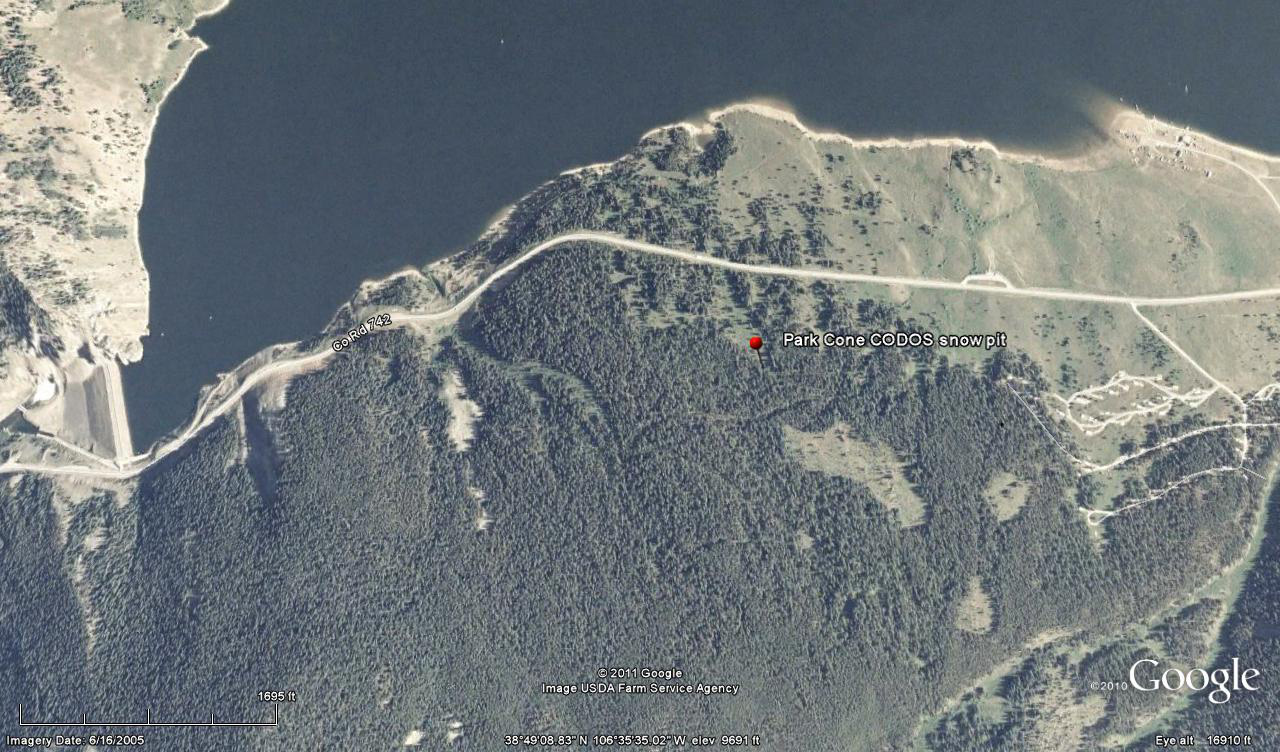
The Senator Beck Basin Study Area at Red Mountain Pass, operated by the Center for Snow and Avalanche Studies, serves as the baseline sentry site for rigorous dust-on-snow monitoring in Colorado. Dust-on-snow “events” are defined, by CSAS and the Colorado Dust-on-Snow program (CODOS) as a deposition of new mineral material (as distinct from vegetation debris) that is visually discernible, to the naked eye, as a layer at the subalpine Swamp Angel Study Plot or, if dust is falling directly onto an already dirty snowpack surface, an event may be indicated by the visual observation of dust in the sky. Although most events begin during daylight hours, many continue after nightfall, and rare events fall entirely during darkness (these are still generally easily detected in the snowpack). Some very fine aerosol material may be deposited onto the Swamp Angel Study Plot snowpack undetected and also contribute to reduction in snow albedo; except in the case of unknown amounts of black carbon (soot) that may be falling onto our snowpack, these other fine aerosols, such as inversion ‘smog’ or other pollution, are considered negligible contributions in comparison to the albedo impacts of visually discernible dust “events”.

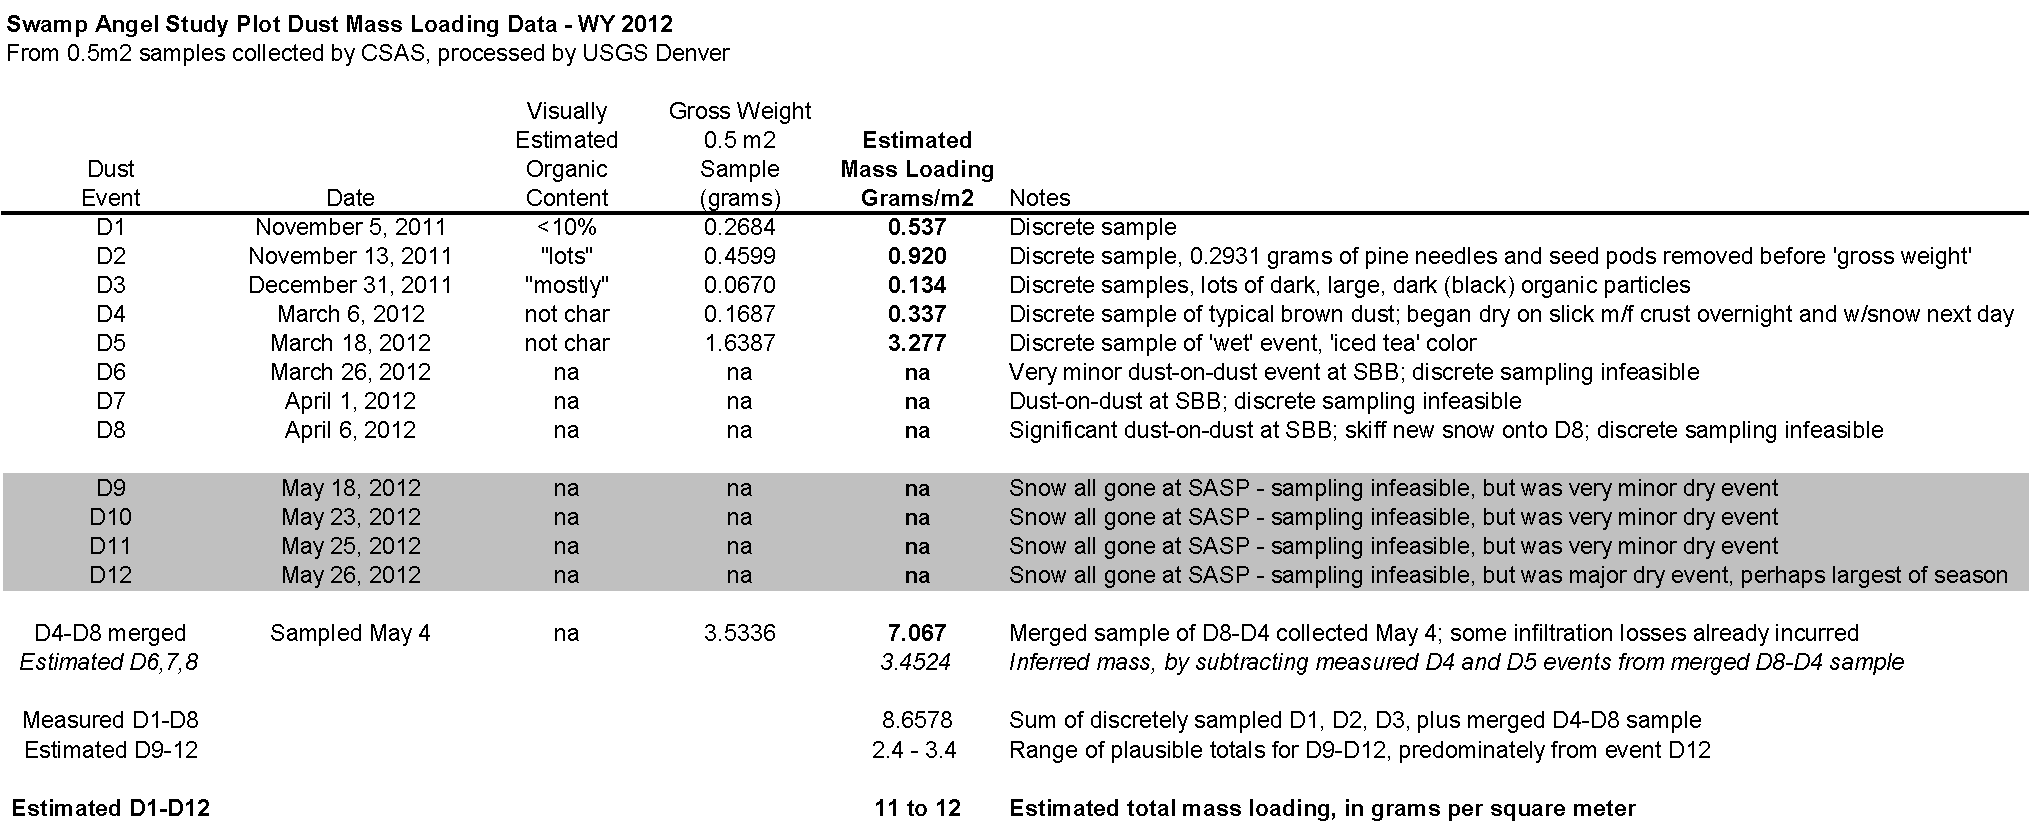
Throughout the winter season, beginning with the first snowpack until “snow all gone” (SAG) in the spring, CSAS/CODOS collects, as feasible, discrete samples of individual dust layers at Swamp Angel Study Plot. The absence of wind redistribution of new snow containing dust at SASP results in comparatively uniform rates of deposition of dust and snow throughout the SASP site. A 0.5m2 sample is collected, including snow above and below a new dust layer, and bottled. That sample is then shipped to a United States Geologic Survey in Denver where it is processed by lab technicians with the Geology and Environmental Change Science Center conducting research on “effects of climatic variability and land use on American drylands”. Water is evaporated from the dust/snow sample and significant amounts of vegetation debris are noted. The dry dust material is then weighed on high precision scales. The weight of dust from the 0.5m2 sample is then doubled to estimate the mass loading, of dust, per square meter. Additional concentrated dust samples are collected, without regard to aerial extent, for chemical analysis by USGS. USGS retains and archives both types of samples for future reference.

On May 4th, 2012 this 0.5 m2 sample of merged dust layers D4 through D8 was collected at Swamp Angel Study Plot; snow albedo was ~0.48 (48% reflectance). Approximately ¼ of the sample has been removed from the square sampling area and placed in a clean plastic bag. Some infiltration of fine dust entrained in melt water had occurred, so snow was collected down to a depth a few inches below the surface. Such samples are promptly driven to Silverton and immediately transferred to a large Nalgene carboy before melting, and the emptied bag is flushed with distilled water into the carboy to minimize loss of dust material to the bag. After evaporating all liquid, and removing large vegetation particles (pine needles), this sample contained 3.5336 grams of dust per square meter.
As the WY2012 table above indicates in grey, for the first time in our history of observation at Senator Beck Basin, we lost snowcover at our subalpine Swamp Angel Study Plot before the end of the dust storm season. Four additional dust storms, three of which were very minor, fell onto bare ground at Swamp Angel Study Plot in May, precluding dust sampling consistent with our protocol. Nonetheless, all four of those events did fall onto snowpack at the higher elevations of Senator Beck Basin, as dust-on-dust events without any additional snow. Although three of these events were of minimal mass, perhaps comparable to event D3-WY2012, the final, fourth event D12-WY2012 was on a par with the most major dust storms observed in prior seasons, with darkened red skies, major reductions in visibility, and visible dust deposition in Silverton, running into nighttime. In the absence of any SASP sampling of that event, because snowpack had long since melted, CSAS estimates that D12-WY2012 was comparable to event D5-WY2012, and perhaps larger. Therefore, our estimate is that those portions of Senator Beck Basin remained that snow covered until May 26, 2012 experienced a total mass loading of 11-12 grams per square meter, +/- 1 gram.
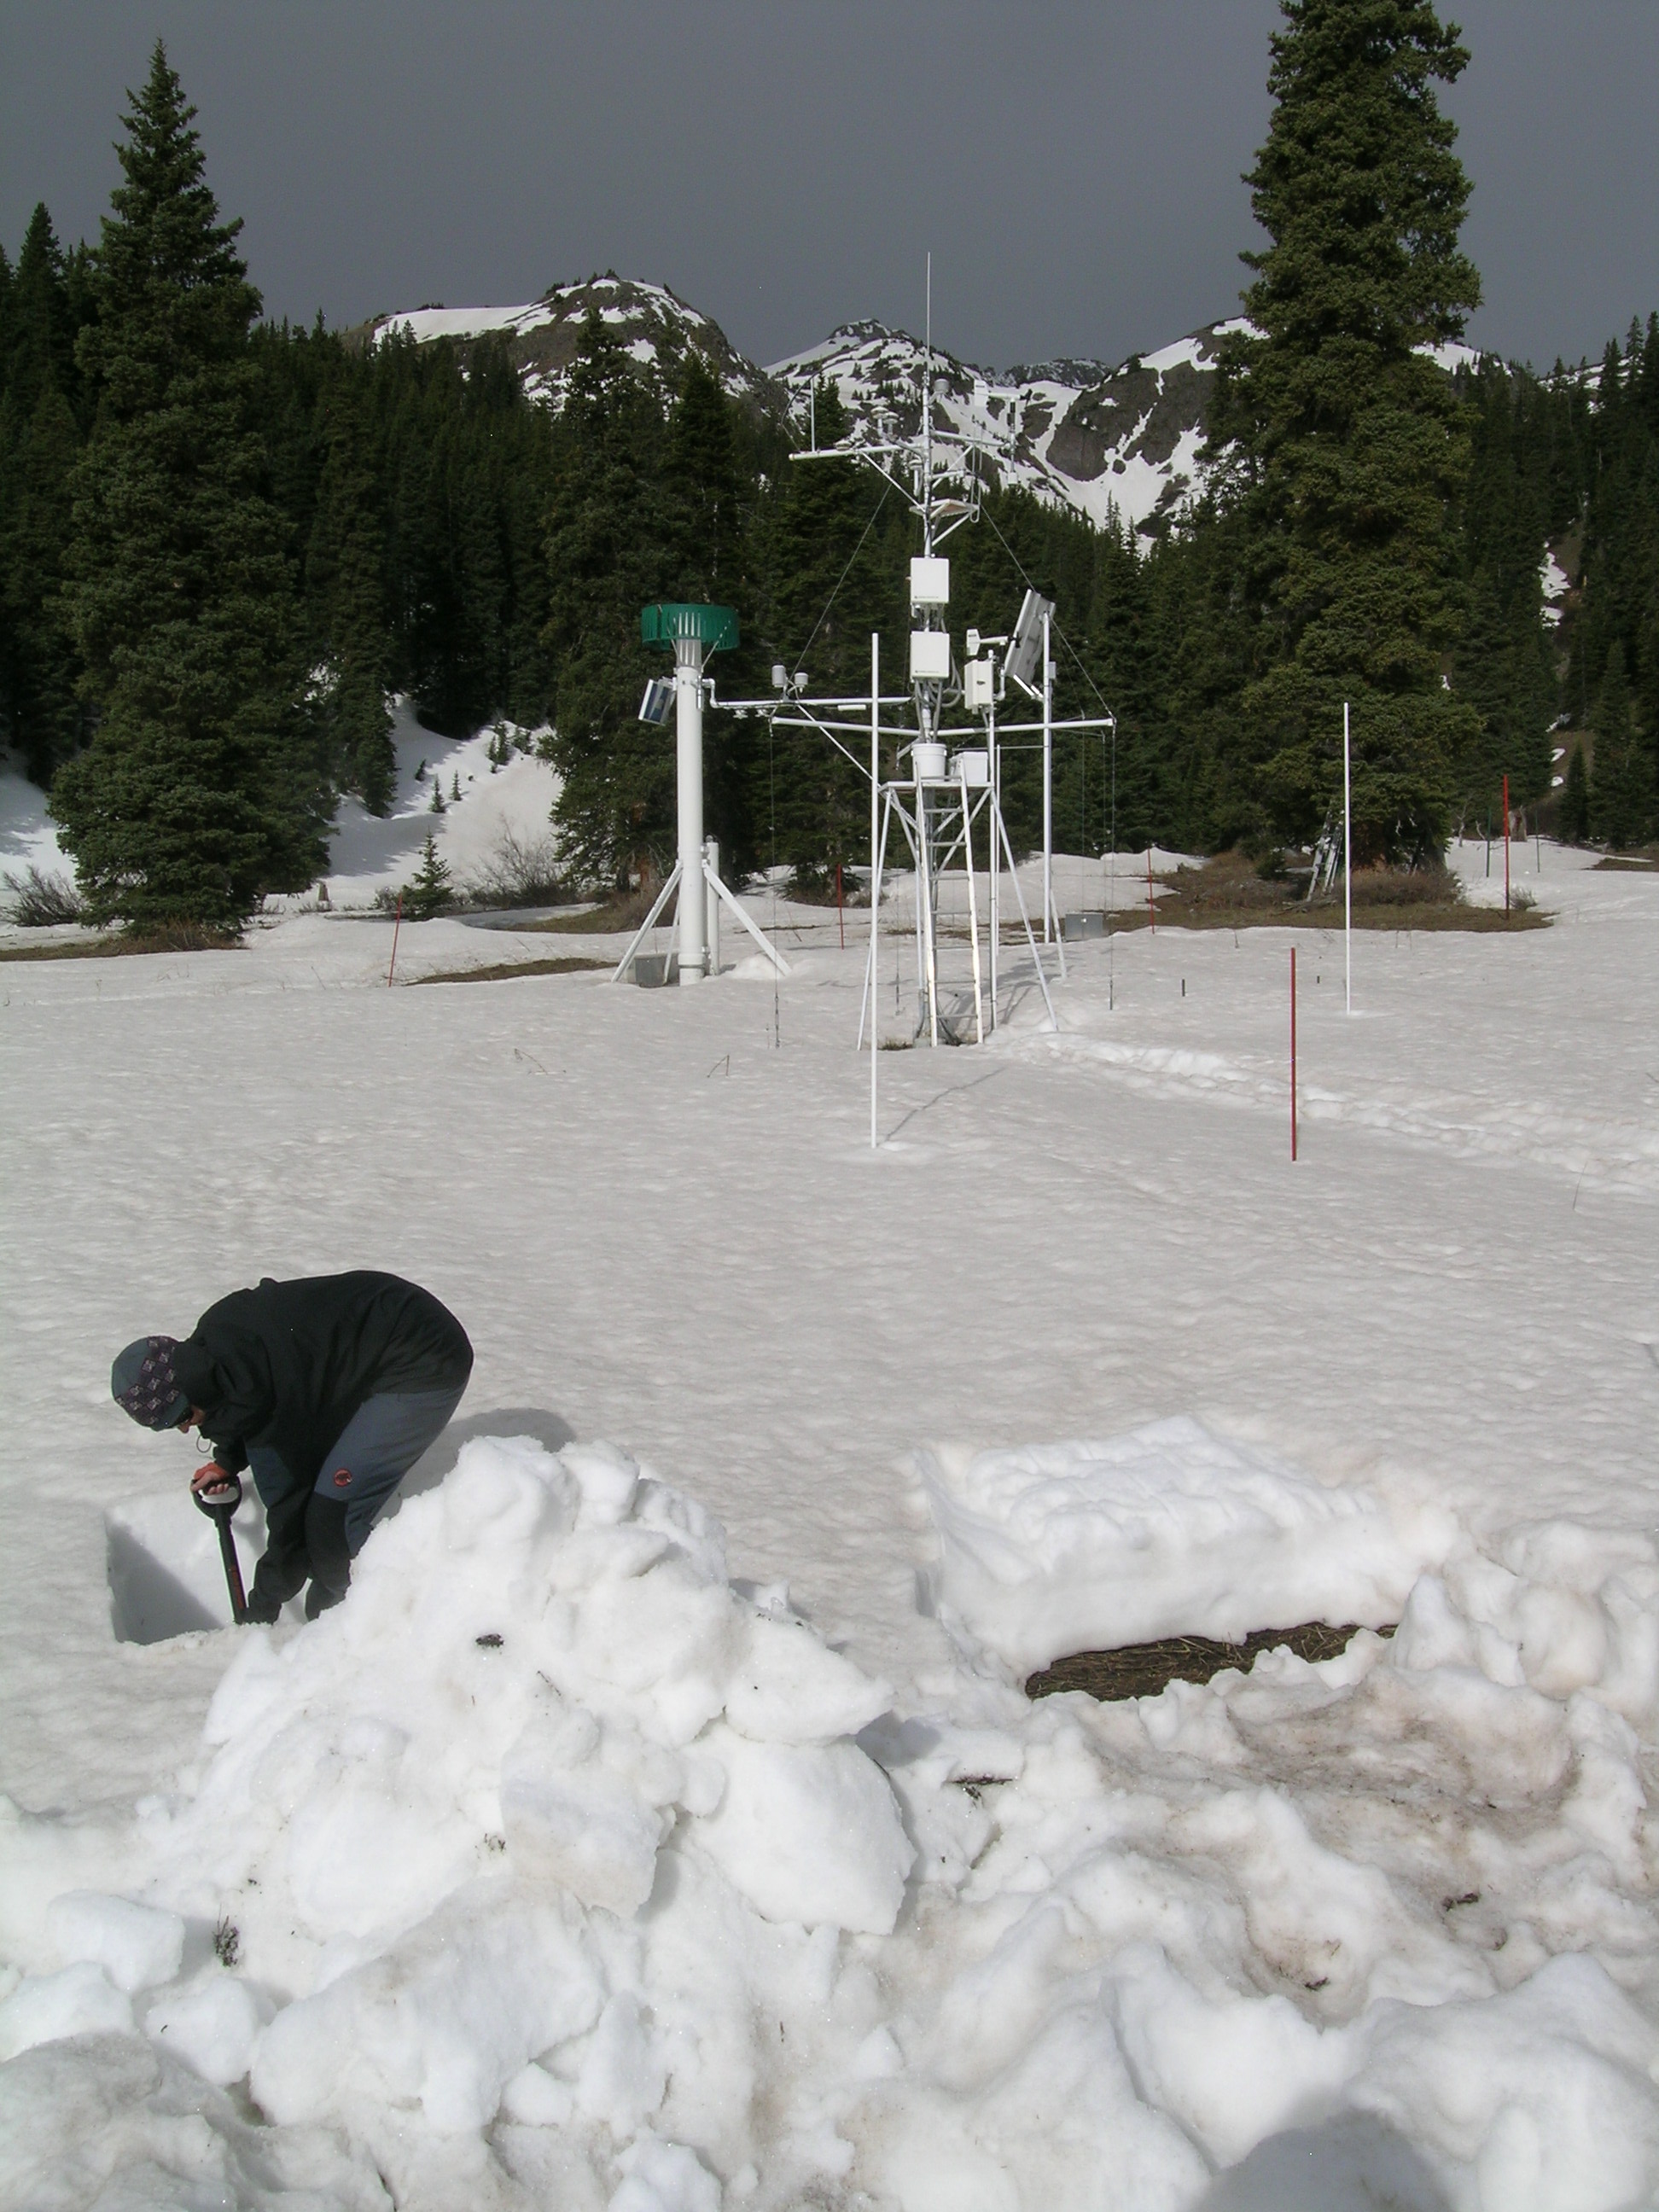
Swamp Angel Study Plot on May 7, 2012, with Profile #17 under excavation as the snowpack rapidly approaches “snow all gone” (SAG). Snow albedo ranged from near 0.50 (50% reflectance) in early May to ~0.45 near SAG.
The total number of dust-on-snow events in WYs 2011 and 2012 (at 11 and 12 dust storms, respectively) and their season dust mass loading totals were notably similar, at 14 grams per square meter in WY2011 and an estimated 11-12 grams per square meter in WY 2012 (see below). Despite those similarities, diametrically different late winter and spring weather during the past two seasons resulted in dust having very different effects on snowmelt processes at Senator Beck Basin and throughout the State.
Eleven dust events occurred in the late winter and spring of 2011. However, relentless accumulation of late winter and spring snow routinely buried new dust layers at Senator Beck Basin and restored high snow albedo values, until the end of May. Then, on May 29th, the final and perhaps largest dust event of the season, D11-WY2011, fell onto the surface of what was still close to peak SWE accumulation at the Swamp Angel Study Plot. The first three weeks of June 2011 were entirely dry and sunny enabling D11 to quickly ablate underlying snow and merge, in rapid succession, with underlying dust layers.
In juxtaposition to 2011, late winter and spring 2012 were exceptionally dry, with widely spaced and comparatively small winter storms at Senator Beck Basin. Only 156 mm (6.1”) of precipitation fell in Mar/Apr/May 2012, versus 516 mm (20.3”) in Mar/Apr/May 2011. As a consequence of that dry weather, dust-on-snow event D4-WY2012, on March 6th, and subsequent dust events that merged with and enhanced dust layer D4 were only occasionally and usually briefly buried under clean new snow for the remainder of the sharply curtailed spring 2012 snowmelt season. Initial reductions in snow albedo from event D4 in early March at Senator Beck Basin were initially small. However, event D5, on March 18th, 2012 added substantial additional dust to the snowpack and soon emerged at the surface. Incremental additions of dust events D6-8, often as dry events without precipitation, further reduced albedo values. Following event D8, which fell on April 6th directly onto the merged D7-4 dust layers at the snowpack surface, albedo values at Swamp Angel Study Plot were 0.49 to 0.55 (indicating 49-55% reflectance of incoming solar energy). Albedo values in clean snow in early April 2011 were 0.60 to 0.68. During the exceptionally dusty spring of 2009, albedo at SASP fell as low as 0.35-0.40 at the end of the season.
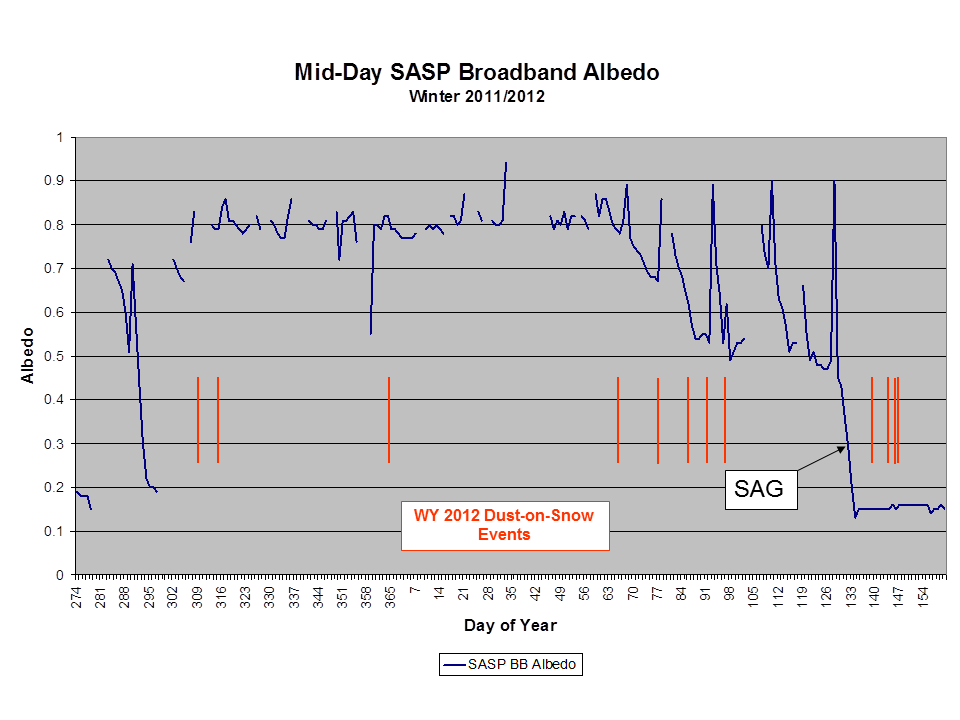
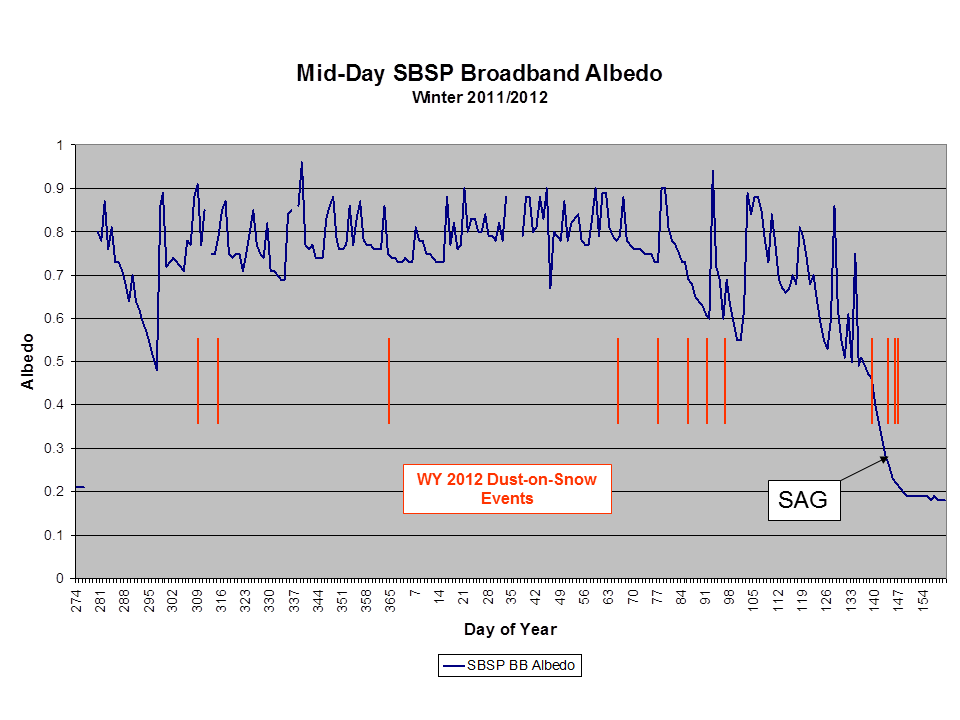
Plots of average “broadband” snow albedo from 1200-1300 hours each day of WY 2012 snowpack at the Swamp Angel and Senator Beck Study Plots in Senator Beck Basin Study Area. Gaps in the data represent days during which snow covered the up-looking sensor measuring incoming, short-wave radiation (the “broad band” pyranometers). Data at either end of the plot represent albedo of bare soil or vegetation on the ground. Red bars show WY 2012 dust-on-snow events, by date. The point of “snow all gone” (SAG) is indicated, and albedo values for the preceding day or two were reduced by dark soil seen through the shallow, wet snow by the down-looking pyranometer. Albedo is calculated as the ratio of reflected radiation to incident (incoming) radiation upon a surface; valid snow albedo values in these plots range from ~0.3 (30% reflectance) to ~0.9 (90% reflectance). Both sites experienced declines in snow albedo beginning with event D4 (March 6th), frequently reversed by clean snow.
Winter Storm Log
The Center for Snow and Avalanche Studies has maintained a log of “winter storms” since the winter of 2003/2004. Winter Storms are defined as a snow precipitation event containing at least 12 mm (~ 0.5”) of water equivalent, as measured in 1 mm increments at the Swamp Angel Study Plot using an ETI precipitation gauge, and with no break in precipitation greater than 12 hours. A number of storm parameters are logged, including allocations of storm precipitation to rain or snow in early and late winter. Weather events which meet the Storm criteria are sequentially numbered throughout the season, but all precipitation is, of course, recorded and tallied. The complete CSAS Storms and Precip Data record presenting detailed and summary Storm datasets and graphs is contained in an Excel workbook linked on our website.
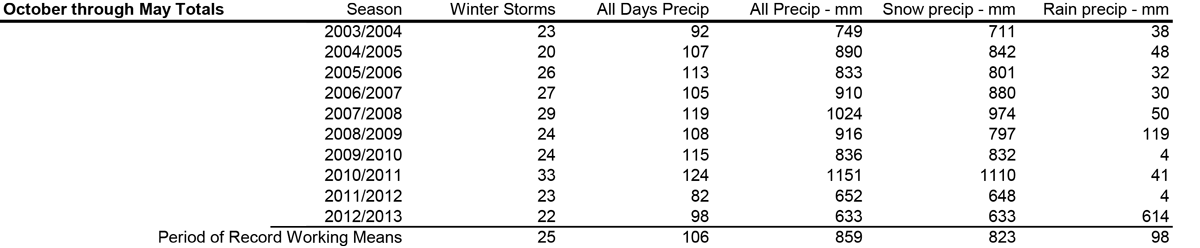
The table above presents summary statistics for the nine winter seasons in our period of record. Since and including the winter of 2003/2004, our Senator Beck Basin Study Area has experienced between 20 and 33 numbered winter Storms from October through May, with a working mean of 25 Storms per season. We have also observed 3 Storms in June.
Winter 2011/2012 produced 23 numbered winter Storms, two fewer than the working mean and three more than the minimum of 20 Storms in 2004/2005, but with the least total precipitation (including non-storm precipitation), at 660 mm (26.0”), of any October through May period in our short history. Winter 2010/2011, on the other hand, produced the most numbered winter Storms and the highest precipitation total for the Oct-May period.
A closer look reveals that the eighteenth storm of the season fell at the very end of February during both winters 2010/2011 and 2011/2012. October through February season precipitation totals were 635 mm (25.0”) in 2011, including 41 mm (1.61”) of rain, compared to 504 mm (19.8”) in 2012, with only 1 mm (0.04”) of rain. Spring snow storms can be the product of mesoscale processes such as local convection. But, if most early- and mid-winter Storms, as we define them, require weather events driven by non-local, synoptic scale atmospheric dynamics creating weather opportunities, then the large variations in Storm precipitation yields, from the identical number of Storms between October 1 and March 1 in 2010/2011 and 2011/2012, is of interest.
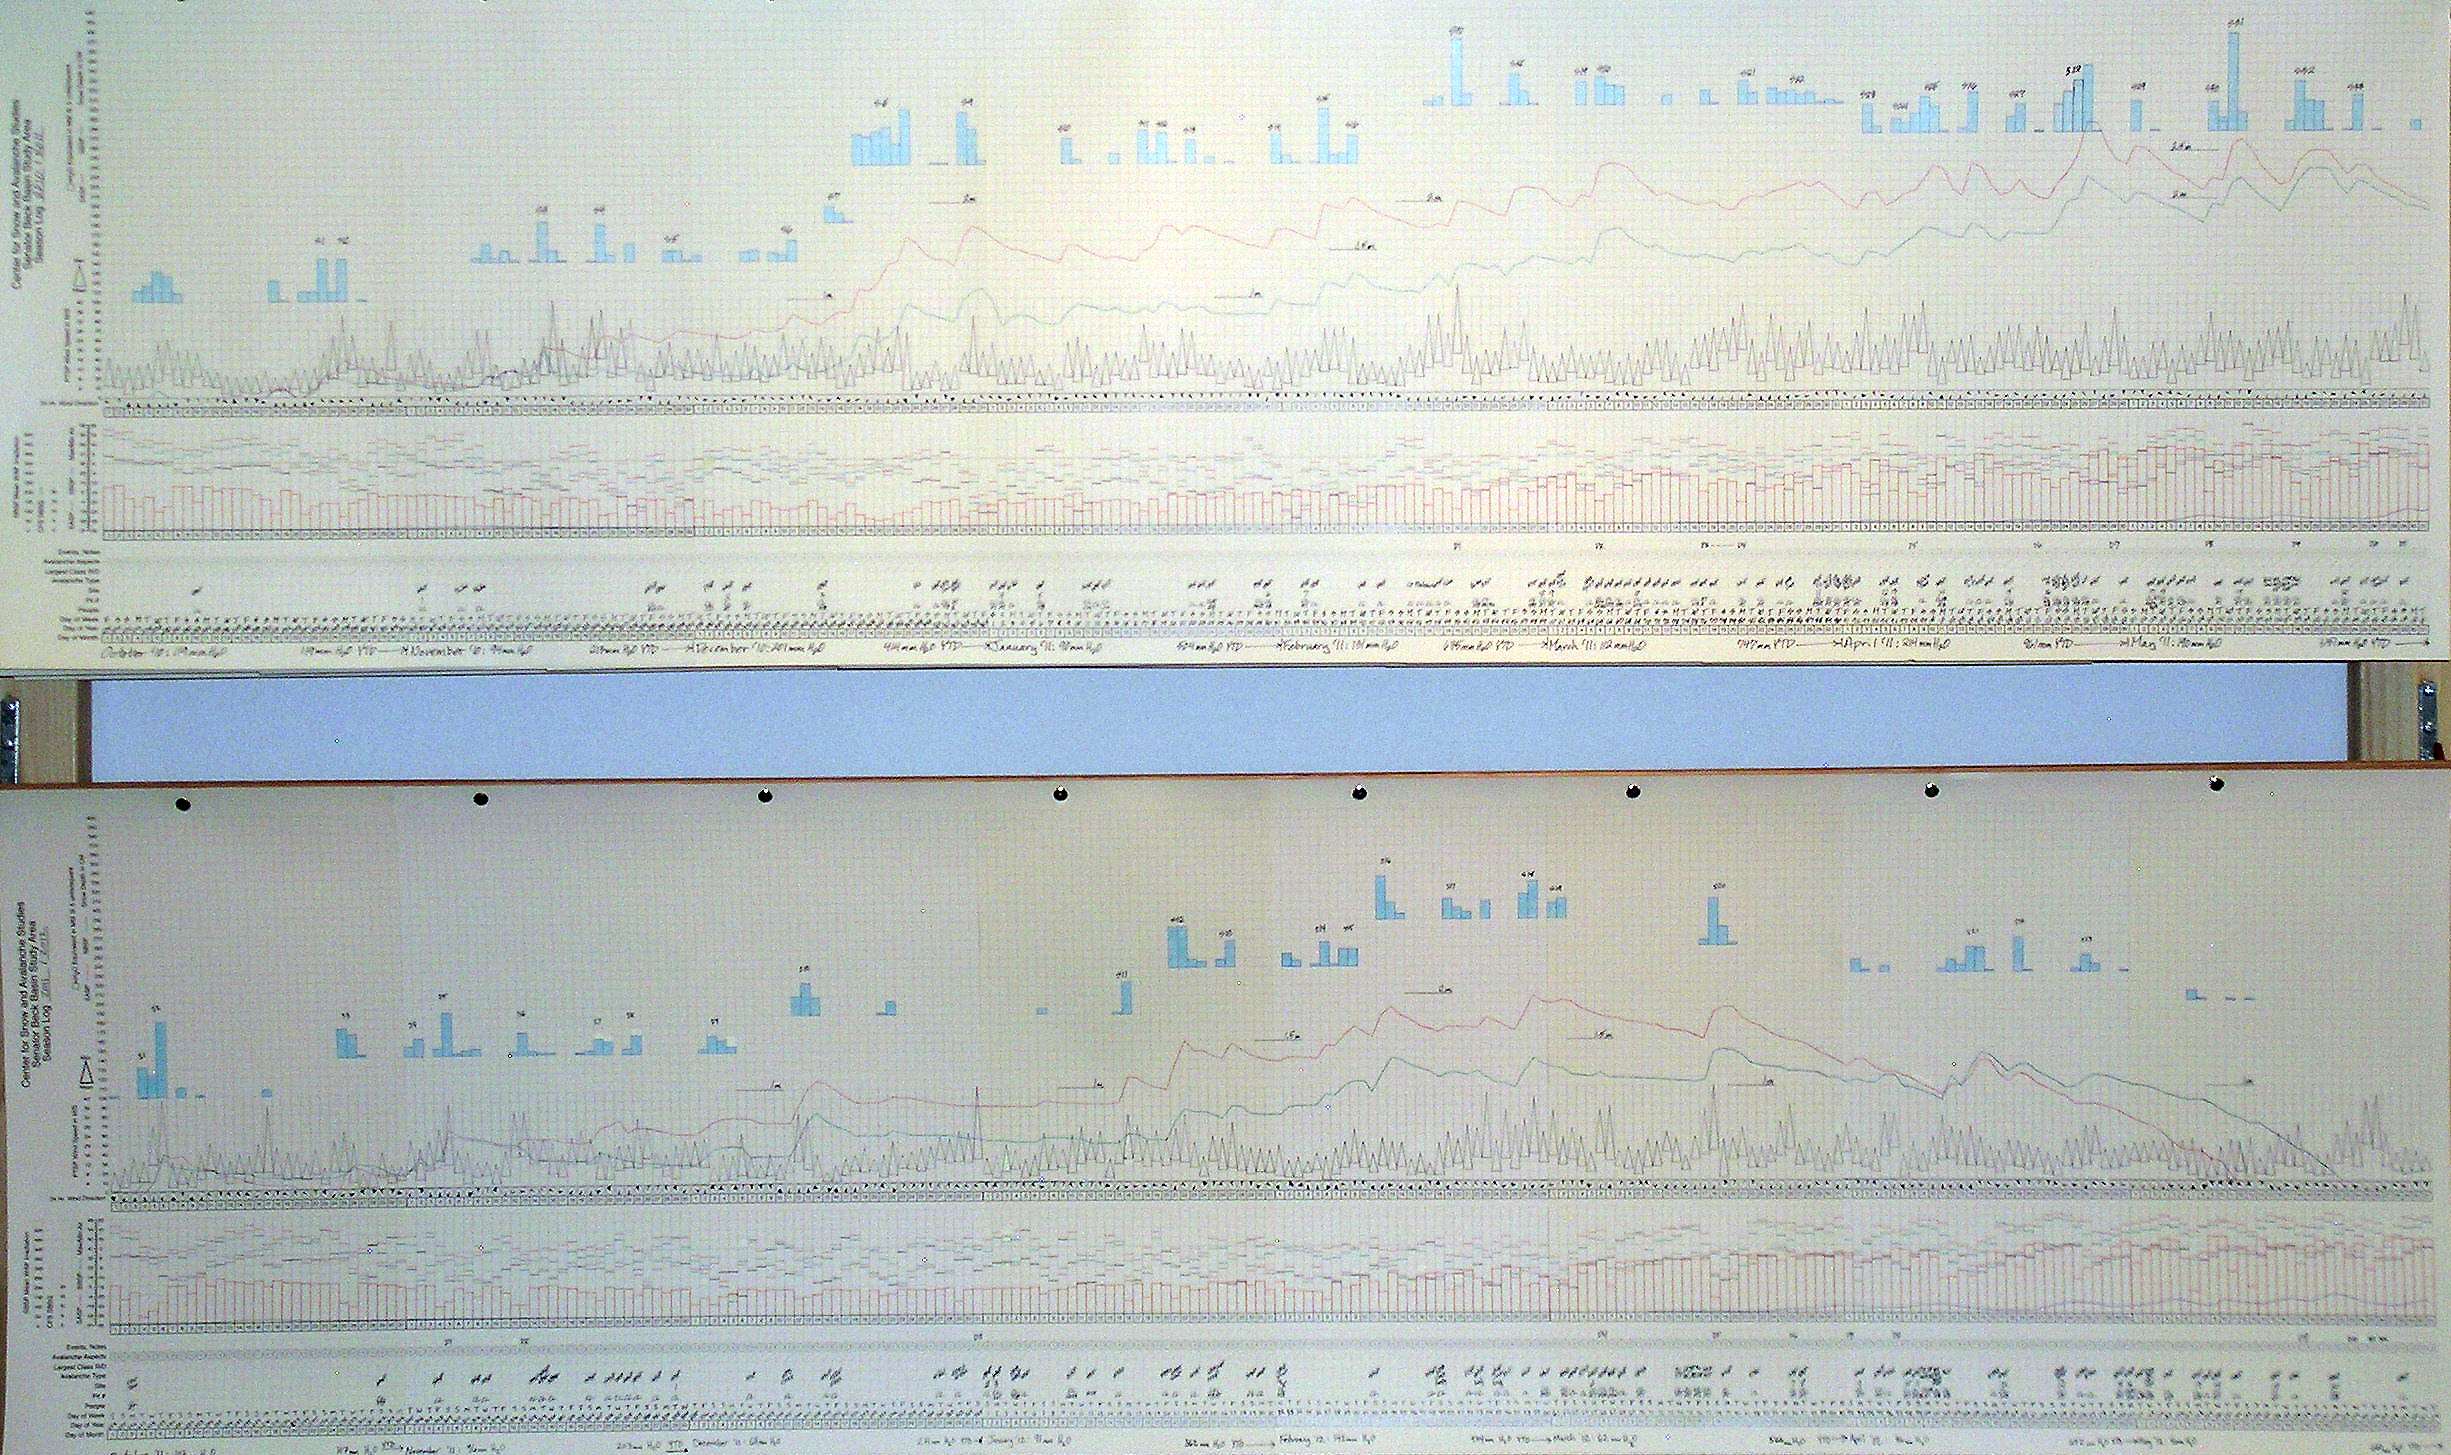
Our own hand drawn strip charts of those winter seasons, with bar graphing of daily precipitation totals (in blue), reveals that Storms #18-19 in 2010/2011 produced generally larger amounts of precipitation than their numbered counterparts in 2011/2012. Storm #8 in particular, a six-day event from December 18-23, 2010 delivered 105 mm (4.1”) of water equivalent increasing snowpack depth by 82 cm (32”), an outsized contribution to the WY 2011 snowpack. Recent investigations of these very large winter storms led by Dr. Marty Ralph at NOAA, in Boulder, is exploring the connection between “atmospheric river” events coming onshore from the Pacific Ocean and snowpack formation in Colorado. These atmospheric rivers (or ARs), are extremely concentrated plumes of low level water vapor emanating from the Pacific and delivering extreme precipitation events to coastal areas, eventually traveling as far inland as Colorado. CSAS has contributed Senator Beck Basin Storm data to Dr. Ralph’s effort to document and understand these AR events and looks forward to assisting in that ongoing research.
Further, it is also increasingly apparent that synoptic scale weather dynamics, rather than local winds, are required to generate wind fields potent enough to mobilize desert dust in the Colorado Plateau’s many source areas and then deliver that dust throughout the Colorado mountains in the concentrations we’re observing. Soil conditions in the source area must be favorable for dust mobilization as/when these winter and spring storms pass over the Colorado Plateau. Since those soil conditions are not always favorable, only some of our numbered winter Storms also deliver dust-on-snow, as “wet” depositions associated with new snow. However, as we experienced several times in spring 2012, ‘dry’ wind events driven by synoptic scale atmospheric dynamics, but without associated precipitation, can also bring dust storms to the Colorado mountains.
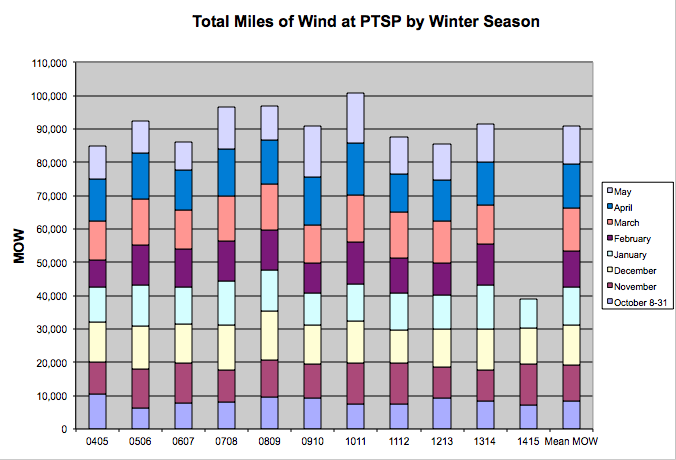
Total “miles of wind” passing through the Putney Study Plot, by month and winter season. One hour of wind averaging 30 mph at PTSP would yield 30 miles of wind.
CSAS monitors “miles of wind” at our Putney Study Plot near Red Mountain Pass. Compared to the winter of 2010/2011, which produced the most miles of wind in our period of record, last winter 2011/2012 was substantially less windy, particularly in March, April and May, when precipitation also fell of. Although dust event D5-WY2012 was a “wet” deposition, in association with Storm #20 in mid-March, all the subsequent dust events in March, early April, and late May, were dry dust storms without associated precipitation. The synoptic chracteristics of those spring 2012 dust storms were adequate to generate strong wind fields but did not include moisture supplies capable of producing significant snowfalls (as compared to the numerous “wet” dust events of Mar/Apr/May 2011 that were associated with major winter storms).
CSAS has posted “wind rose” plots of wind speed and direction for each dust-on-snow event of WY 2012, and all prior years. The two wind roses shown below are for the periods October 1 through summer solstice of WY 2011 and WY2012 (seasonal wind roses for our entire period of record are also available). Although very similar in overall pattern, these two seasons represent the maximum (2010/2011) and the minimum (along with 2005/2006) season average speeds. Winter 2011/2012 shows slightly more due south wind, and slightly less SW,WSW, and WNW wind than 2010/2011, and fewer hours of wind averaging more than 22 mph (shown as red and black blocks).
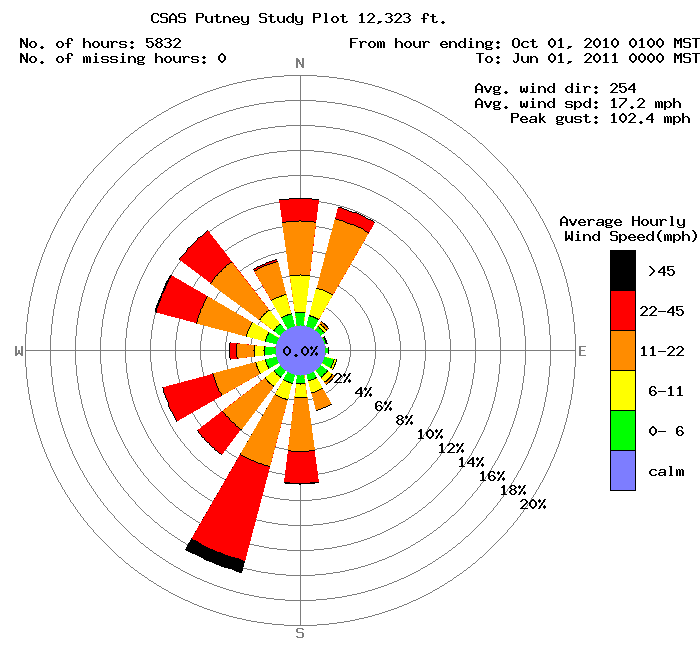
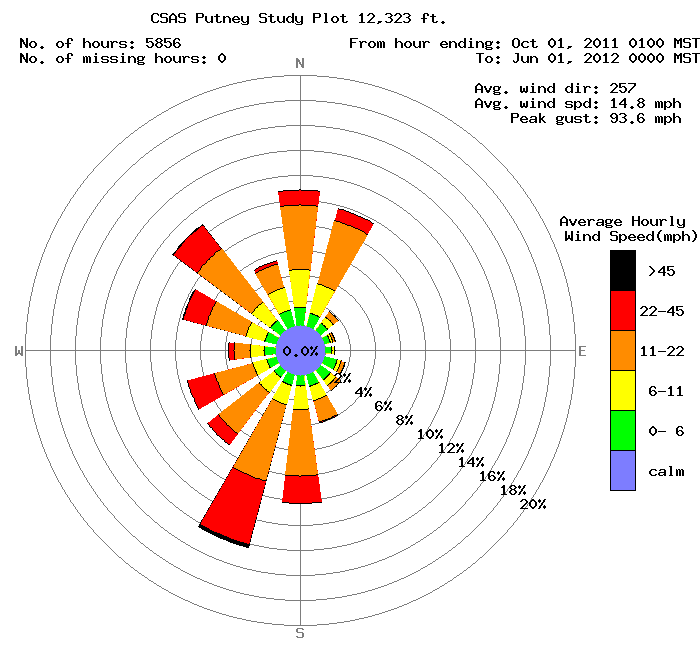
Putney Study Plot hourly wind speed and direction data from October 1 through May 30 of winters 2010/2011 and 2011/2012. Direction data are grouped in 22.5° sectors and speed subdivided into six classifications, including “calm”. Concentric rings show the percentage of contribution, for the entire season, of a particular vector (i.e., due south) and/or speed group within a sector.
SnowPack
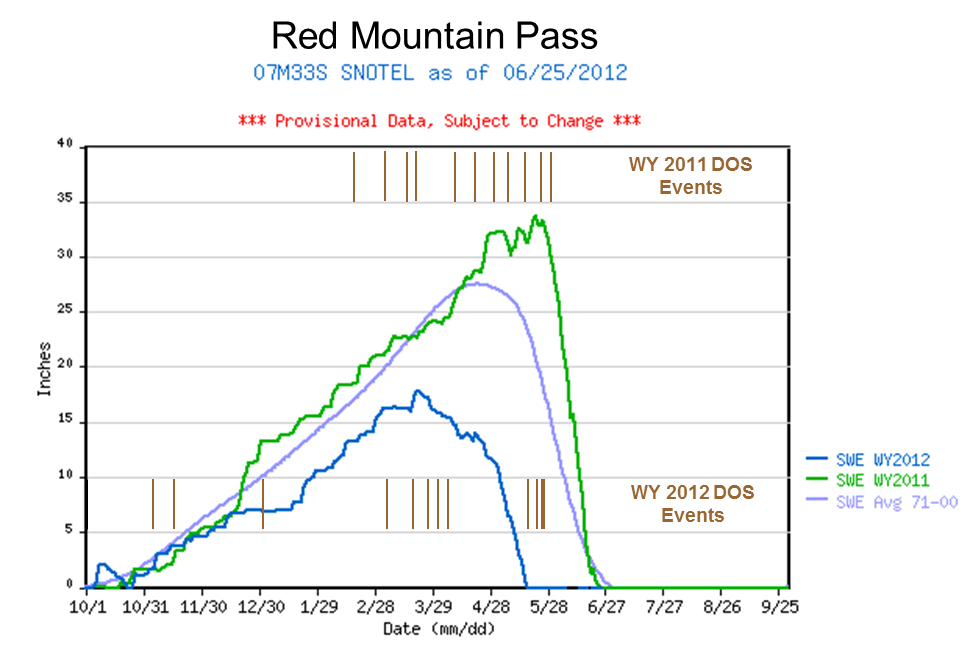
Red Mountain Pass Snotel SWE accumulation and ablation for Water Years 2011 and 2012, with dust-on-snow events shown, by date, as brown bars for both water years (as observed at the Senator Beck Basin Study Area’s Swamp Angel Study Plot, 2 km to the north).
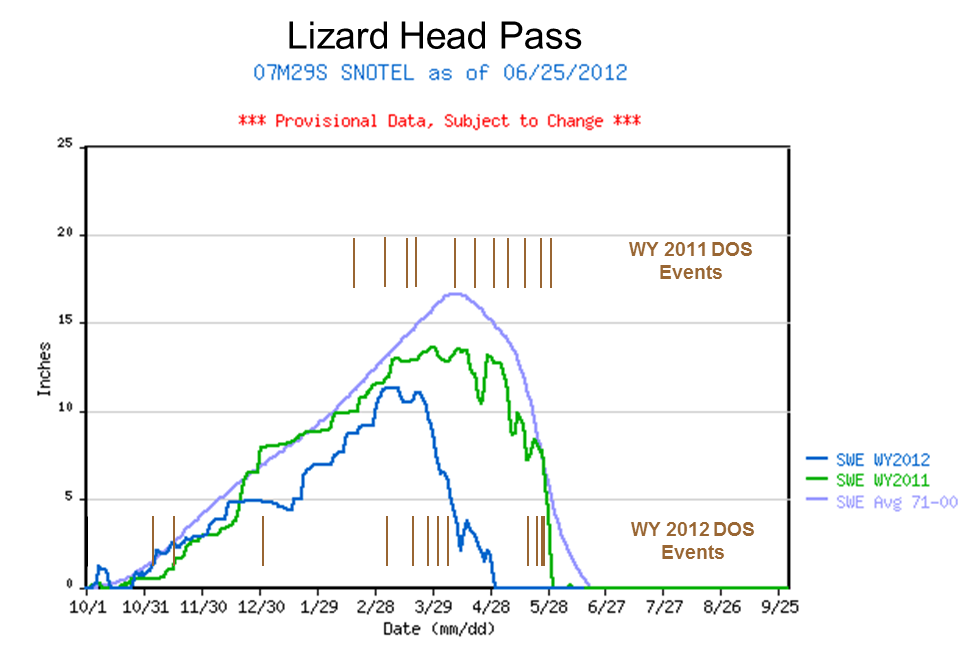
Water Year 2012 snowpack formation at the Red Mountain Pass Snotel began at near-average rates in early winter before slipping into the lower quartile of cumulative SWE values by December and remaining there until peak SWE. Due to the very dry late-winter and spring experienced throughout Colorado, WY 2012 peak SWE, at only 17.8”, fell far short of the 1971-2000 average of 27.6” and fell within the lower quartile of values for the entire period of record at that site. The year before, WY 2011 peak SWE, at 33.7”, was roughly double that of this WY 2012, and within the period of record’s upper quartile. Peak SWE 2012 also occurred very early in the season, on March 22nd, nearly one month earlier than the 1971-2000 average date of peak SWE of April 21st and two months earlier than the WY 2011 May 22nd date of peak SWE. Further, WY 2012 “snow all gone” (SAG) at Red Mountain Pass Snotel occurred four days earlier than the date of peak SWE in WY2011. Differences in peak SWE timing and amounts were less dramatic at the Lizard Head Pass Snotel between WY 2011 and 2012, but both seasons produced below average values of peak SWE.
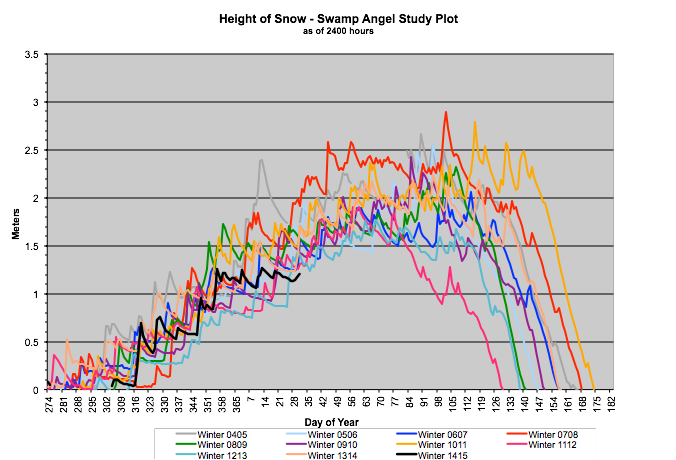
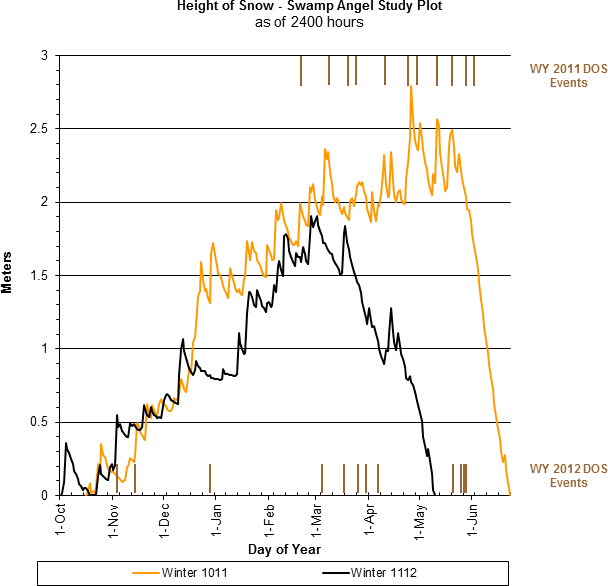
Height of snow (snowpack depth) data for Winters 2004/2005 through 2011/2012, in meters.
Snowpack data from the Center for Snow and Avalanche Studies’ Swamp Angel Study Plot (SASP) at 11,060’ in the Senator Beck Basin Study Area, 1 km north of the Red Mountain Pass Snotel, tell a similar story of year-to-year differences. The extremely well sheltered and relatively isolated, subalpine open meadow location of SASP provides an ideal site for monitoring undisturbed snowpack properties without the spatial variability introduced by wind redistribution of snow, tree shading, and human disturbance. SASP often benefits from light orographic precipitation occurring on the north side of Red Mountain Pass that does not reach the Red Mountain Pass Snotel site located just 1 km south of the Pass and at roughly the same elevation as SASP.
Hourly measurements of SASP snowpack depth show that WY 2012 snowpack depth peaked at 1.97 m (78”) on February 28th, 2012, our lowest season maximum to-date and 0.83 m (33”) less than and nearly two months earlier than the WY 2011 peak depth of 2.80 m (110”) on April 26th, 2011, our second deepest maximum depth. Snowpack total SWE is measured manually at SASP in weekly formal snowpack profiles. In Profile #20, on May 23rd, 2011 the snowpack contained 999 mm (39.3”) of SWE. Another 18 mm of additional snow precipitation fell at SASP the next day, increasing the actual WY 2011 peak SWE value for the season to near 40”. In contrast, profile #7, on March 26th, 2012 documented our highest measured SWE value for WY 2012 at just 542 mm (21.3”), not long after the only significant winter storm of March. Snowmelt at SASP outpaced additional snow accumulations after that date. Given the short period of record at SASP, no mean statistic for expected snowpack depth has been estimated to-date. Finally, these back-to-back winters also produced the earliest (WY2012) and latest (WY 2011) dates of “snow all gone” (SAG) at SASP, on May 11th and June 23rd, respectively.
Snowpack temperatures are also monitored at SASP, with an array of five automated thermistors monitoring the snow/ground interface and the snowpack above the ground at 10 cm intervals, with an infrared thermometer monitoring the snowpack surface “skin” temperature, and with a specialized digital thermometer during our routine snowpack profiles, at 10 cm intervals over the entire depth of snow. Based on those data, the SASP snowpack appears to have become isothermal at 0° C throughout on/about April 1st, 2012, at a depth of 121 cm (48”), a mean density of nearly 350 kg/m3 (35% water by volume) and with WY 2012 dust layers D6, D5, and D4 merged at the snowpack surface. The year before, the SASP snowpack was effectively isothermal on/about April 18, 2011 at a total depth of 202 cm (80”), with a mean density estimated at ~400 kg/m3 (40% water by volume) and with just one dust layer near the surface, D5-WY2011 (Profile #15). Extremely thick and tough ice layers in Profile #15 unfortunately prevented accurate SWE measurements, without damaging our equipment.
Given the substantially larger amount of total ice (snow) mass to warm to 0° C at SASP in spring 2011, compared to spring 2012, prolonged exposure of dust layers D4-8 at the snowpack surface in March and early April was likely the determining factor in producing an isothermal snowpack by April 10, 2012, two weeks earlier than in 2011, even despite considerably more clear nights in March and early April 2012, and commensurate radiant cooling of the snow surface, than in March and early April 2011, with scant clear nights.
Melt Rate
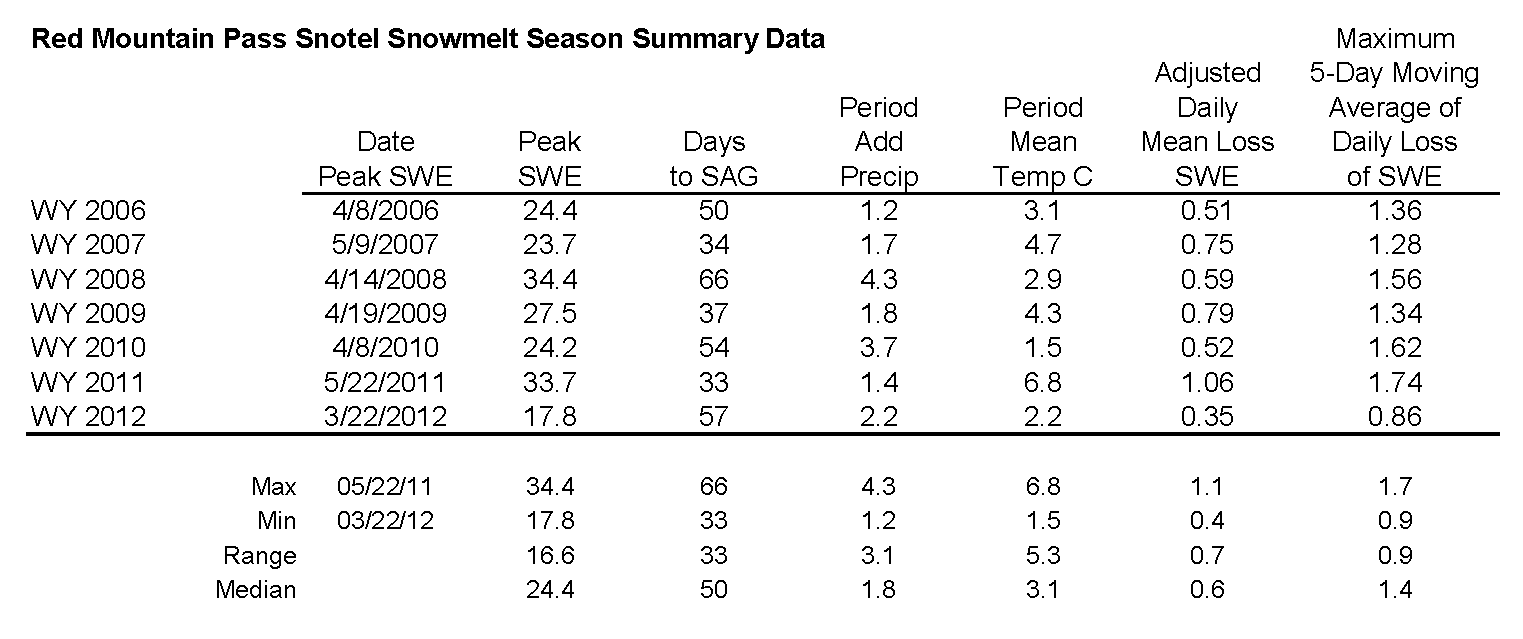
Analysis of Red Mountain Pass Snotel data for 2006-2012 snowmelt seasons showing date and quantity of peak SWE, days from peak SWE to “snow all gone” (SAG), total additional precipitation after date of peak SWE, an “adjusted” mean daily rate of snowmelt adding the additional precipitation to the peak SWE total, the maximum five-day moving average of daily melt, and the mean air temperature over the entire snowmelt period, from peak SWE to SAG. Taken as a whole, the spring 2012 snowmelt season produced the lowest mean daily melt rates measured at the Red Mountain Pass Snotel since 2006, at just 0.35” SWE loss per day.
This discussion references CODOS Snotel site data and analyzes rates of snowmelt from Spring 2006 to the present, spanning the period during which we’ve rigorously observed dust-on-snow at our Senator Beck Basin Study Area, at Red Mountain Pass. As discussed in prior CODOS Updates, Snotel sites typically exhibit a radiative regime where surrounding trees reduce the access of incoming solar radiation to snowpack over the SWE measuring snow pillow, and where re-radiation of long wave energy from that vegetation and a reduced skyview may sustain periods of surface snowmelt during nighttime hours. The Red Mountain Pass Snotel site does exhibit some of these complicating characteristics and, like many Snotel sites (Berthoud Summit Snotel is an exception), is not an ideal site for monitoring the maximum effects of dust-on-snow on snowmelt timing and rates, compared to the open meadow at Swamp Angel Study Plot where comparatively unimpeded solar access optimizes dust-enhanced snowmelt energy budgets. Comparison of snowmelt behaviors between the Red Mountain Pass Snotel site and the Swamp Angel Study Plot may inform the interpretation of Snotel snowmelt data when dust-on-snow is present at those Snotel sites.
During WY 2012, three fall and early winter dust storms were observed low in the snowpack at Senator Beck Basin. Event D3 was extremely faint at Senator Beck Basin and often not seen at all at other CODOS locations. While early season dust can result in loss of early season snowpack on south aspects, those three early events played only a small role in spring snowmelt, where November snow was still present at all. At the other end of the season, four dust-on-snow events fell after the date of SAG at our Swamp Angel Study Plot and many Snotel sites in WY2012. Those later dust events did nonetheless further reduce snow albedo on the remaining snowpack at higher elevations and on shady aspects in Senator Beck Basin and in the headwaters of the Uncompahgre, Animas, and Rio Grande watersheds nearby.
WY 2012 SWE accumulation and ablation at Red Mountain Pass Snotel, with upper and lower quartiles of period of record shown in light grey, middle quartiles in dark grey surrounding median trace for period of record, and mean trace for 1971-2000 period.
As the Snotel chart showing both WY 2011 and WY2012 clearly shows, snowmelt in late spring 2011 occurred in a single, steep plunge from peak SWE to SAG averaging just over 1” of SWE loss per day. In contrast, spring 2012 snowpack ablation actually occurred in two phases, at distinctly different rates. After two weeks without precipitation in early March, Storm #20 resulted in the season’s Peak SWE of 17.8” at the Red Mountain Pass Snotel, on March 21st and 22nd. Storm #20 also deposited dust event D5, which eventually emerged during the subsequent dry period and was augmented by D6 (March 26), D7 (April 1) and D8 (April 6). Low rates of snowpack ablation following Storm #8 resulted in some 3” of SWE loss by the 10th of April, an average rate of just 0.15” per day. Because of the moderate shading from adjoining trees at this site, and light snow on April 2nd, dust emergence was likely slower here than in open terrain (like Swamp Angel Study Plot) and snowpack warming to 0° C may have also been delayed into early April.
A period of unsettled and cooler weather in mid- and late-April, with winter Storms #21, 22 and 23, stalled the snowmelt cycle, adding some 2” of SWE and restoring higher snow albedo values to the snowpack. In early May dry weather resumed and SWE losses accelerated. Dust re-emerged under increasing solar inputs and unseasonably warm temperatures, prolonging overnight surface melt at this site since radiant cooling was inhibited by surrounding trees. The remaining 11.3” of SWE on May 1st were gone by May 18th, 2012 (coincidentally the date of dust event D9) for an average melt rate of 0.63” SWE per day during this second phase of snowmelt. May 18th was very nearly the earliest date in the entire period of record at the Red Mountain Pass Snotel for “snow all gone” (SAG), and was actually earlier than the date of peak SWE in the preceding spring of 2011 (SAG was on June 24, 2011).
As at the Red Mountain Pass Snotel, spring 2011 snowmelt at SASP began very late and occurred as a single, sustained, high-rate plunge from near-peak SWE to SAG. And, as at the Snotel, in 2012 SASP experienced a multi-phased snowmelt season consisting of three, rather than two, distinct episodes of increasingly rapid snowpack ablation.
No melt-freeze snow was observed in our March 5th profile #6, which contained considerable cold content. Snow profile #7 at Swamp Angel Study Plot, on March 26th, produced our highest measured SWE value for WY 2012 at 542 mm (21.3”), not long after Storm #20. In that profile we observed dust layer D5 in the Storm #20 new snow and substantial evidence of melt/freeze cycles in that and another near-surface layer. Later that day, dust event D6 fell onto the snowpack surface. On March 26th the snowpack was on the verge of becoming fully isothermal at 0° C throughout, and became isothermal in early April. Since melt energy contained in free water percolating down into the Swamp Angel Study Plot snowpack was still being consumed by the cold content of the underlying snowpack, and warming that snow to 0° C, little or no snowmelt discharge was exiting the SASP snowpack in March. Despite that, some losses of SWE very likely occurred at the snowpack surface through sublimation and evaporation during prolonged periods of dust exposure in March (see the Open Questions below). Meanwhile, the Senator Beck Basin stream gauge registered an uptick in flows beginning on March 24th, fed by actively melting south-facing slopes in the lower elevations of Senator Beck Basin near SASP, where the snowpack had long-since become isothermal and dust was extensively exposed.
As the SASP snowpack approached isothermal, and dust layers D6 and D5 merged at the snowpack surface, SWE losses dramatically accelerated in a second phase of snowmelt. Profile #9, on April 2nd, showed a loss of 117 mm (4.6”) of SWE in the seven days since Profile #7, a loss averaging 0.66” per day.
Stormy weather resumed on April 11th and contributed 74 mm (2.9”) of precipitation (SWE) to the snowpack in a series of three dust-free storms that temporarily buried merged layers D6/D5 and restored higher snow albedo to SASP. Nonetheless, the snowpack remained isothermal, some melt continued to leave the snowpack, and the merged dust layers re-emerged at the surface. On April 30th, just 283 mm (11.1”) of SWE remained in the snowpack, down from the 425 mm (16.7”) measured on April 2 in Profile #9. That difference of 142 mm (5.6”), plus the 74 mm of additional SWE that fell during April, results in a net loss of 216 mm (8.5”) of SWE during April, at an average of 0.29” per day, even with 15 days of recorded precipitation (and corresponding reductions in solar inputs).
The final phase of SASP snowpack ablation began at the end of April. By May 11th, SASP recorded “snow all gone” (SAG), losing all of the 283 mm of SWE measured April 30th plus an additional 8 mm of new precipitation, for a net loss of 291 mm (11.5”) of SWE in 11 days, an average rate of 1.04” loss per day.
When evaluated as a single snowmelt cycle, comparable to the Red Mountain Pass Snotel analyses in the table above, SASP required some 56 days to ablate, to SAG, 542 mm (21.3") of SWE measured March 26th plus 94 mm (3.7") of subsequent additional snow precipitation, for a total of 638 mm (25.1”), at an average of 11.4 mm (0.45”) of SWE loss per day, or 129% of the 0.35” rate of daily SWE loss at the nearby Red Mountain Pass Snotel site. Although this analysis examines just one snowmelt cycle, and the proportion of increase in melt rate at SASP is likely to vary from year to year, these data may suggest the magnitude of difference in melt rates, given roughly equivalent snowpack and dust loading, between shaded and open sites.
Stream Flows
Senator Beck Basin is a 219 acre headwater catchment of the Uncompahgre River. The southern boundary of Senator Beck Basin adjoins Mineral Basin, a headwater catchment of the Animas River, and the western boundary adjoins Ingram Basin, a headwater catchment of the San Miguel River. Senator Beck Basin is just 13 miles northwest of the Rio Grande headwaters near Stony Pass.
Under its US Forest Service Special Use Permit for Senator Beck Basin, CSAS installed the Senator Beck Stream Gauge (SBSG), a broad-crested, notched, concrete weir structure, at the pourpoint of Senator Beck Basin in fall 2004. Automated stage, water temperature, and electrical conductivity sensors capture hourly and 24-hour summary data. Manual discharge measurements by State of Colorado technicians were utilized by the original contractor to develop the SBSG discharge function over the subsequent two seasons and data begin in WY 2005. In June 2012, a manual measurement of discharge performed immediately upstream of the weir by a USGS technician, at SBSG stage of 0.68’ feet, found a 7% variance between the calculated SBSG discharge (4.99 cfs) and the manual measurement of discharge (4.66 cfs).
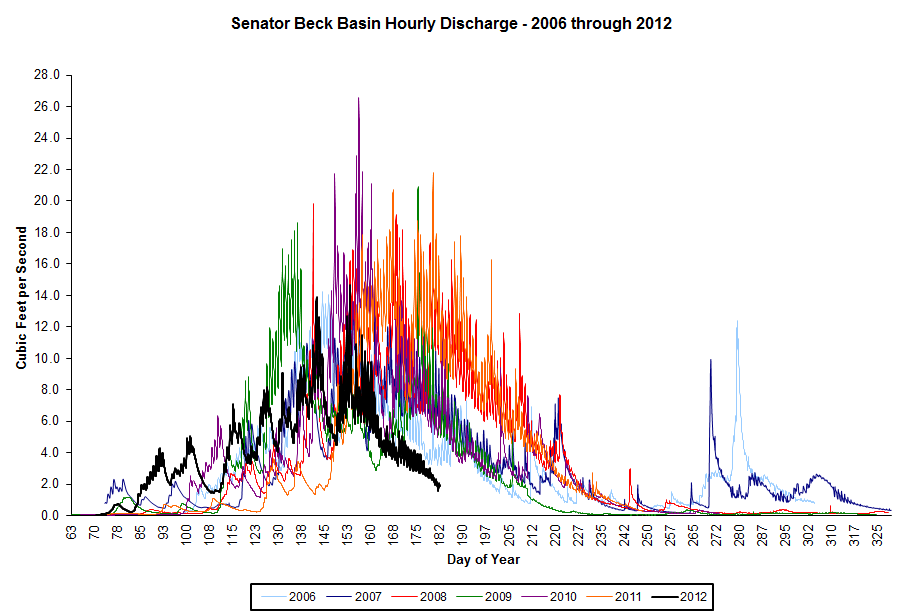
Hourly discharge, by day of year, at the Senator Beck Stream Gauge for spring, summer and fall of 2005 through 2012 (to-date). Automated sensors begin measurements in March, to prevent freezing damage during winter months. The plot below extracts WYs 2011 and 2012 from the plot above, for clarity.

Senator Beck Basin Discharge Chart 2011-2012
Spring 2012 snowmelt runoff at SBSG produced a series of small surges above base flow in March, as the snowpack on south-facing slopes in lower Senator Beck Basin became isothermal and dust-enhanced snowmelt quickly consumed the shallow snowpack. Runoff gradually accelerated in April, as more aspects and elevations became isothermal and merged dust layers D5/D4 periodically emerged between fresh snowfalls. Basin snowpack rapidly decreased in early May, with SAG at our alpine Senator Beck Study Plot (12.180’) on May 22nd. Dry, sunny weather in late May produced a two-part final surge in runoff, interrupted by an interlude of colder weather driven by a dry and very windy intrusion of cold air and the final dust event of the season, D12, on May 26th.
Just as we observed in Senator Beck Basin snowpack formation and ablation, the past two spring runoff seasons also produced extremes of Basin streamflow behavior. Although spring 2009 produced our highest observed instantaneous flows, spring 2011 stands apart as our most delayed runoff cycle, with snowpack persisting in Senator Beck Basin into July as monsoon rains arrived and, along with dust-on-snow, completed the snowmelt cycle. Spring 2012 snowmelt runoff at SBSG began fully forty days earlier than in 2011 and was rapidly waning by early June, just as 2011 was beginning to peak. Spring 2012 will show the lowest net yield from snowmelt in our period of record at SBSG.
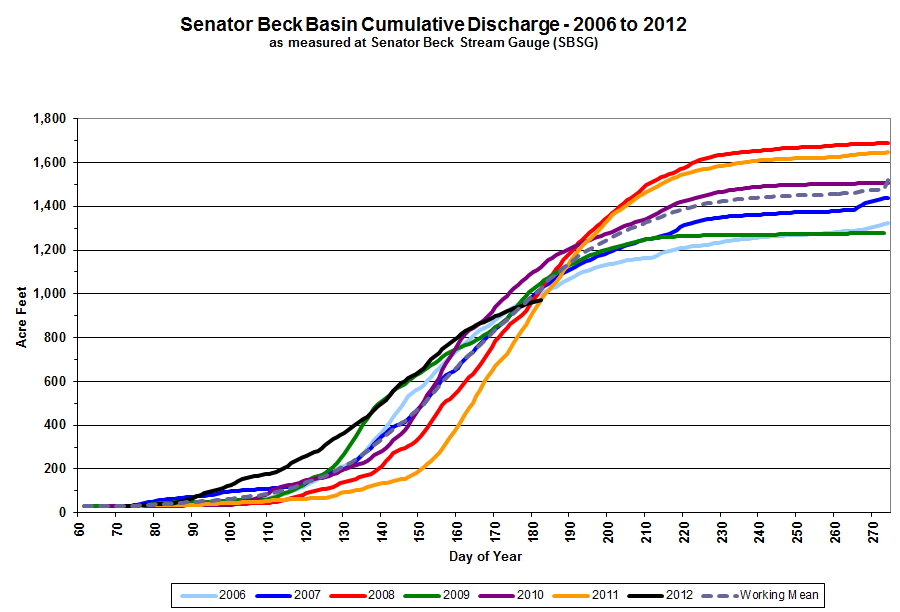
Cumulative discharge at the Senator Beck Stream Gauge (SBSG) for spring, summer and fall 2006-2012, with a “working mean” shown. Water Year 2012 snowmelt discharge has lagged well behind all prior seasons.
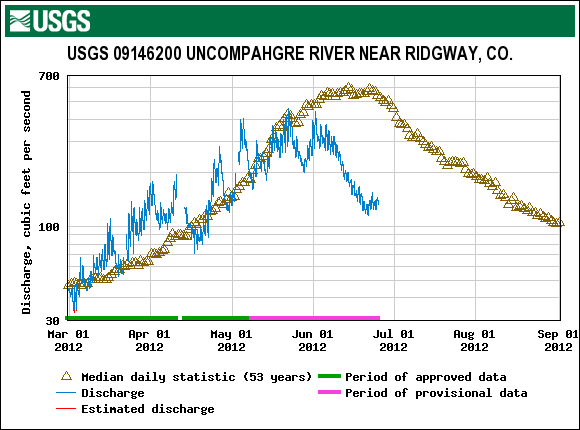 WY 2012 USGS Uncompahgre River near Ridgway Stream Gauge data for a 149 sq. mi. drainage area in the Uncompahgre River watershed, above 6,878’. Current year and historic data reflect withdrawals for irrigation upstream.
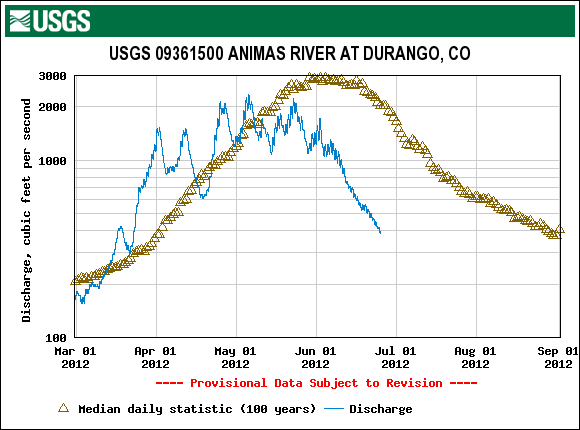
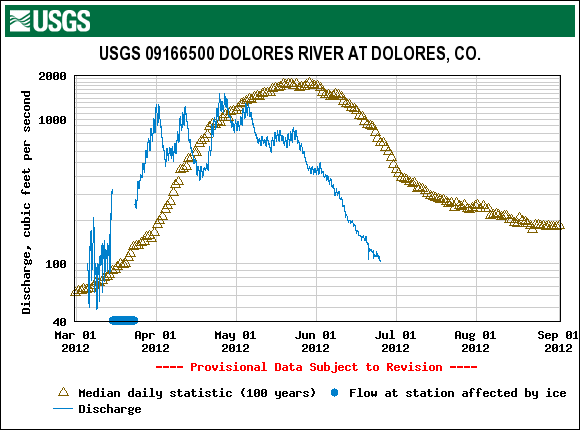
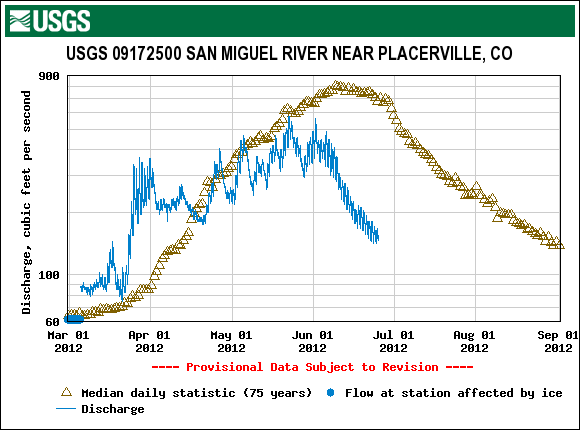
Farther downstream, data at the USGS Uncompahgre River near Ridgway gauge mirror the early and reduced snowmelt runoff observed at SBSG, although snowmelt at the lower extremes of snowpack in the watershed produced even earlier elevated flows there. March and early April saw well above average discharge levels for that period until dropping back to median levels during the stormy weather of mid-April. Subsequent episodes of dust-enhanced surging and retreat followed. By mid-May, snowpack had been substantially ablated in the watershed. Peak runoff on May 23rd arrived several weeks in advance of the median normal peak flow date. A steep decline in June rapidly dropped to flow levels normally seen in mid-August. Overall, this hydrograph presents an advance in the timing of WY 2012 runoff, with the center of the substantially reduced runoff mass occurring several weeks earlier than normal. Hydrographs for the Animas, Dolores, and San Miguel rivers show very similar, if not more pronounced, changes in timing and total runoff volume.
Open Dust-on-Snow and Snow Hydrology Questions
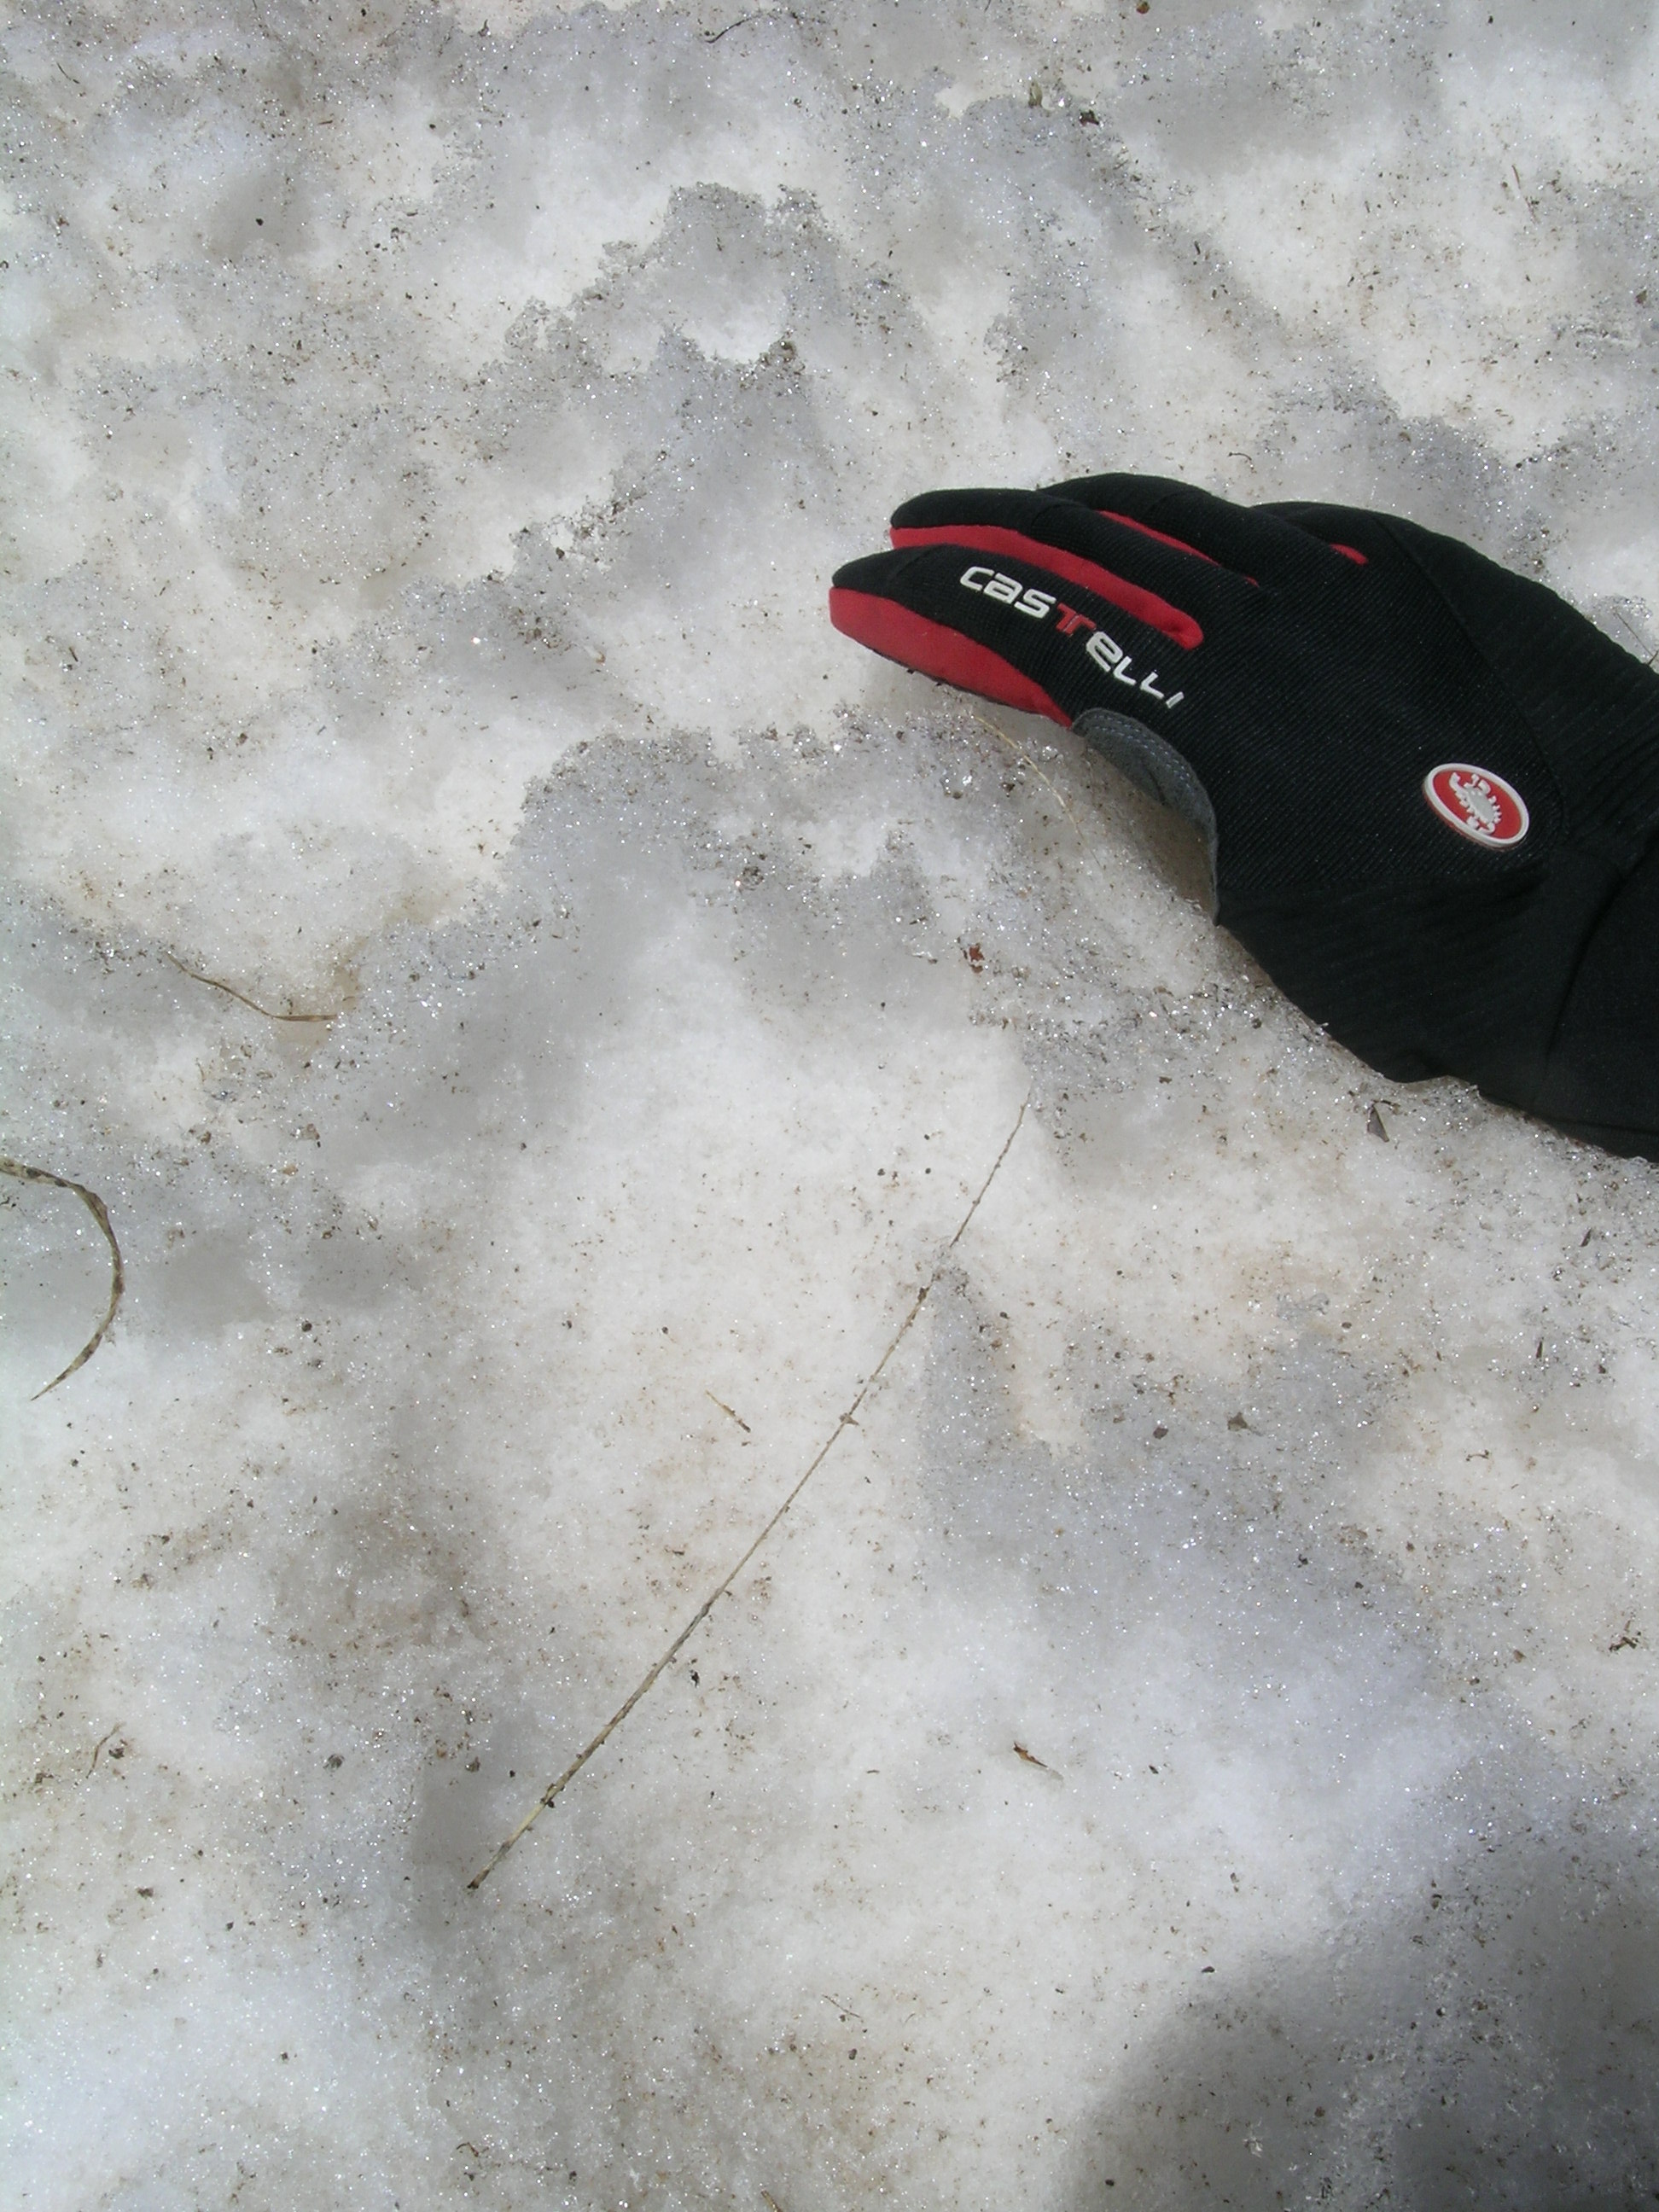
Dust-on-snow frequently produces additional roughness at the snowpack surface that may enhance both sublimation and evaporation of ice and free water. In this photo, taken May 28th, 2012 near Senator Beck Study Plot, several inches of vertical relief exists in this surface and aggregated clumps of dust can be seen in the tips of the complex ice matrices comprising those formations. Free water is present within the matrix, and the matrix includes voids and gaps where air can pass through and over these ice structures.
Sublimation of snow/ice, from the solid phase directly to the vapor phase, has long been recognized as a source of SWE losses in mountain snowpacks. In the course of our several seasons of dust-on-snow fieldwork at Senator Beck Basin, and elsewhere in Colorado, CSAS has observed that dust-on-snow can result in increased and patterned surface roughness in the snowpack surface, as dust emerges and enhances melt. The photo to the right illustrates incipient sun cup formation, and prior Updates have shown more advanced stages of this form of dust-enhanced roughness. Dust entrained in new snow is especially prone to developing complex structures including incipient snow penitentes in tightly spaced, regular rows oriented toward the solar zenith.
Our sense is that this additional dust-induced surface roughness may enhance rates of both sublimation of ice and evaporation of melt water. Unfortunately, those processes and their actual effects on snowmelt runoff yields are extremely difficult to monitor in the field and CSAS does not now have the resources to support the very challenging snowmelt modeling required to better understand these effects, using Senator Beck Basin data and observations.
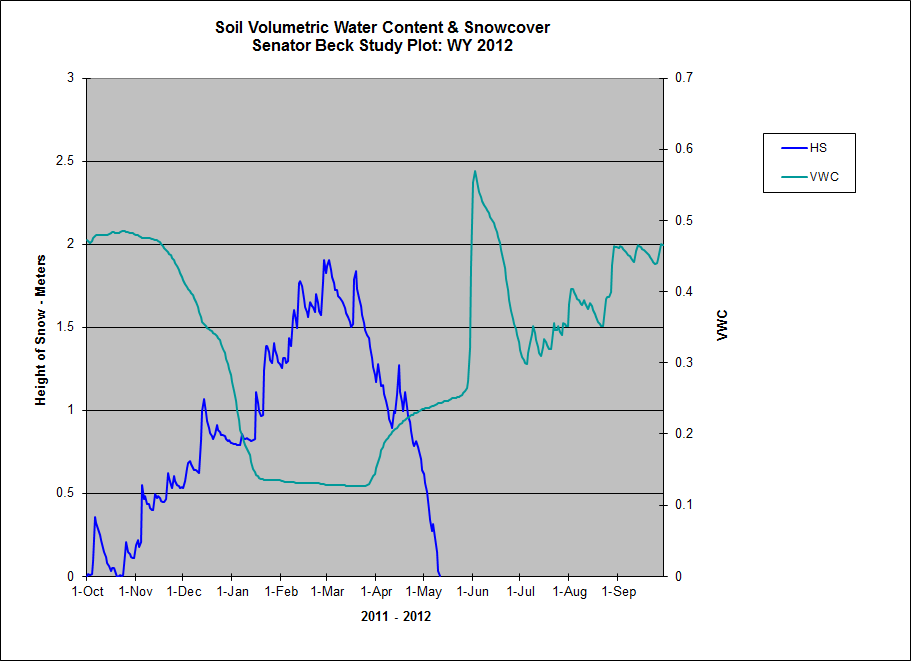
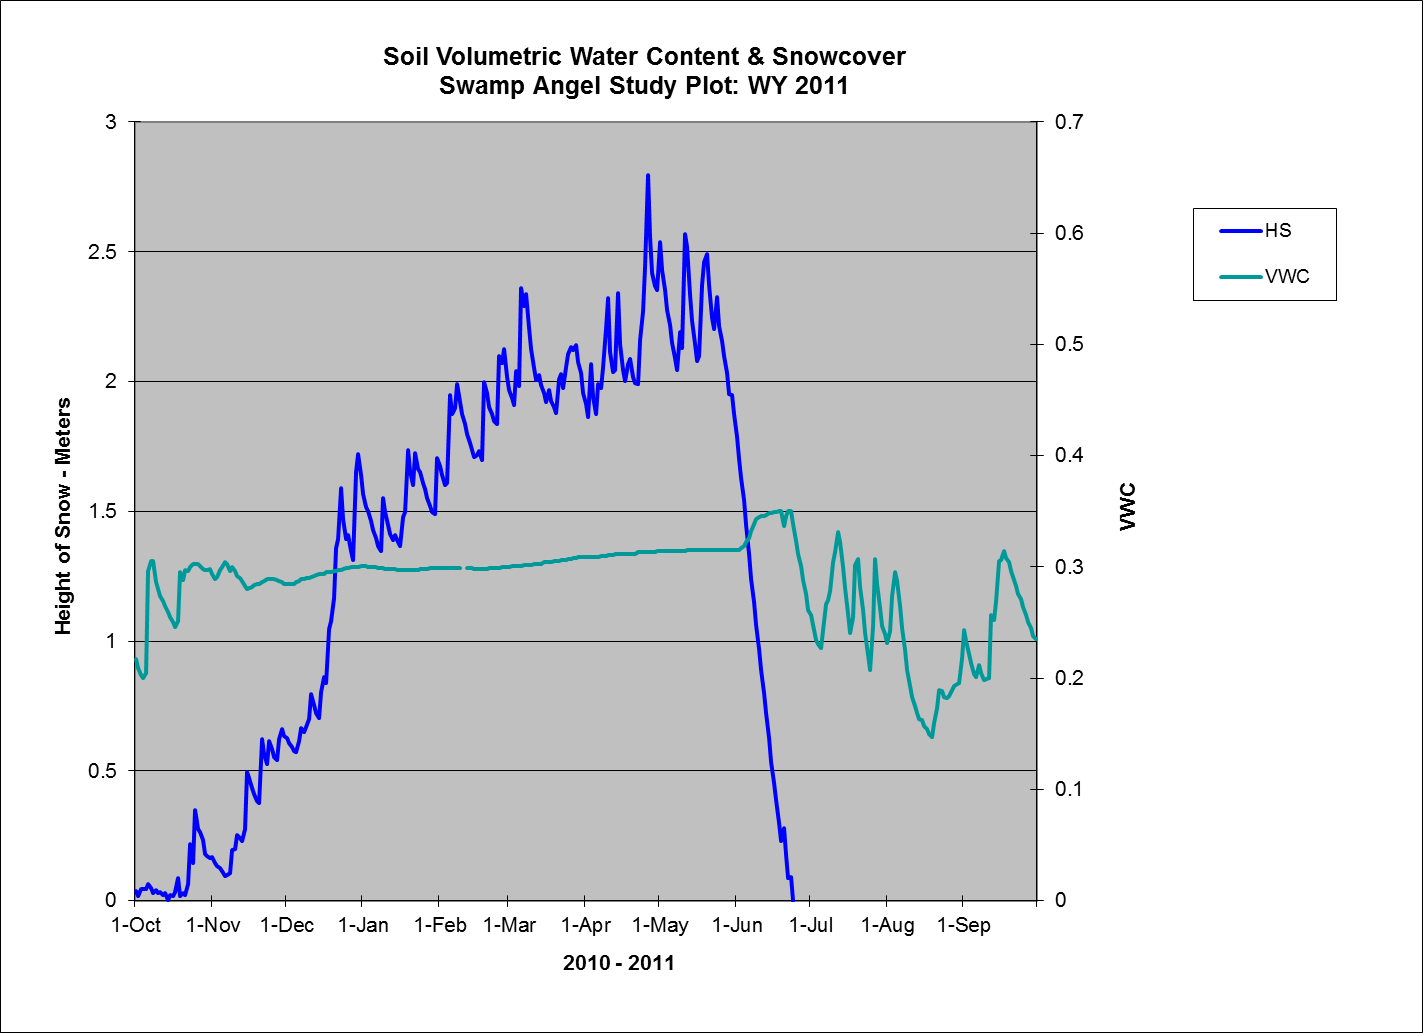
Similarly, soil moisture conditions are also understood to influence snowmelt runoff yields, particularly antecedent, fall conditions. Soil moisture (volumetric water content, or VWC) at 4” below the surface, soil heat flux at the surface, and soil temperatures at several depths are continuously monitored at both our subalpine Swamp Angel Study Plot (SASP) and our alpine Senator Beck Study Plot (SBSP) in Senator Beck Basin. While several years of data from SASP do show significant VWC carryover from fall to spring, our SBSP data show significant losses of fall VWC during early winter. These two study sites have very different soil characteristics that are generally representative of alpine and subalpine soils at Senator Beck Basin, with deep, gravelly soil at SASP compared to very shallow soil at SBSP. Colorado generally exhibits cold and shallow “continental” snowpacks, versus the warmer and deeper maritime and intermountain snowpacks to our west. Because SBSP is in an exposed alpine tundra location, wind effects often result in an even thinner snowpack at SBSP and in the surrounding alpine terrain than at the well-sheltered, SASP site and its surrounding subalpine terrain.
Water Year |
Swamp Angel Study Plot (subalpine) |
Senator Beck Study Plot (alpine) |
WY 2012 (in progress) Oct 1, 2011 - June 27, 2012 |
 |
 |
WY 2011 Oct 1, 2010 - Sept 30, 2011 |
 |
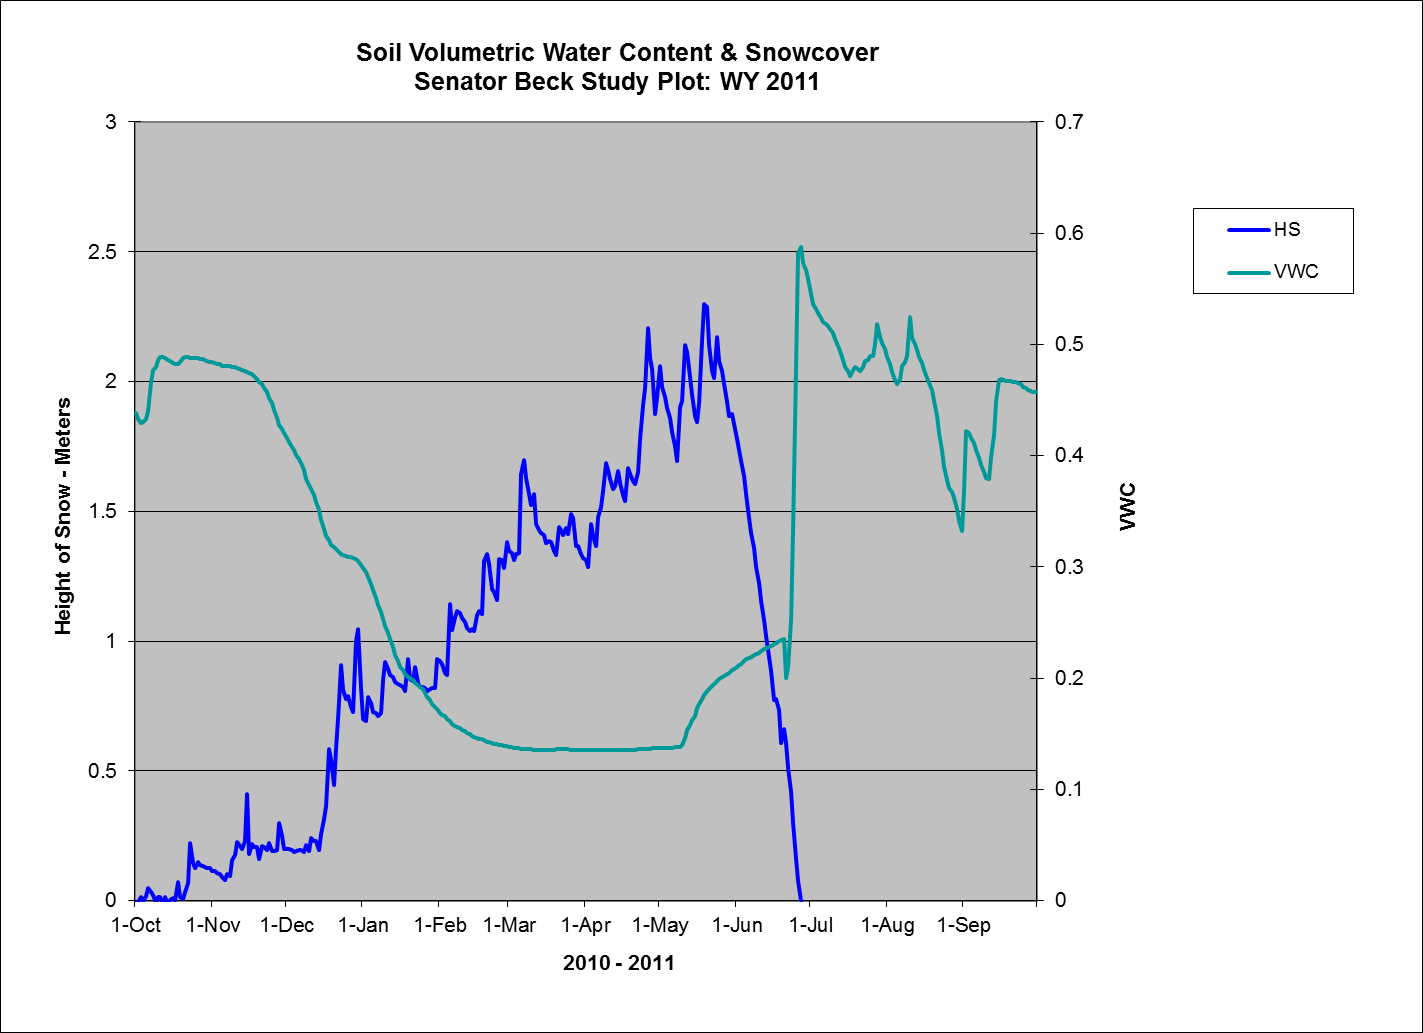 |
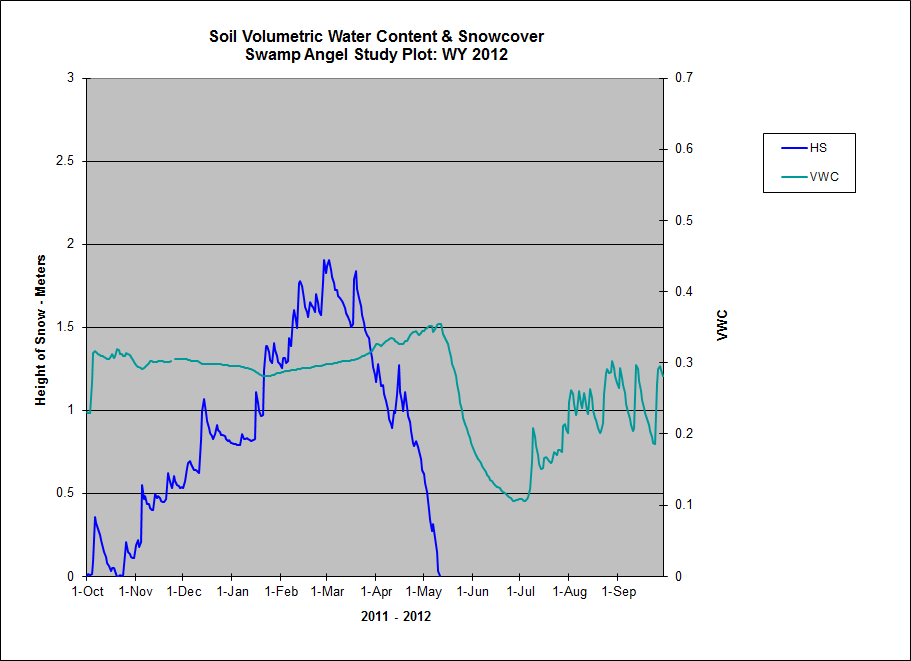
Soil volumetric water content (VWC), measured 4” below the soil surface, and snowpack depth are shown for the subalpine Swamp Angel Study Plot and alpine Senator Beck Study Plot for Water Years 2011 (complete) and 2012 (in progress). Note the rapid drying of soils at both sites in early summer 2012. See snowstudies.org/data/graphs/soil_VWC_snowpack.html to view data for all years since 2006.
Deeper soil at SASP may retain a large reservoir of moisture that replenishes near-surface VWC during early winter, counteracting the water vapor pressure gradient drawing vapor from the relatively warmer soil into the colder snowpack. As the snowpack approaches a meter in depth, stabilizing the soil/snowpack temperature gradient, that vapor pressure gradient also stabilizes leaving substantial VWC in near-surface soil. In contrast, our sense is that the comparatively small reservoir of moisture in the much thinner alpine soils at SBSP is being depleted, and cannot sustain VWC in near-surface soils during fall and early winter. Strong water vapor pressure gradients draw moisture from the warmer soil to the snowpack until the snowpack there also approaches a depth of a meter or more.
Curiously, VWC at SBSP also shows some rebound in late winter, during snowpack, that is not occurring at SASP. We do not understand that difference. SBSP also shows a significant increase in VWC at snow all gone that is not matched at SASP. That surge is clearly related to short term sheet flow and pooling of snowmelt water during final melting around SBSP. Because Colorado has a high elevation mountain system, with a substantial proportion of SWE accumulation on thin soils above treeline, these consistent differences in VWC carryover behavior may be important to understanding and forecasting alpine snowpack snowmelt yields.
Finally, as discussed above, the last two winter seasons took place under back-to-back La Niña conditions. Does a relationship exist between ENSO states, or other hemispheric-scale climatic drivers, and the kinds of synoptic-scale wind field formation that favors dust mobilization and emission from the Colorado Plateau exist, and could this be a predictive parameter of wind field characteristics favoring or disfavoring dust storms in Colorado? Our history of rigorous dust-on-snow deposition and wind monitoring at Senator Beck Basin is still short, but perhaps sufficient to begin exploring that question with researchers interested in the climatology of wind in the western US, and how regional climate change might alter wind behavior and desert dust emissions.