 Water Year 2012 CODOS Summary for
Berthoud Summit
Water Year 2012 CODOS Summary for
Berthoud Summit
Summary | Snowpack & Dust | Melt Rates | Stream Flows
Summary
Water Years 2011 and 2012 produced a case study in interannual variability of Colorado snowpack formation and ablation driven by vastly different late winter and spring conditions, perhaps representing seasonal extremes. On the other hand, overall, the two seasons produced comparatively similar dust-on-snow conditions in the Colorado mountains. Unusually sustained, stormy winter weather in spring 2011 resulted in relentless snowfalls postponing sustained dust-on-snow effects until very late into the season, in early June. Dust did eventually enhance high runoff rates from historically large or, at some locations in the northern mountains, record-breaking snowpacks.
In dramatic contrast to WY 2011, extremely dry late-winter and spring weather conditions in 2012 resulted in very low values of peak SWE and an unusually early and dust-enhanced start to snowpack ablation. Beginning in March, dust-on-snow layers remained exposed at the snowpack surface for prolonged periods, absorbing enough additional solar energy to initiate and enhance snowmelt and runoff well in advance of long-term average timing. In conjunction with sub-par snowpacks, this dust-enhanced radiative forcing then generated a well-below-normal peak in snowmelt runoff well ahead of normal timing, followed by a rapid decline in runoff flows in June to levels normally observed in late summer.
SnowPack & Dust
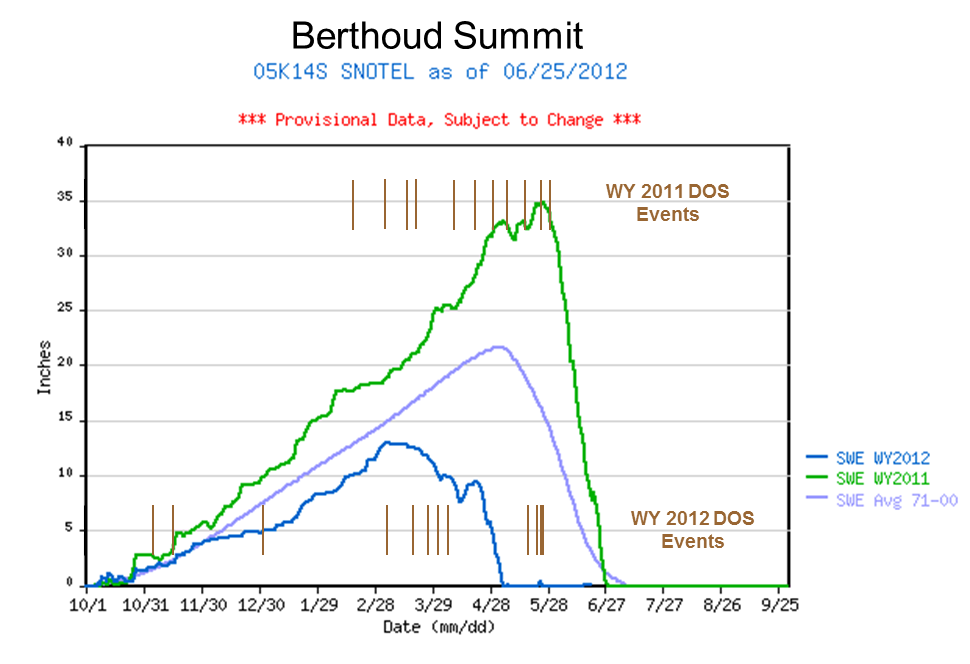
Berthoud Summit Snotel SWE accumulation and ablation for Water Years 2011 and 2012, with dust-on-snow events shown, by date, as brown bars for both water years (as observed at the Senator Beck Basin Study Area).
Water Year 2012 snowpack formation at the Berthoud Summit Snotel began at near-average rates in early winter before slipping into the lower quartile of cumulative SWE values by mid-winter (see Snotel projection plot below). Due to the very dry late-winter and spring experienced throughout Colorado, WY 2012 peak SWE, at only 13.0”, fell far short of the 1971-2000 average of 21.7”. Peak SWE also occurred very early in the season, on March 6th, nearly two months earlier than the 1971-2000 average date of peak SWE of May 3rd and fully 81 days earlier than the extremely late date of peak SWE during WY 2011. Further, WY 2012 “snow all gone” (SAG) at Berthoud Summit occurred three weeks before the date of peak SWE in WY 2011.
The total number of dust-on-snow events in WYs 2011 and 2012 (at 11 and 12, respectively) and their total mass of dust loading (at 14 and ~10-12 grams per square meter) were similar (see the Senator Beck Basin dust log discussion). Despite those similarities, diametrically different late winter and spring weather during the past two seasons resulted in dust having very different effects on snowmelt processes at Berthoud Summit and throughout the State.
Eleven dust events occurred at Senator Beck Basin in the late winter and spring of 2011, many of which were confirmed in the Front Range. However, relentless accumulation of late winter and spring snow buried new dust layers and frequently restored high snow albedo values, until the end of May. That sustained winter-like weather also added to and conserved the substantial snowpack cold content measured in our March 31st, 2011 snowpit at Berthoud Summit. Subsequently, prior to our April 24th, 2011 snowpit that snowpack had become isothermal. Eventually, on May 29th, 2011 the final and perhaps largest dust event of the season was deposited on the surface of what was effectively Peak SWE and sustained sunny weather replaced the stormy regime. Rapid snowmelt began immediately and dust layers quickly merged and remained fully exposed to maximum rates of incoming radiation, as the summer solstice approached.
Because late winter and spring 2012 were exceptionally dry, with widely spaced and comparatively small winter storms (see the Senator Beck Basin winter storm discussion), dust-on-snow event D4-WY2012 on March 6th and subsequent dust events that merged with and enhanced D4 were only occasionally and briefly buried under clean new snow. Although dust loading and reductions in snow albedo at Berthoud Summit were somewhat less intense than at the Senator Beck Basin Study Area, the reduction in snow albedo was sufficient, over the extended periods of dust exposure to incoming radiation, to result in advancing the rate of snowpack warming to 0° C throughout. Then, once isothermal, all additional energy absorbed by dust at the snowpack surface resulted in enhanced rates of snowmelt and snowpack ablation.
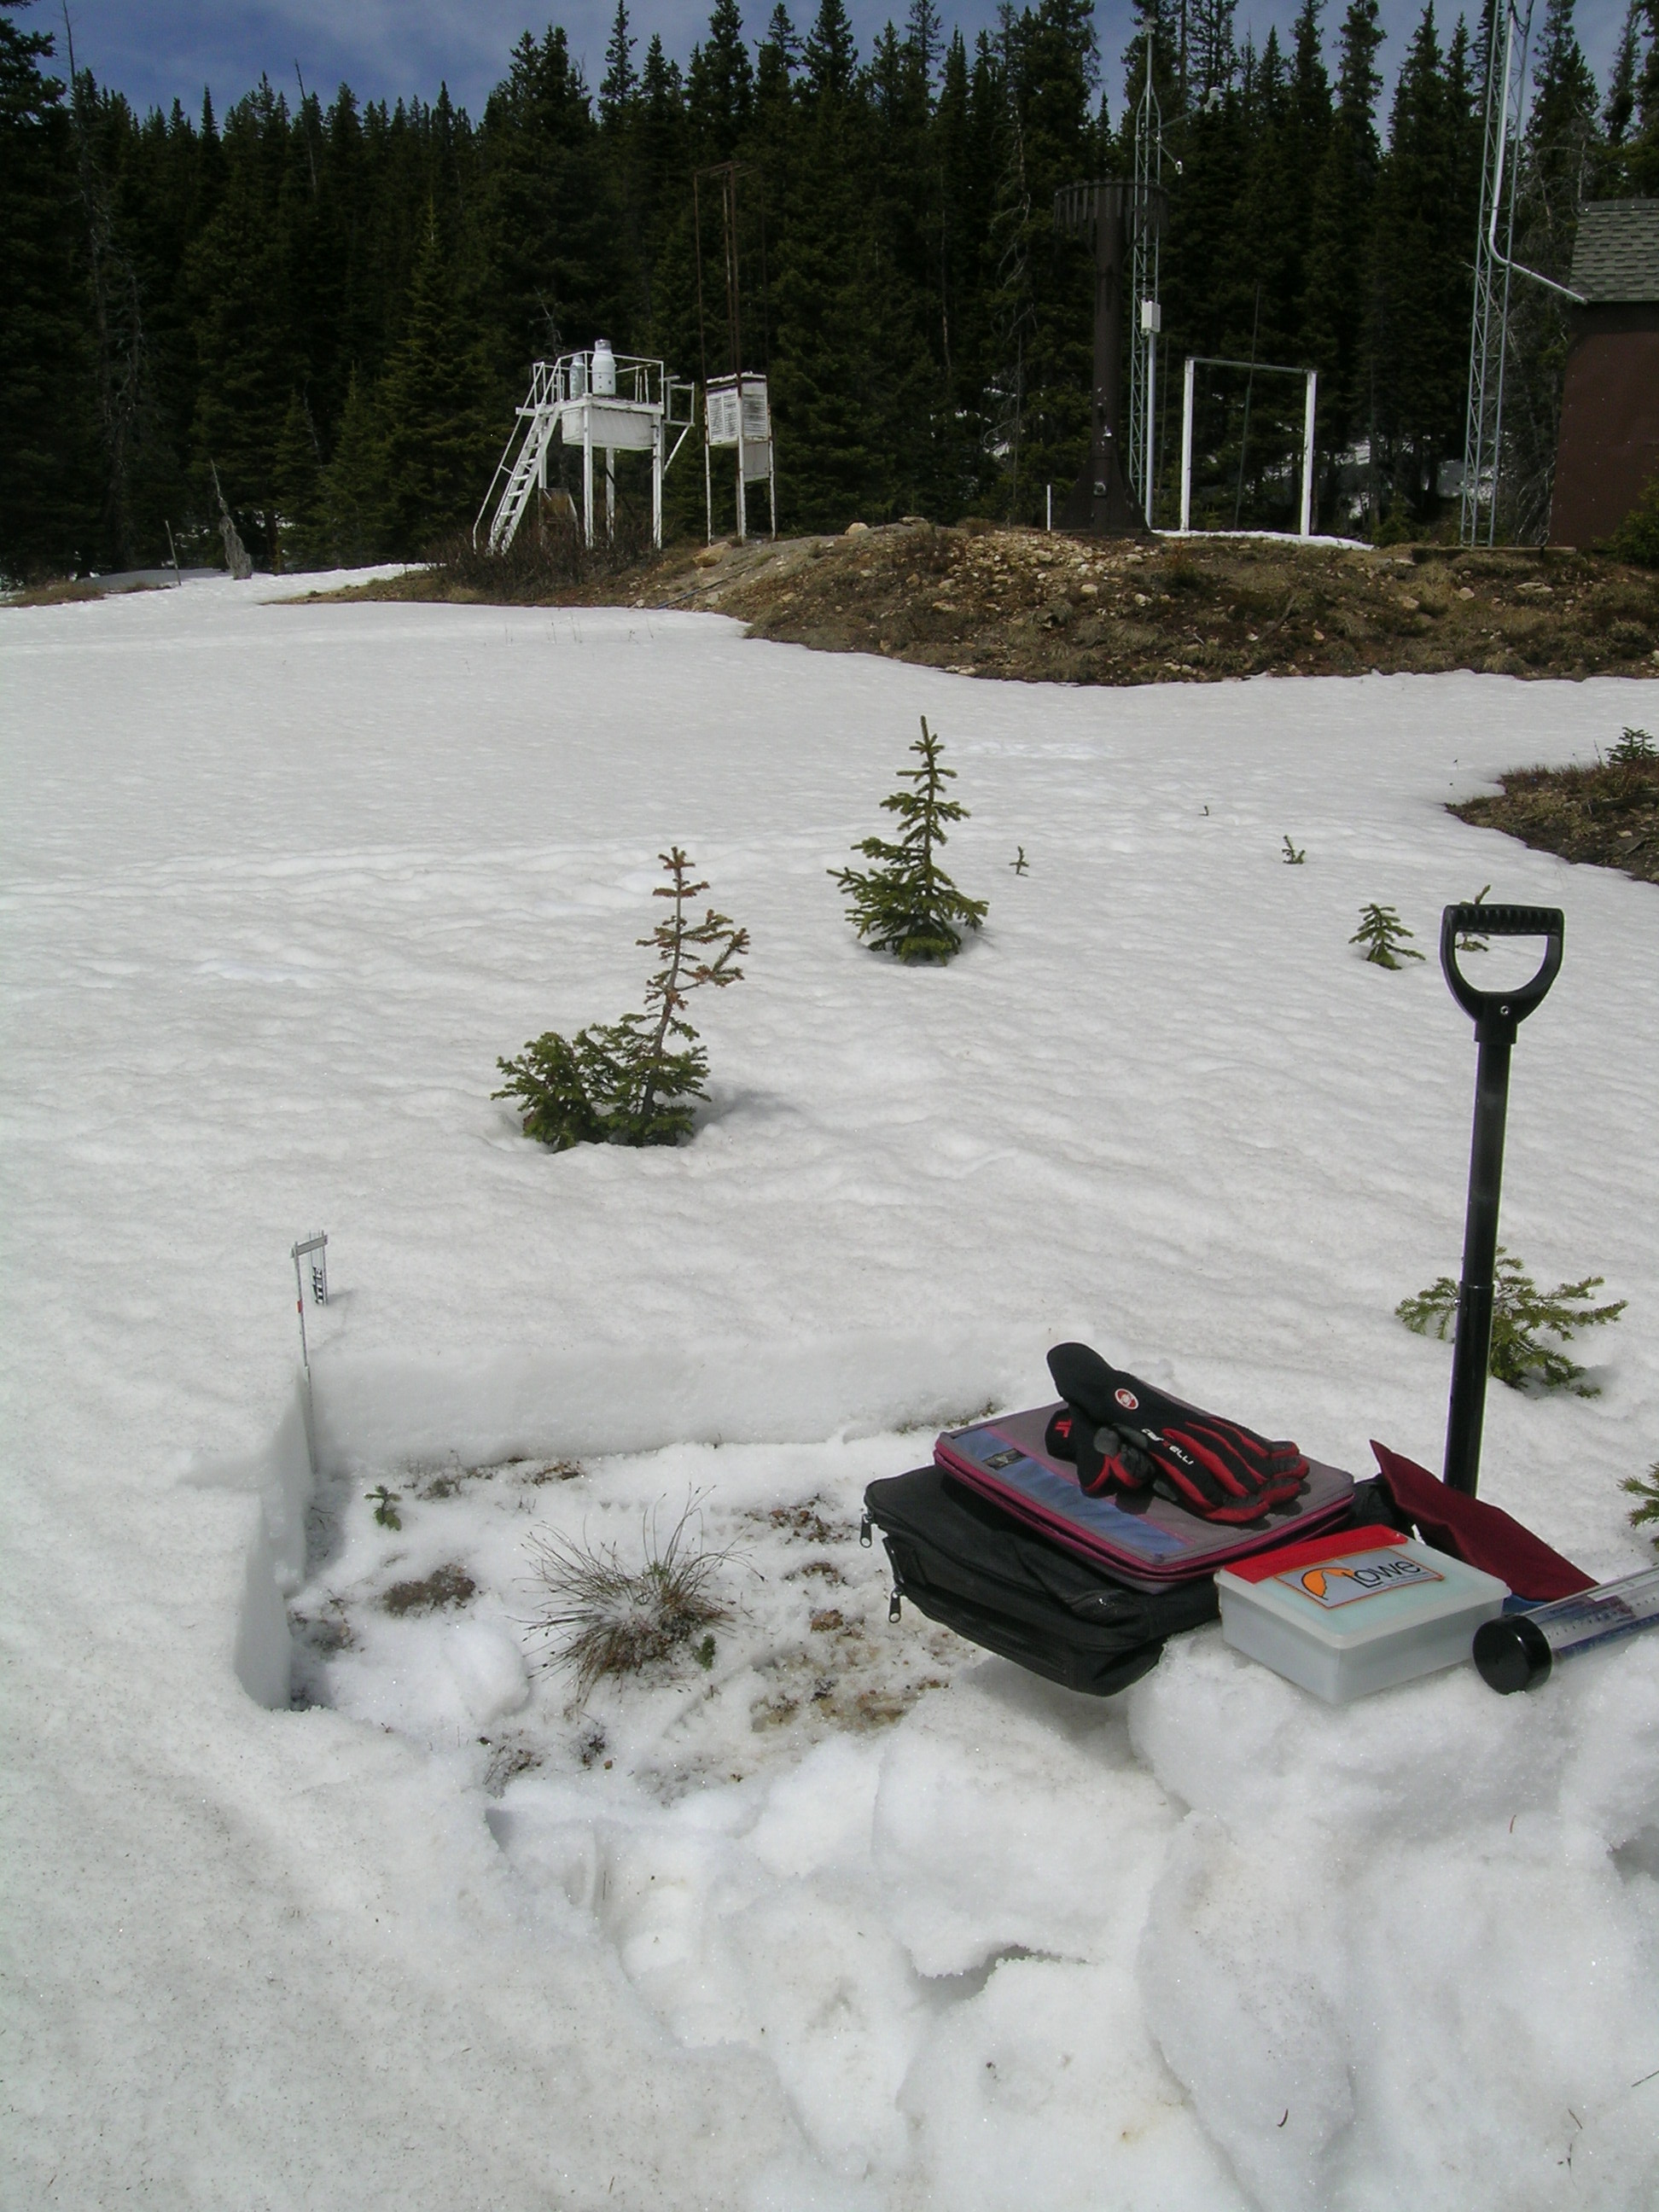
Since snowcover ablation at Berthoud Summit began in early April or May, mean air temperature over the entire snowmelt period, to SAG, was comparatively cool, despite episodes of unseasonably warm weather (see table below). Nonetheless, given the minimal snowpack, and the sustained periods of dry, sunny weather supporting the dust-enhanced radiative forcing of snowmelt, the Berthoud Summit Snotel recorded the earliest date of SAG in its period of record, even before the final four dust events of the season could further lower snow albedo. Those later dust events did nonetheless fall onto and further reduce snow albedo on the remaining higher elevation, alpine snowcover in the Berthoud Pass locale.
Melt Rates
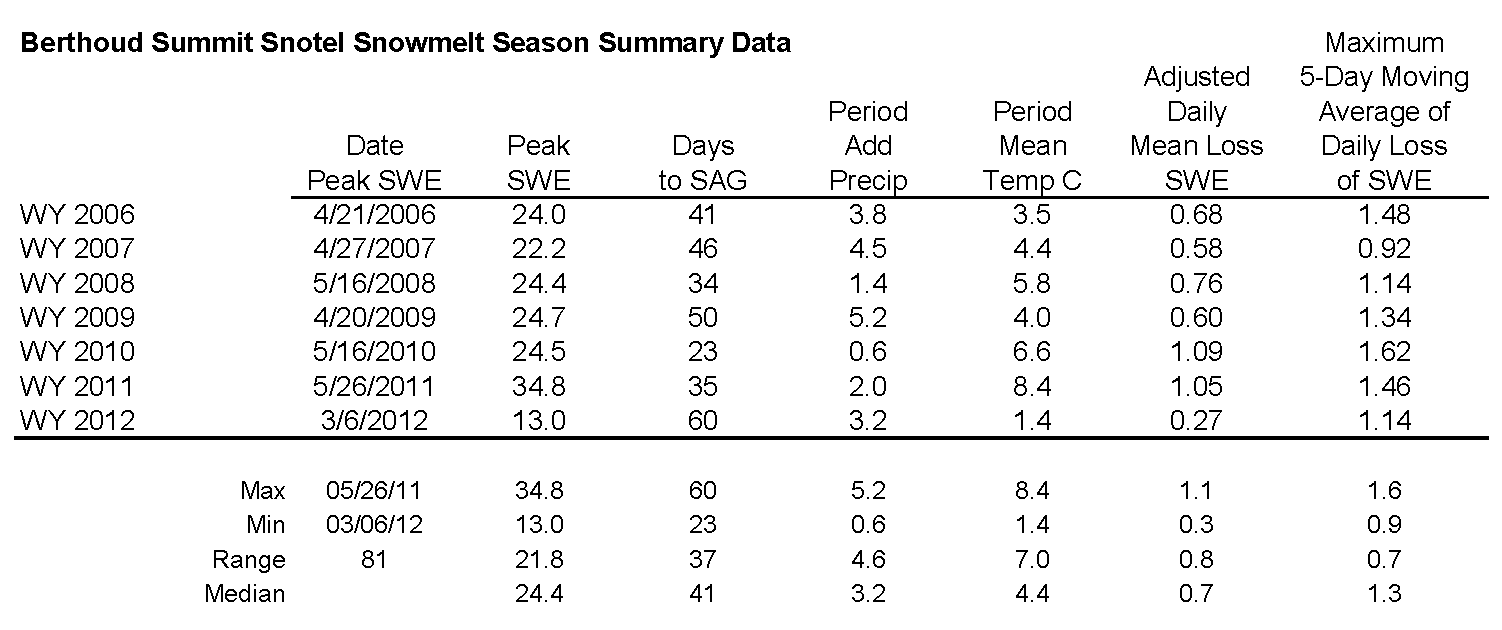
Analysis of Berthoud Summit Snotel data for 2006-2012 snowmelt seasons showing date and quantity of peak SWE, days from peak SWE to “snow all gone” (SAG), total additional precipitation after date of peak SWE, an “adjusted” mean daily rate of snowmelt adding the additional precipitation to the peak SWE total, the maximum five-day moving average of daily melt, and the mean air temperature over the entire snowmelt period, from peak SWE to SAG.
This discussion references CODOS Snotel site data and analyzes rates of snowmelt from Spring 2006 to the present, spanning the period during which we’ve rigorously observed dust-on-snow at our Senator Beck Basin Study Area, at Red Mountain Pass. As discussed in prior CODOS Updates, Snotel sites typically exhibit a radiative regime where surrounding trees reduce the access of incoming solar radiation to snowcover over the SWE measuring snow pillow, and where re-radiation of long wave energy from that vegetation and reduced skyview may sustain periods of surface snowmelt during nighttime hours. Therefore, Snotel sites are not an ideal site for monitoring the maximum effects of dust-on-snow on snowmelt timing and rates, as compared to generally level, open meadow sites where solar access is unimpeded and snowmelt energy budgets and snowpack ablation are measured. Nonetheless, the Snotel network is the only spatially extensive system monitoring snowmelt throughout the Colorado mountains and year-to-year comparisons of Snotel melt rate data may yield insights into dust effects on local watershed-scale processes.
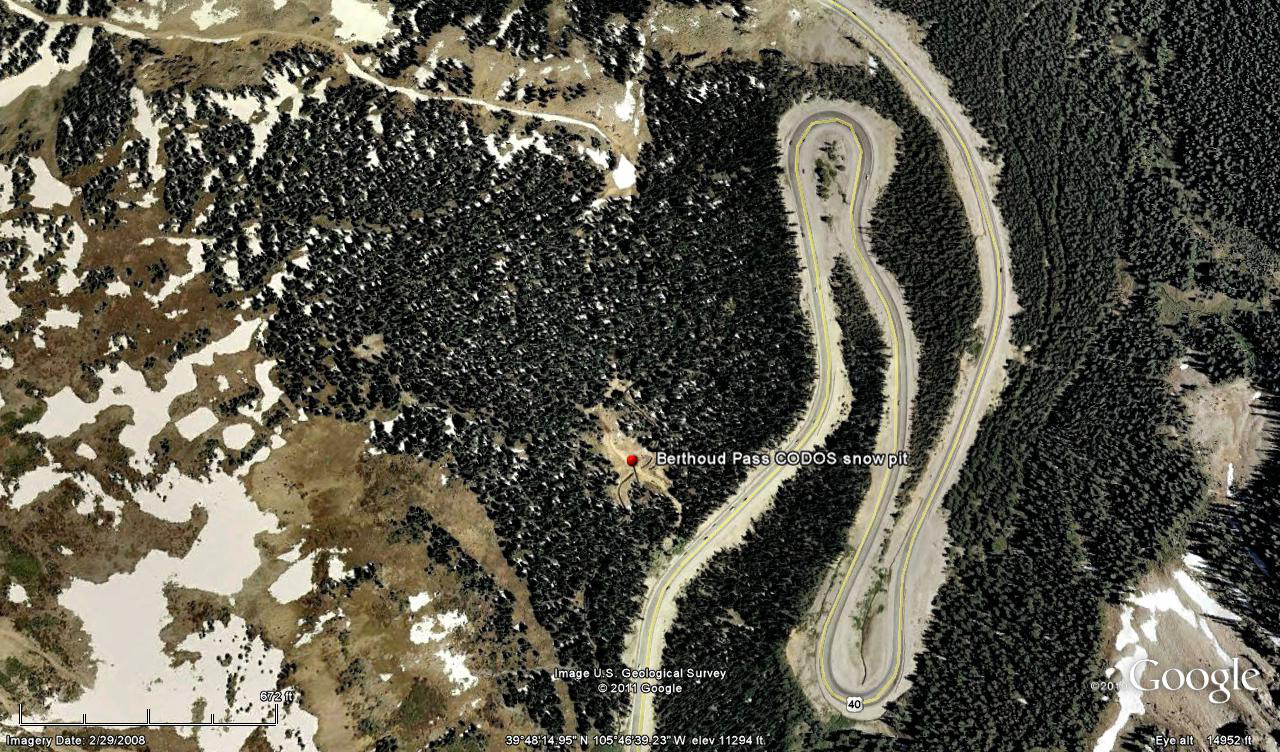
Berthoud Summit is an exception to the rule. The open, unshaded location of the Berthoud Summit Snotel, in an east-facing clearing just a few yards from our CODOS snowpit site, does afford nearly full solar access to the snowcover over the snow pillow. As a result, the influence of dust on melt rates at this Snotel site is more similar to nearby open terrain than at most Snotel sites.
During WY 2012, three fall and early winter dust storms were observed at Senator Beck Basin and were found low in the snowpack there and at other CODOS sites. While early season dust can result in loss of early season snowcover at lower elevations and on south aspects, those three early events played only a small role in spring snowmelt, where they were still present. And, although several dust-on-snow events fell after the date of SAG at our Senator Beck Basin Study Area and many Snotel sites in WY 2012, those later events did nonetheless further reduce snow albedo on the remaining snowpack at higher elevations and on shady aspects in the nearby terrain.
Perhaps largely because of the very early date of Peak SWE, on March 6th, spring 2012 produced two distinct periods of snowmelt behavior at Berthoud Summit, each with substantially different rates of SWE loss. As seen in the table above for the 2006-2012 period, Spring 2012 produced the lowest value and earliest date of Peak SWE in the past seven years yet still required the most days to fully ablate the snowcover (60), at the lowest rate of daily SWE loss (0.27” per day) for the full snowmelt period.
WY 2012 SWE accumulation and ablation at Berthoud Summit snotel, with upper and lower quartiles of period of record shown in light grey, middle quartiles in dark grey surrounding median trace for period of record, and mean trace for 1971-2000 period.
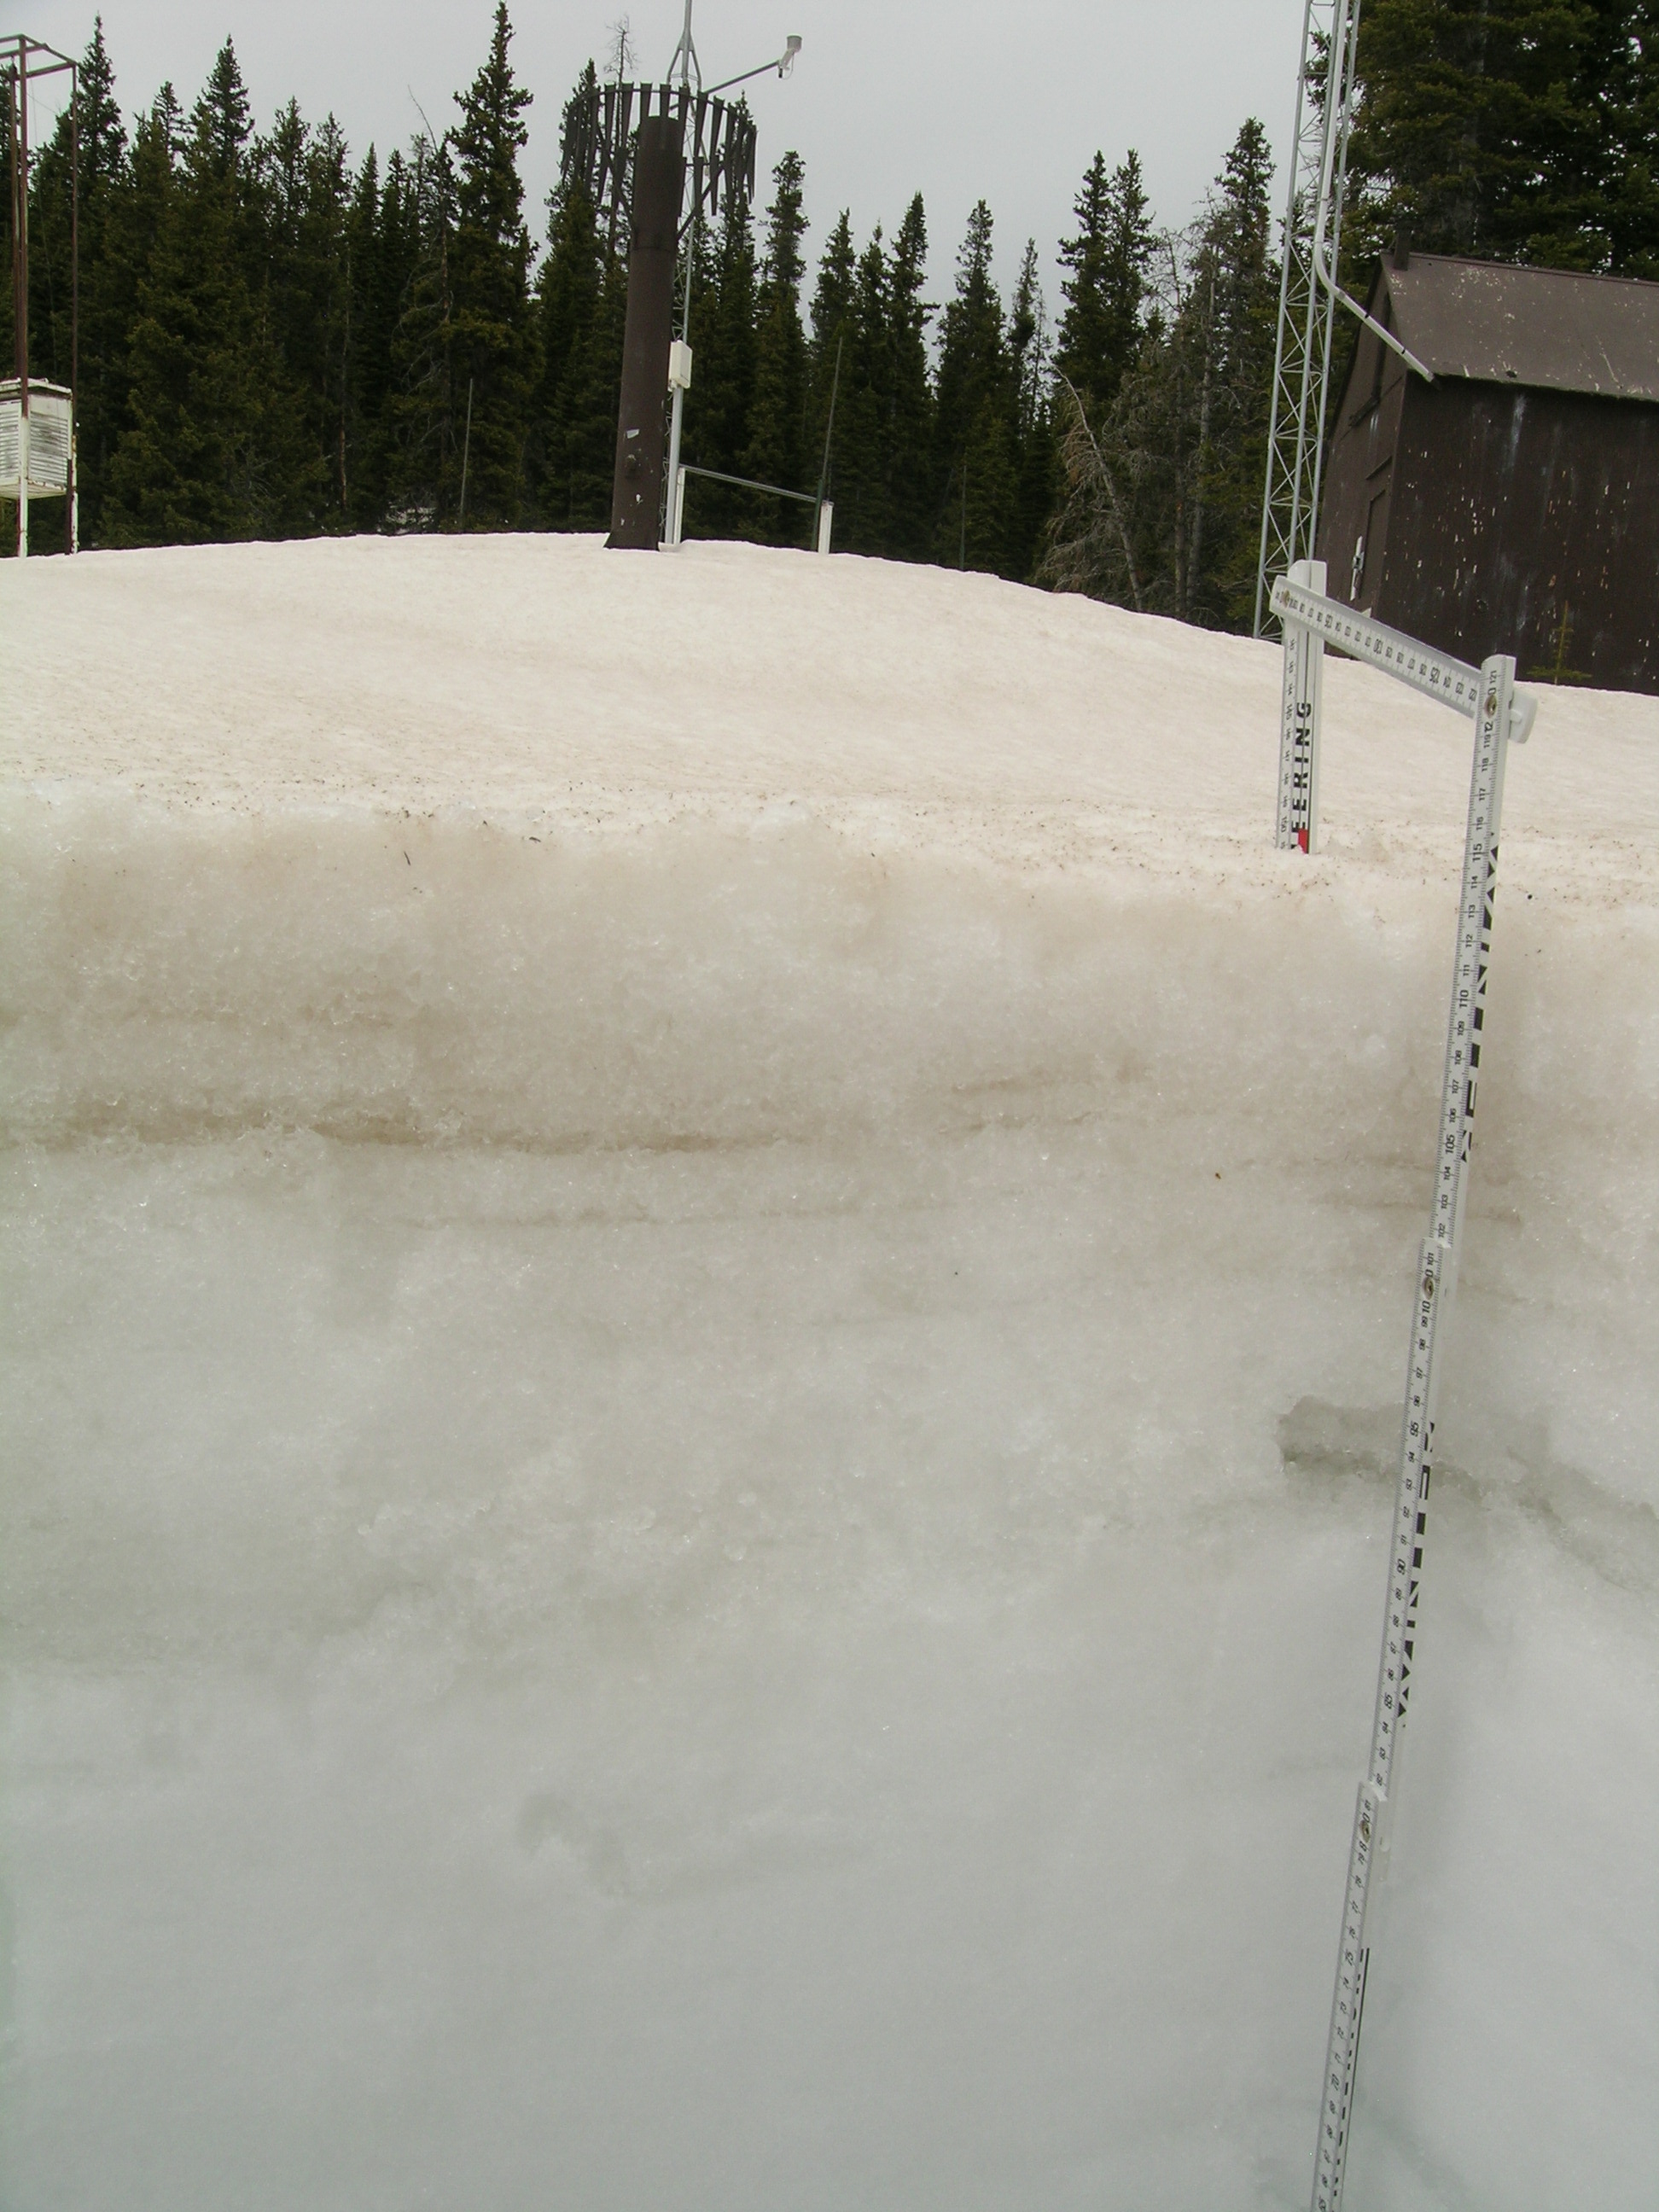
The avove plot of Berthoud Summit Snotel data shows a slowly accelerating rate of snowpack ablation in March, 2012, as a combined effect of the lack of precipitation and early snowmelt behavior enhanced by dust. Short wave solar radiation absorbed by dust layer D4-WY2012, deposited March 6th, had already produced melt-freeze several cycles in the snowpack surface by the time we conducted our March 15th, 2012 snowpit at Berthoud Summit, with melt energy percolating downward from the snow surface and incrementally warming the still-cold snowpack toward isothermal.
However, this infiltration of melt (free water) energy into the snowpack began early in March. Clear nights in March would have resulted in considerable radiant cooling of the snowpack’s near-surface layers, offsetting daytime warming from percolating melt water on some days (overnight cloud cover would minimize that radiant cooling offset). No measured data are available at this site to support that scenario, but these processes are well understood and documented elements of the annual snowmelt energy budget. Very small precipitation events in late March may have also restored somewhat higher snow albedo values for brief periods.
Eventually, as a combined result of surface energy inputs, enhanced by dust, and geothermal heating from the ground below, our April 10, 2012 snowpit revealed a fully isothermal snowpack composed of “very wet” snow throughout, with dust layers D8-D4 merged at the surface. In Spring 2011, the snowpack retained considerable cold content on March 31st but was fully isothermal by April 24th. Given the substantially larger amount of total ice mass to warm to 0° C in 2011, compared to Spring 2012, perhaps the prolonged exposure of dust in March 2012 was the determining factor in producing an isothermal snowpack by April 10, 2012, two weeks earlier than in 2011, despite considerably more clear nights in March and early April 2012 than in March and early April 2011. Melt rates for the first part of the 2012 snowmelt season, from March 6th to April 13th, averaged just 0.15” SWE per day, but were as high 0.7” on April 11th and 12th
A period of unsettled weather beginning April 12th, 2012 produced a rebound in snowpack SWE, adding 2.2” of SWE back to the snowpack by April 20th. Following this stormy interlude, snowpack ablation resumed on April 21st and was complete to SAG (snow all gone) by May 5th, losing 9.5” of SWE in 15 days, an average rate of 0.63” SWE per day. The final five days of snowcover melted at an average rate of 1.14” per day. Within our period of analysis, these are low rates of melt, and the average of 0.27” of SWE loss per day over the entire 60 days of snowmelt is the lowest daily rate by a wide margin.
In contrast to the very early snowmelt season of 2012, the prior Spring of 2011, with its very late snowmelt season, produced among the highest rates of average daily SWE loss in our 2006-2012 period of analysis and quicker times to SAG, despite the largest total of SWE to melt. Spring 2010 produced the highest single-day and 5-day rates of SWE loss and shortest interval from Peak SWE to SAG, starting in mid-May.
 |
 |
 |
| May 26, 2010 | June 9, 2011 | May 2, 2012 |
| Photos in 2010, 2011, and 2012 at the Berthoud Summit CODOS snowpit site showing the snowpack surface late in the snowmelt season, with all/most dust layers merged at the surface, show clear differences in dust loading and reduction of snow albedo, with the least reduction in 2012. | ||
Stream Flows
Streamflow data at the USGS Fraser River at Upper Station gauge reflect an early and reduced snowmelt runoff. Streamflows on the ascending limb, in late March and throughout April, were several times average discharge levels for that period until intersecting with the median trace in early May, near 30 cfs, and then falling behind median rates. A final surge produced a peak just over 30 cfs in early June, at roughly 50% of median discharge for that date, followed by a steep decline that has already approached flow levels normally seen in mid-August. Overall, this hydrograph presents a substantial advance in the timing of WY 2012 runoff, with the center of the reduced runoff mass occurring several weeks earlier than normal.
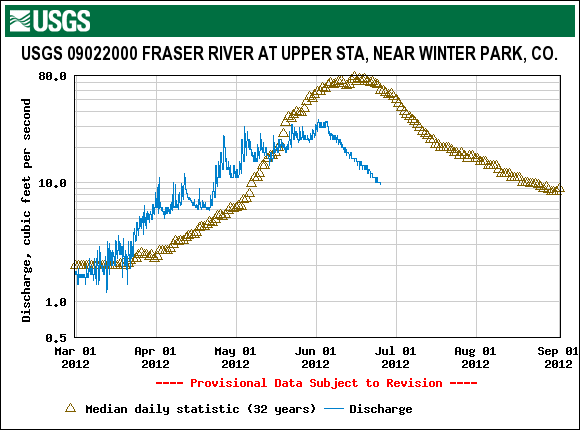
WY 2012 USGS Fraser River near Winter Park Stream Gauge data for a 10.5 sq. mi. drainage area in the upper Fraser River watershed, above 9,520’. Current year and historic data reflect withdrawals for a transmountain diversion through the Berthoud Pass ditch to West Fork Clear Creek basin.