CSAS Data: Graphs & Plot
Wind | Air Temps | Precip | Snowpack | Soil | Stream flow | Radiation
We measure incoming and reflected shortwave radiation with pyranometers (filtered and unfiltered) at two sites: SBSP (alpine) and SASP (sub-alpine). We also measure longwave incoming radiation with a pyrgeometer at both sites. We have snow surface temperature data to correlate with radiation data.
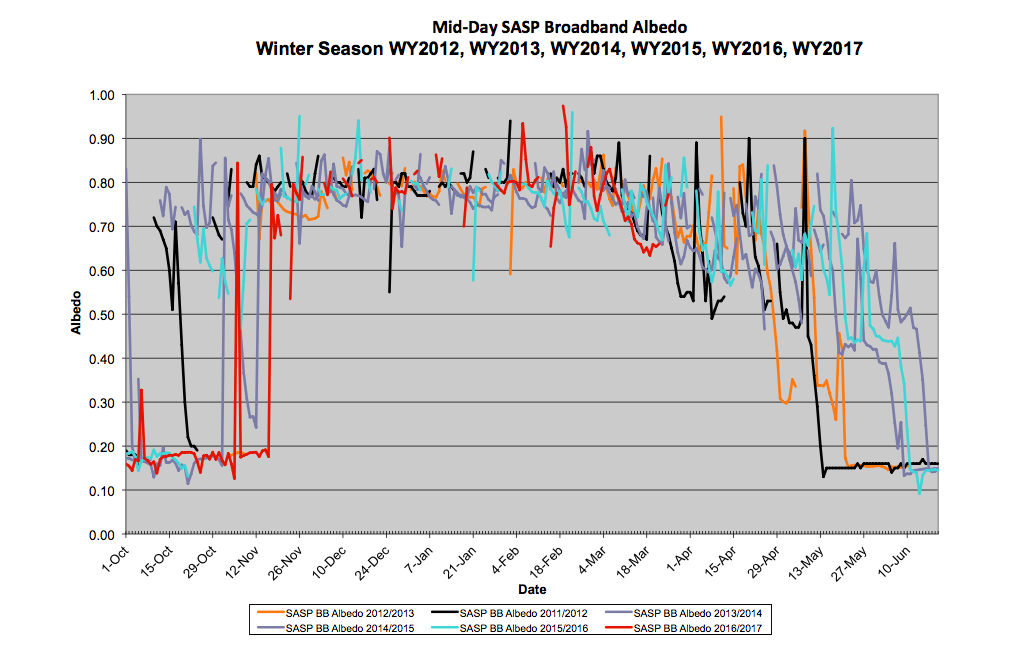
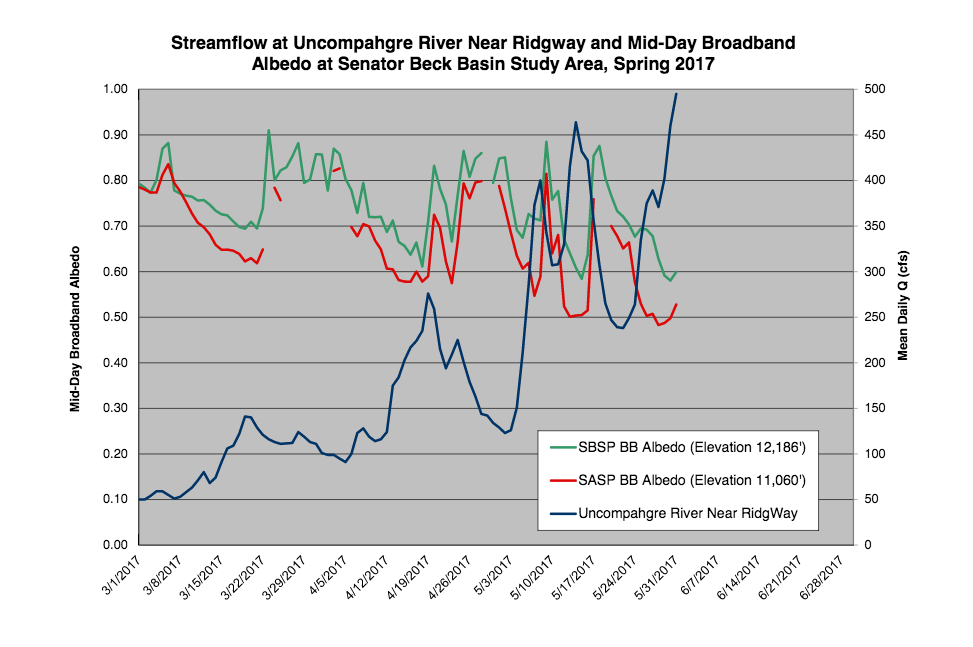
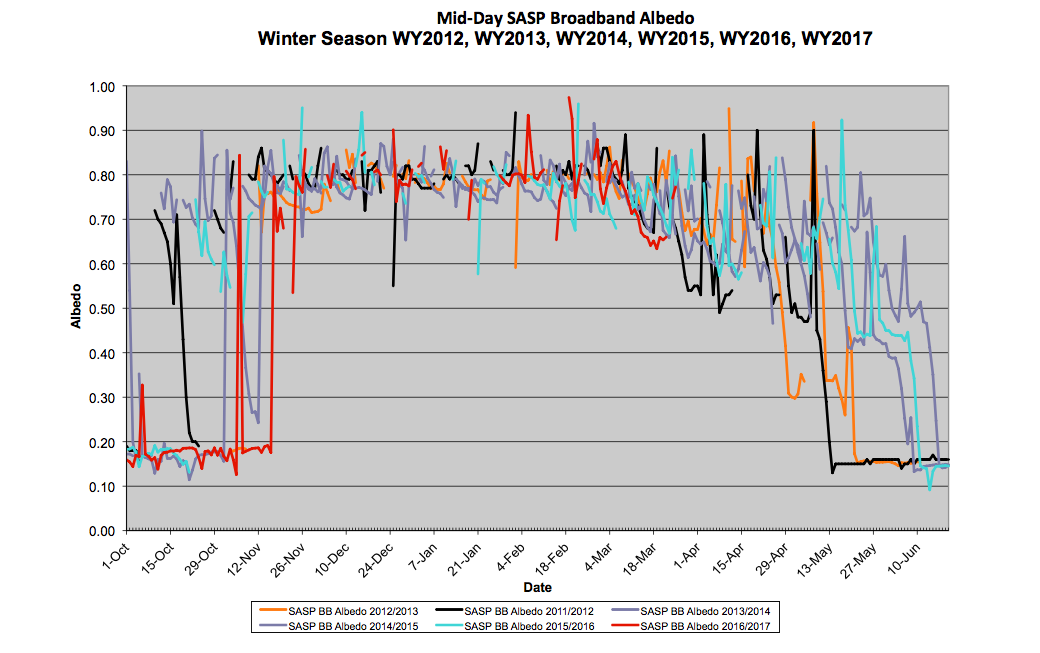
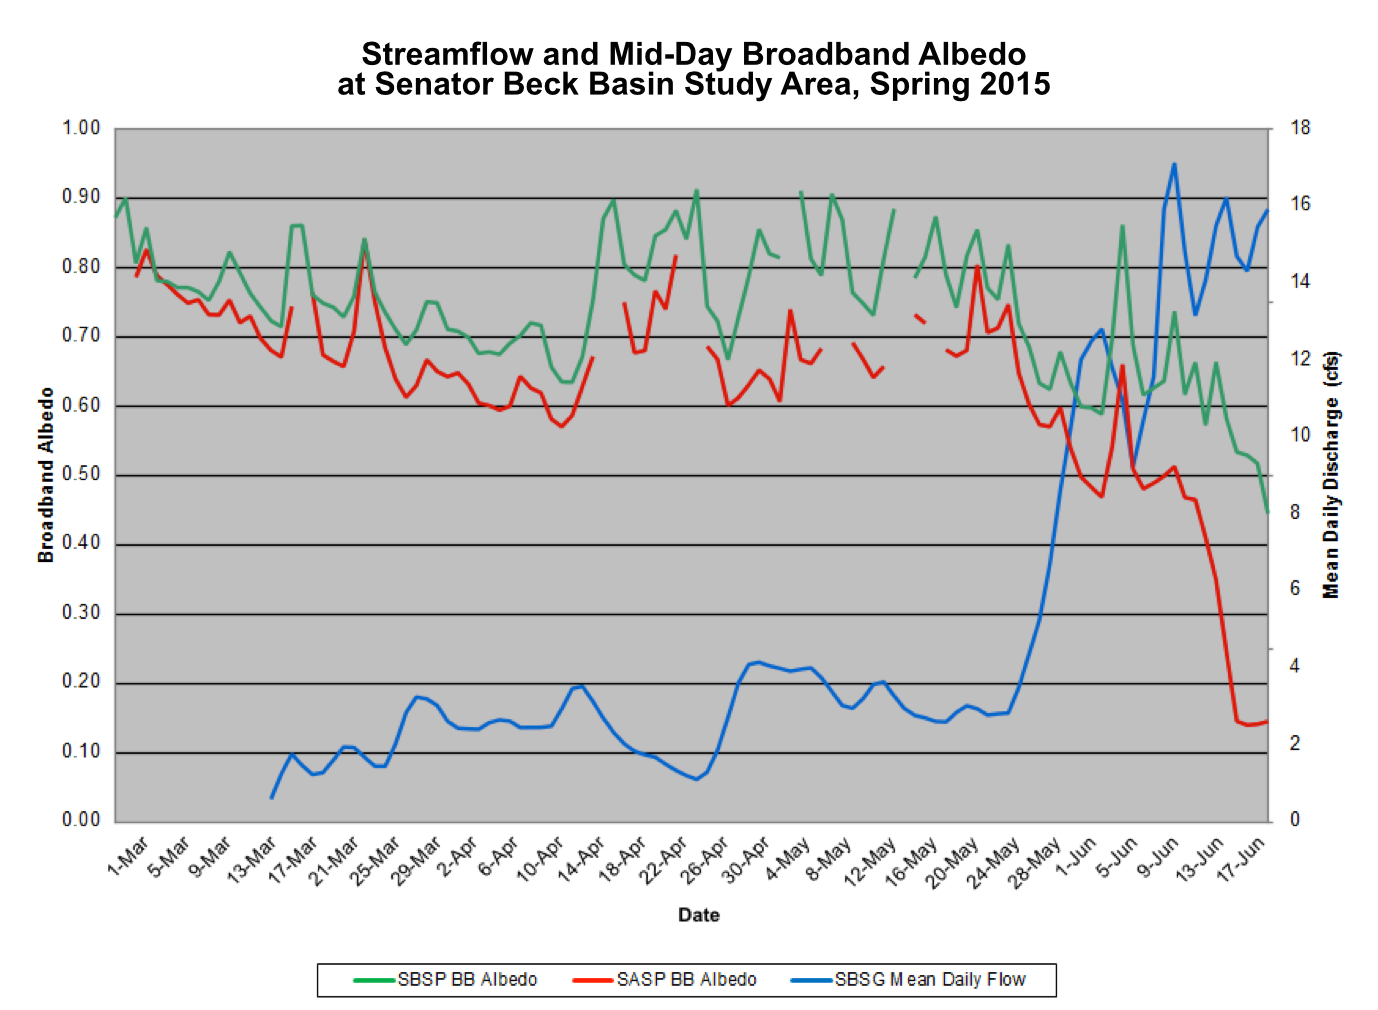
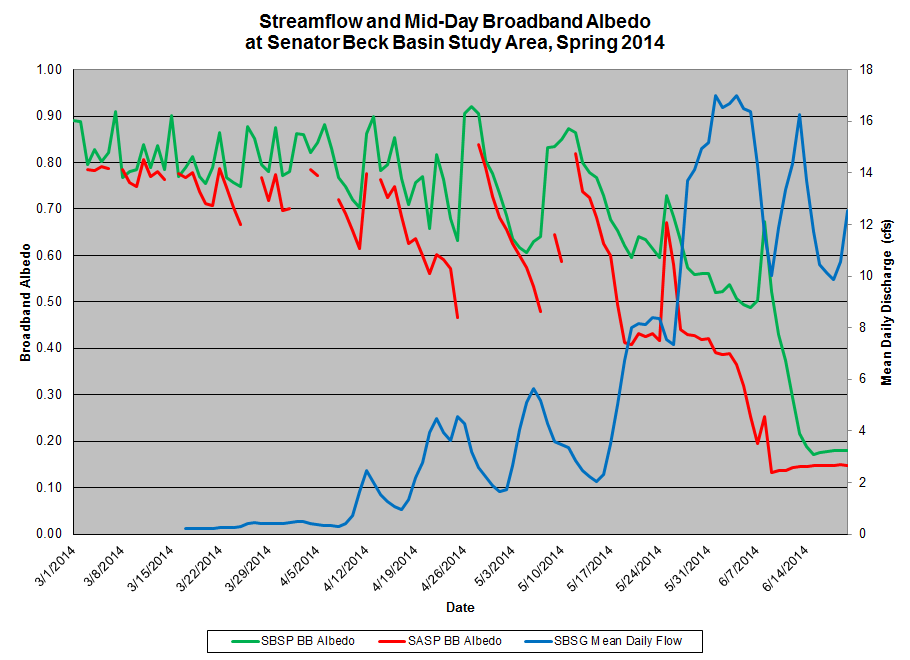
Plots of “broadband” snow albedo from 1200-1300 hours each day of the winters of 2011,/2012, 2012/2013, 2013,2014, 2014/2015, and 2016/2017 at the Swamp Angel Study Plot (SASP) and Senator Beck Study Plot (SBSP) in Senator Beck Basin Study Area. Gaps in the data at SASP represent days during which snow covered the up-looking “broad band” pyranometer measuring incoming, short-wave radiation (and SASP sensors were being recalibrated in fall 2013). Wind keeps the SBSP up-looking sensor clear of new snow. Data at the extreme ends of the plots represent the albedo of bare soil or vegetation on the ground, in the 0.15 to 0.20 range. Broadband albedo is calculated as the ratio of measured solar radiation reflected off the snowpack surface to incident (incoming) solar radiation; these measurements are not corrected for snow grain size effects or for slope and aspect of the reflecting snow surface (~3-4° NE at both sites).


