CSAS Data: Graphs & Plot
Wind | Air Temps | Precip | Snowpack | Soil | Stream flow | Radiation
![](https://snowstudies.org/jn17/precipchart.png)
![](2016 January Graphs/DailyPrecip_2014-2015.png)
![](DailyPrecip_2013-2014.png)
![](HS-DailyPrecip_2012-2013.png)
![](HS-DailyPrecip_2011-2012.png)
![](HS-DailyPrecip_2010-2011.png)
![](HS-DailyPrecip_2009-2010.png)
![](HS-DailyPrecip_2008-2009.png)
![](HS-DailyPrecip_2007-2008.png)
![](HS-DailyPrecip_2006-2007.png)
![](HS-DailyPrecip_2005-2006.png)
![](HS-DailyPrecip_2004-2005.png)
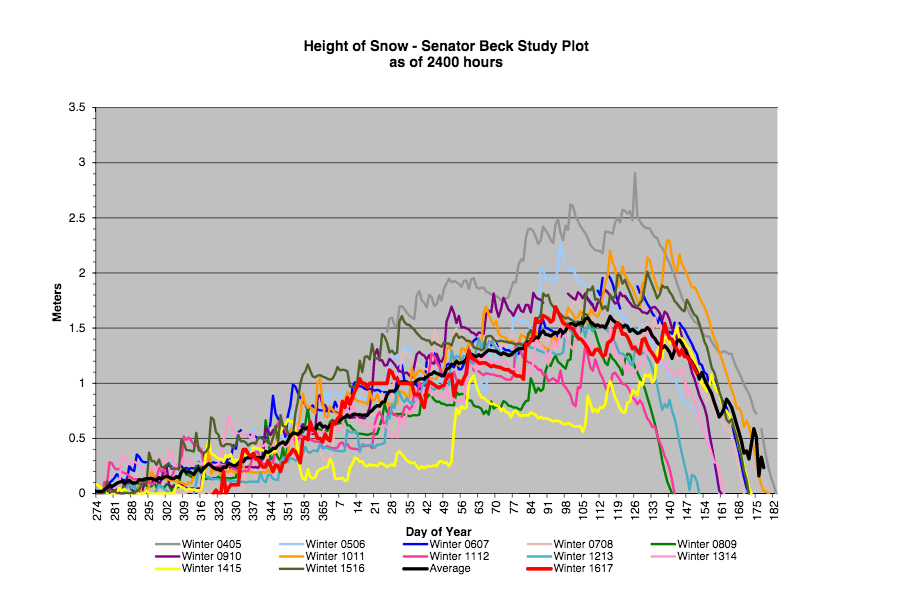
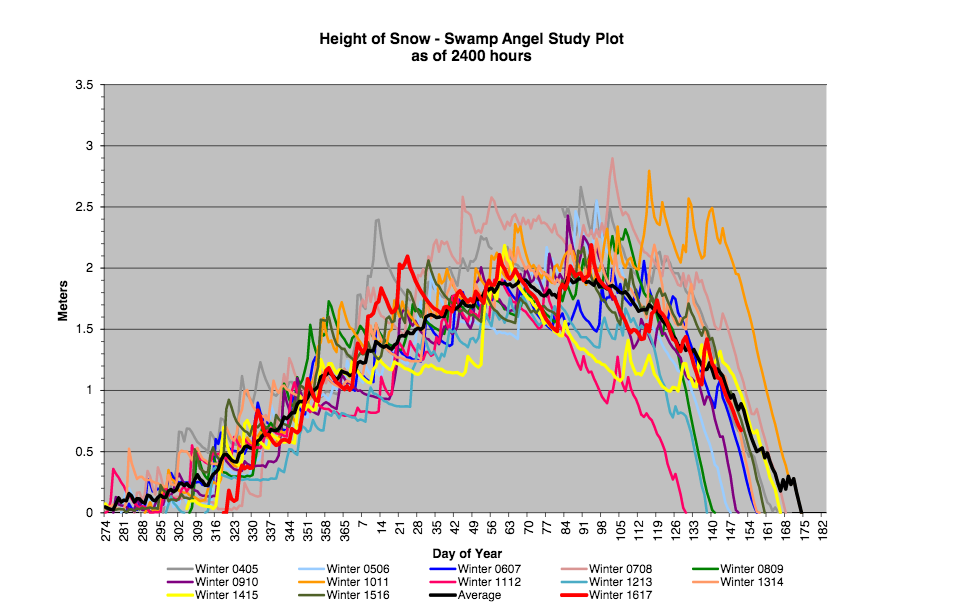
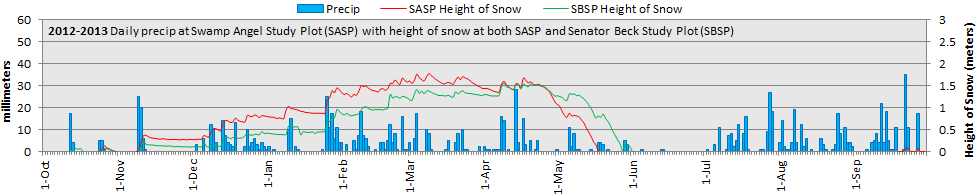
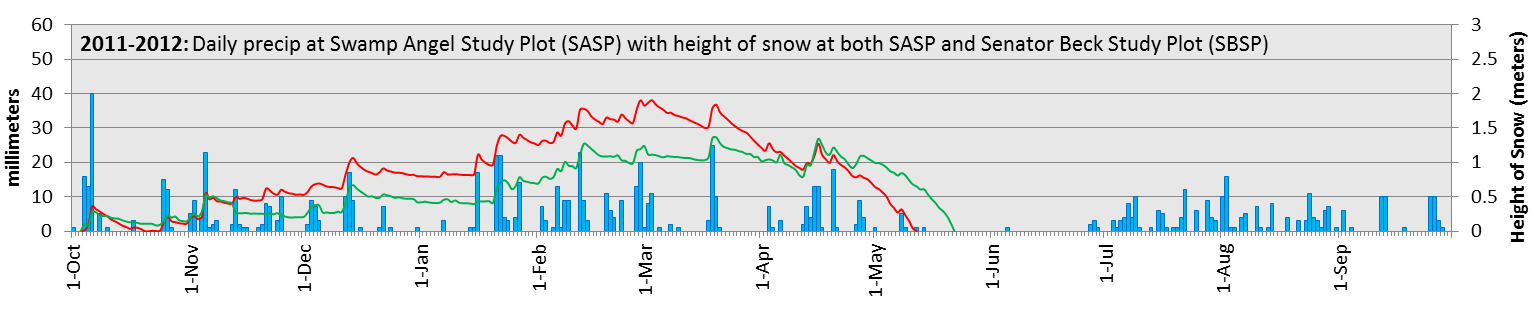
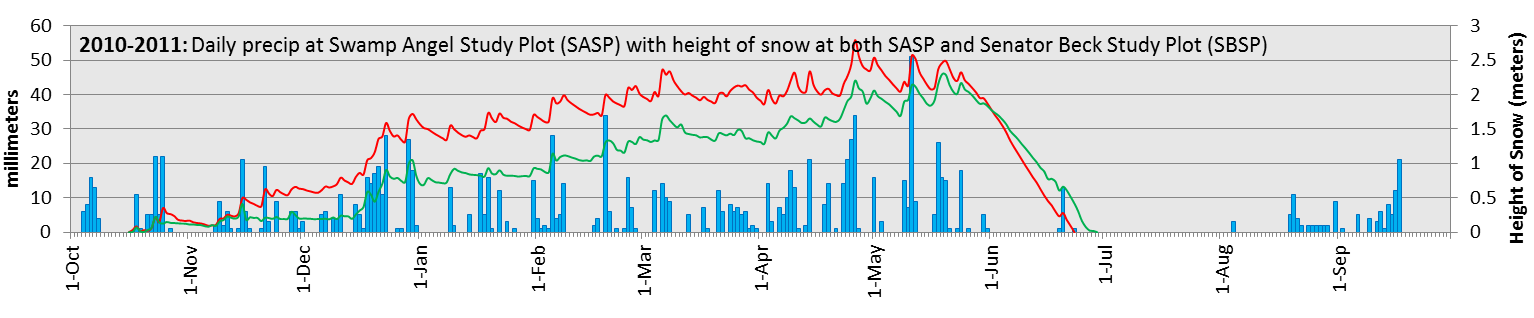
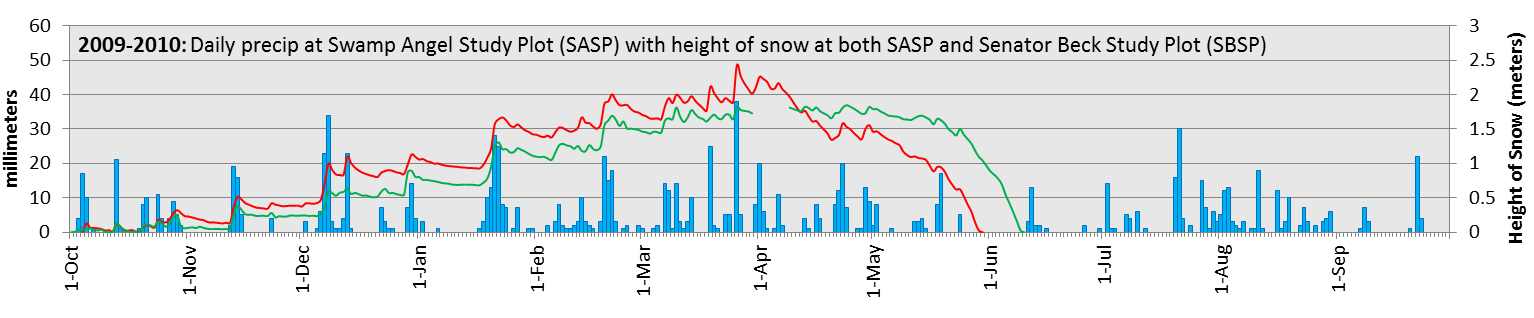
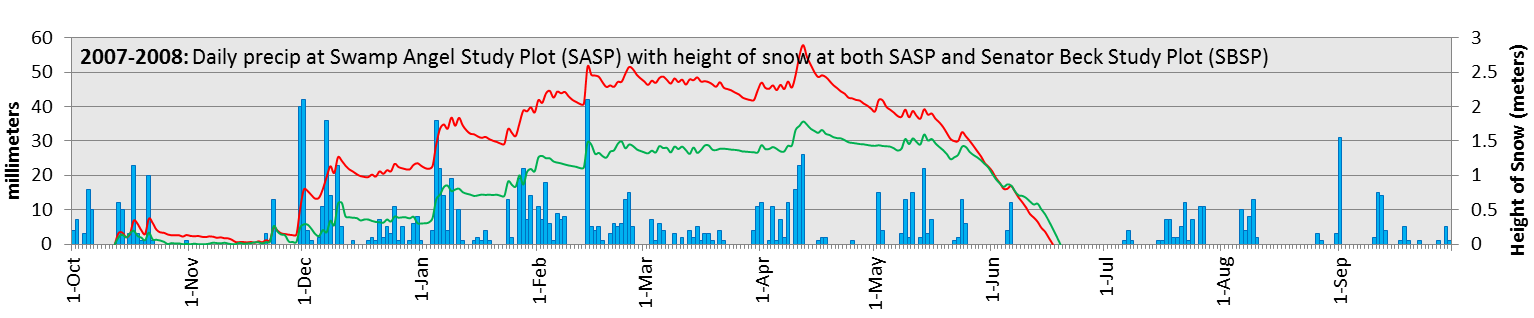
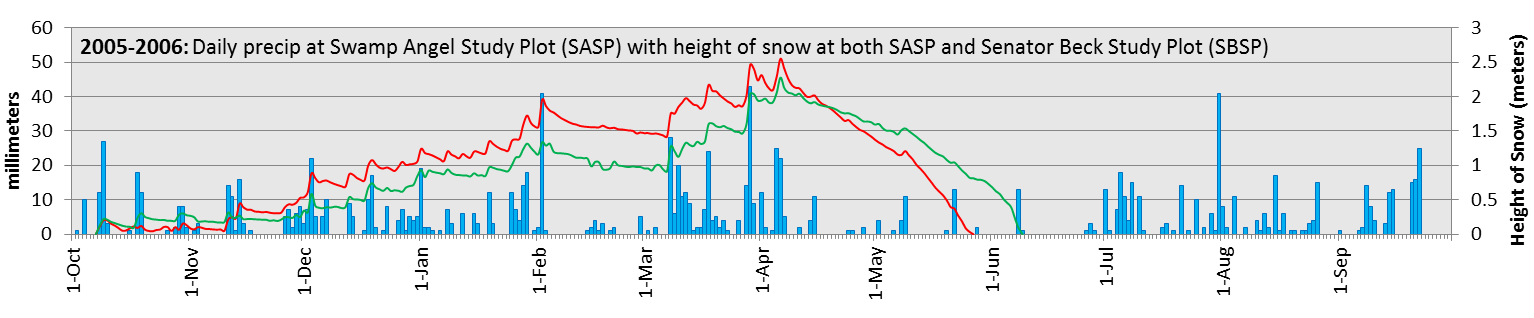
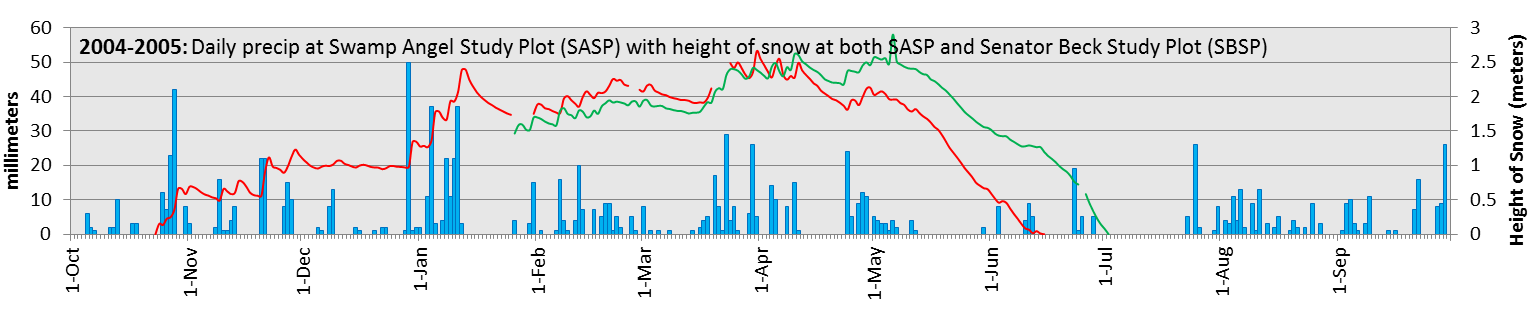
For other views of snowpack by individual year, we have snowpack plotted against:
Please contact us if you have questions or are interested in the datasets: jderry@snowstudies.org