 Water Year 2012 CODOS Summary
for Grand Mesa
Summary | Snowpack | Melt Rate | Stream Flows
Summary
Water Years 2011 and 2012 are a case study in interannual variability of Colorado snowpack formation and ablation driven by vastly different late winter and spring weather conditions, perhaps representing seasonal extremes. In dramatic contrast with the unrelenting storms of Mar/Apr/May 2011, extremely dry late-winter and spring weather in 2012 resulted in low values of peak SWE, very early in the spring.
On the other hand, the past two seasons produced comparatively smaller differences in dust-on-snow conditions, with WY 2012 coming close to matching WY 2011 at the Senator Beck Basin Study Area, our baseline monitoring site. WY 2012 desert dust concentrations on the Grand Mesa were comparable to those observed at Senator Beck Basin. Spring 2012 snowpack “ripening” was enhanced by those reductions in snow albedo in the first phase of the snowmelt season. The Grand Mesa CODOS site snowpack became isothermal in late March, as snowpack SWE peaked, with several dust layers merged at the snowpack surface. Stormy weather in mid-April produced a small rebound in SWE but then snowmelt rates at the Mesa Lakes Snotel site subsequently accelerated sharply, to a record early date of “snow all gone” (SAG). Streamflow data from the nearby USGS Plateau Creek and Surface Creek gauges document a substantial advance in the snowmelt runoff cycle.
SnowPack & Dust Discussion
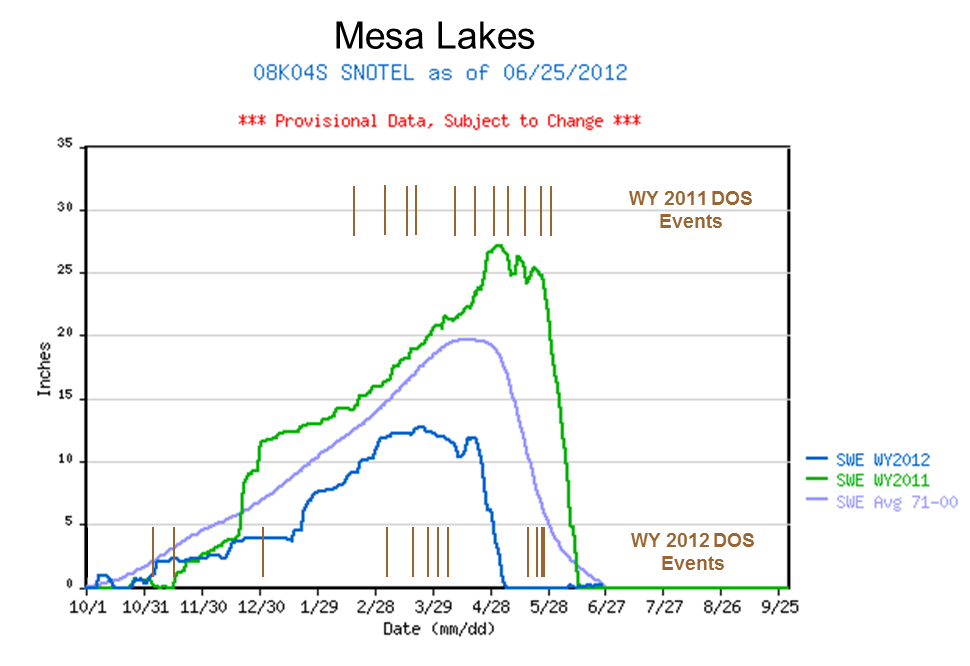
SWE accumulation and ablation for Water Years 2011 and 2012, with dust-on-snow events shown, by date, as brown bars for both water years (as observed at the Senator Beck Basin Study Area).
Water Year 2012 snowpack formation at Grand Mesa and the Mesa Lakes Snotel began well but, after Thanksgiving, SWE accumulations then began to slip quickly into and almost below the lower quartile of daily SWE values (see Snotel projection plot below). A rebound in SWE in mid-January assured that SWE values would remain within that lower quartile for the duration of the season, until SAG. Peak SWE arrived at the Mesa Lakes Snotel very early, on March 24th, at just 12.7”, well short of the 1971-2000 average of 19.7” and more than three weeks earlier than the April 16th average date of peak SWE. Peak SWE in 2011 was over double that of 2012, at 27.1” of water content, and occurred on May 4th, almost three weeks later than average.
During WY 2011 eleven dust events occurred at Senator Beck Basin containing a total of 14 grams of dust per square meter. Most of those major dust layers were found in CODOS snow profiles that season at the Grand Mesa CODOS site. However, relentless accumulation of late winter and spring snow routinely buried new dust layers and restored high snow albedo values throughout April and May, until the final and perhaps largest event of the season on May 29th.
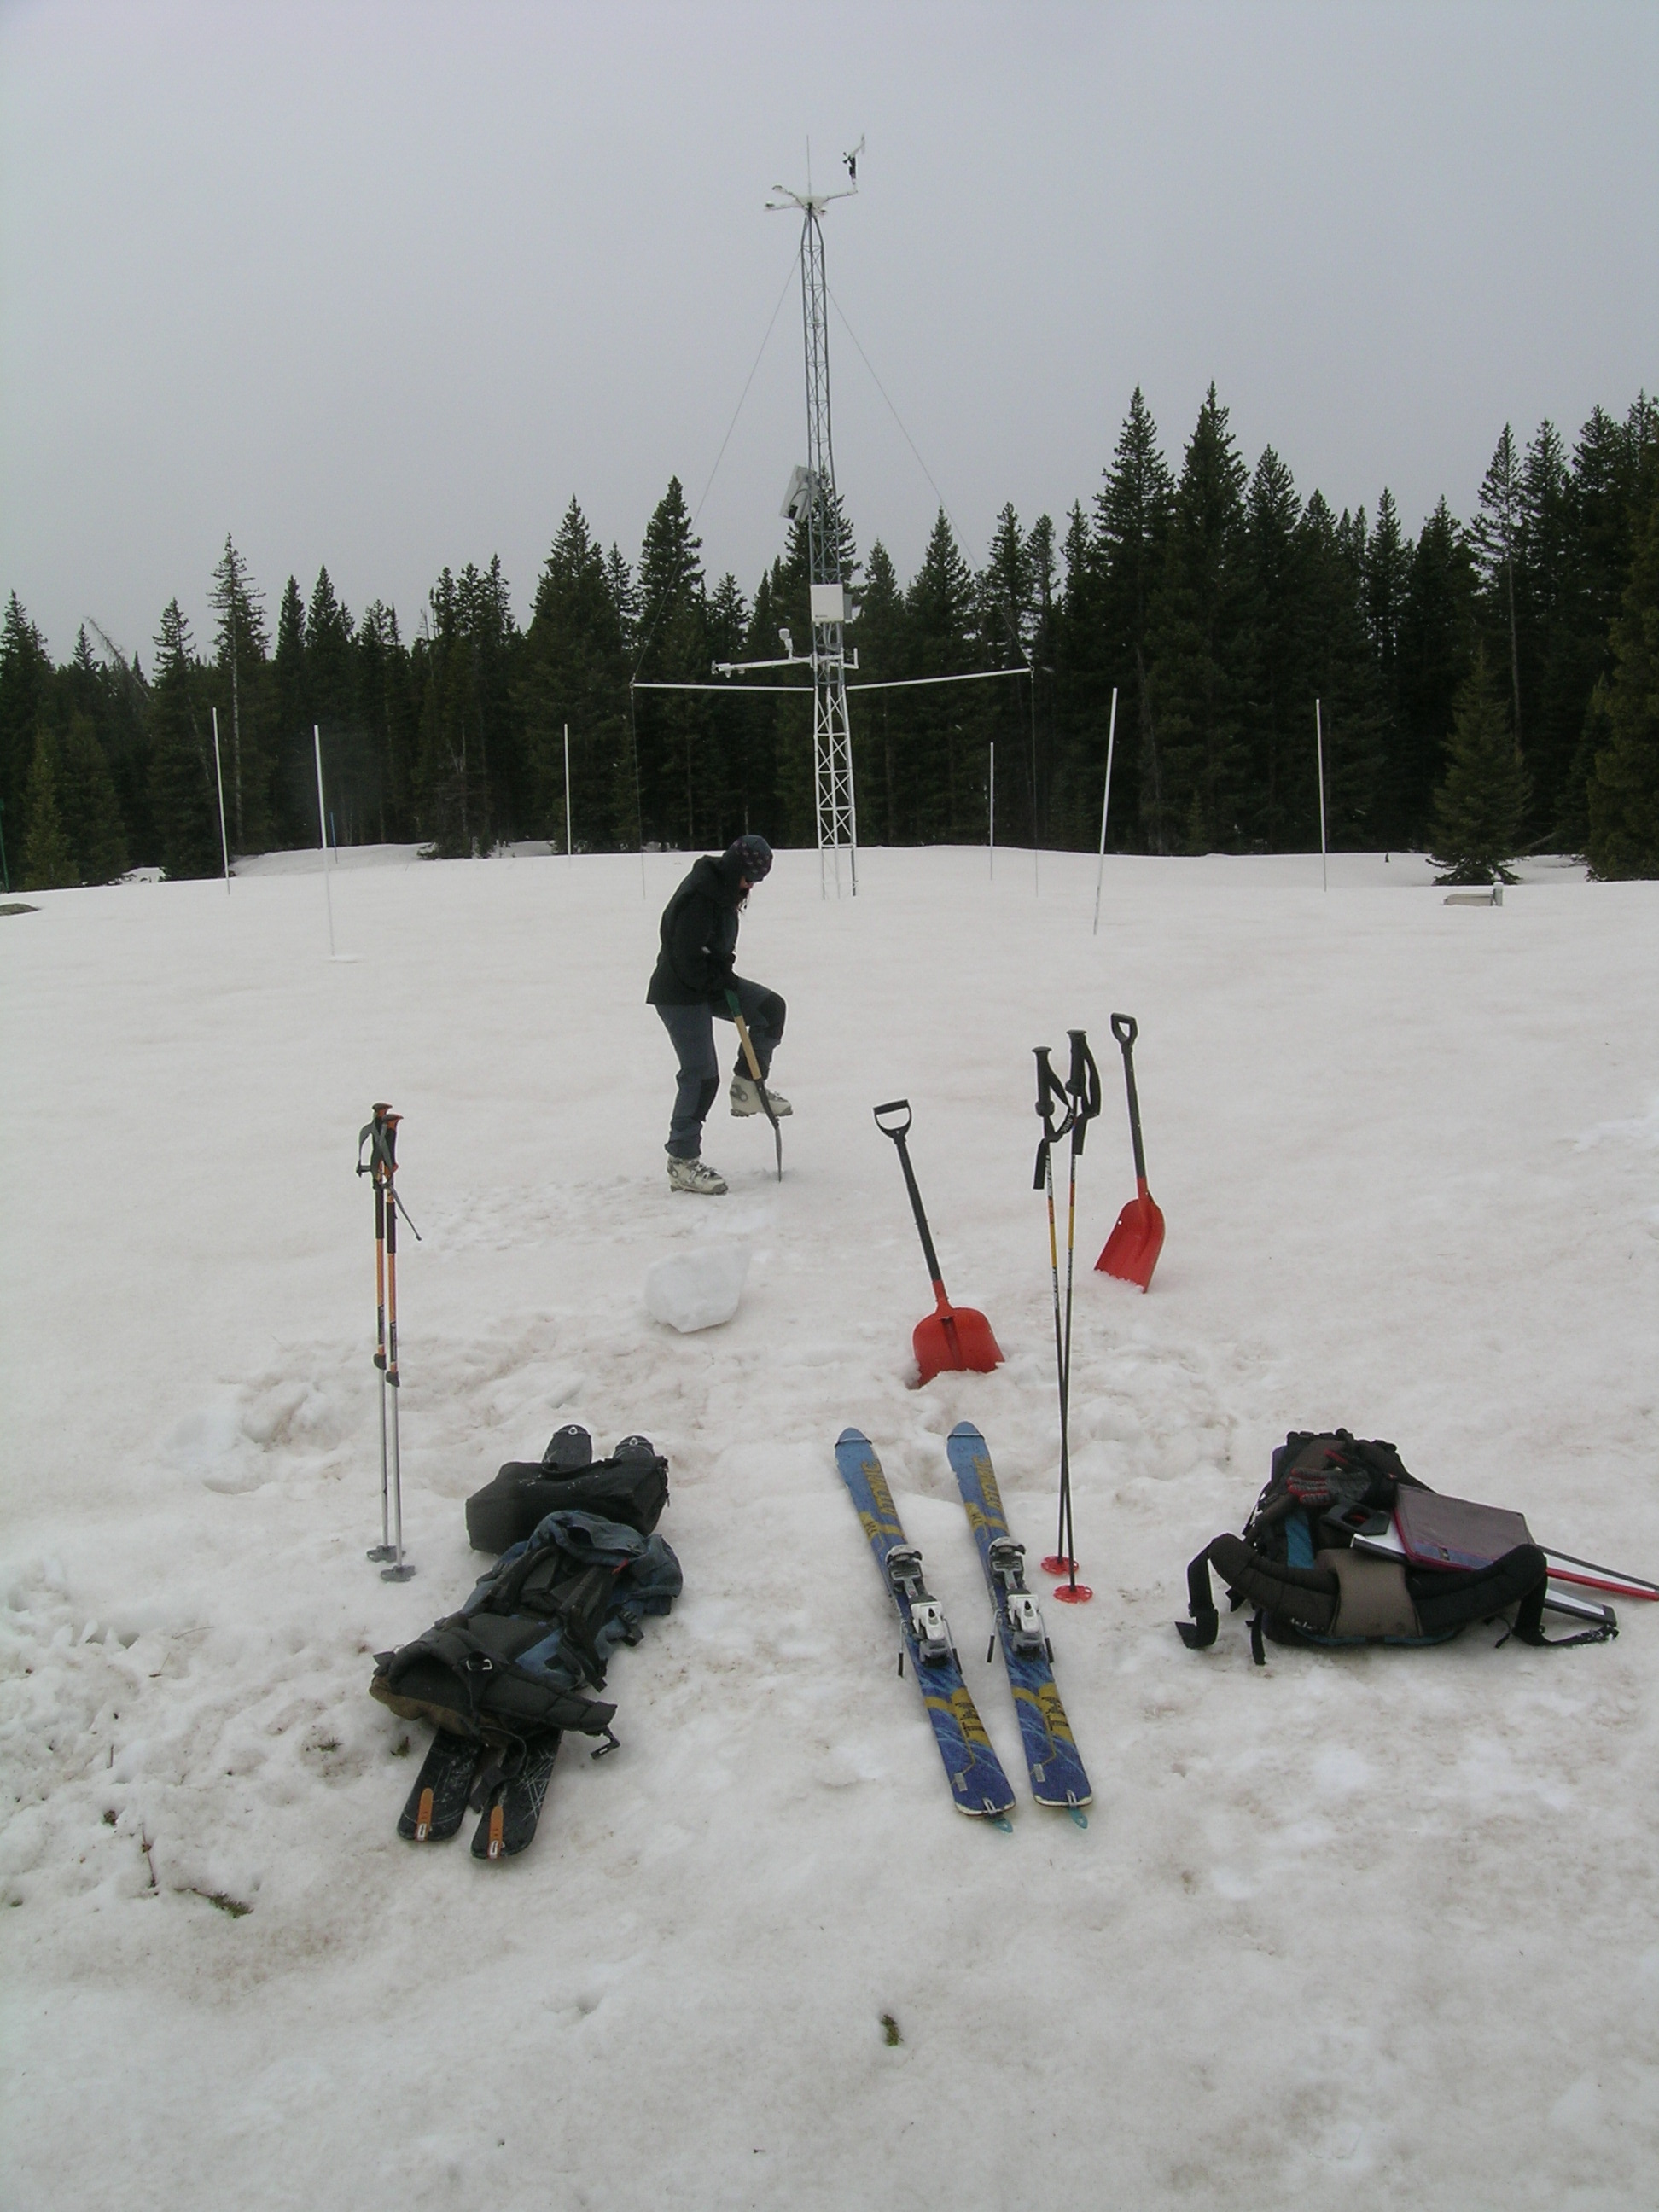
CSAS’s Kim Buck starting the May 1st CODOS snow profile at the Grand Mesa site. Very tough ice layers often require using a steel ‘sod spade’ to begin the snowpit, as Kim is doing here. Our gear is sitting over the location of our prior two snowpits at this site. With each snowpit we move a little closer toward the tower, assuring that our time series of profiles over a given spring are minimally affected by local spatial variations in snowpack properties caused by wind effects, or by the preceding snowpit.
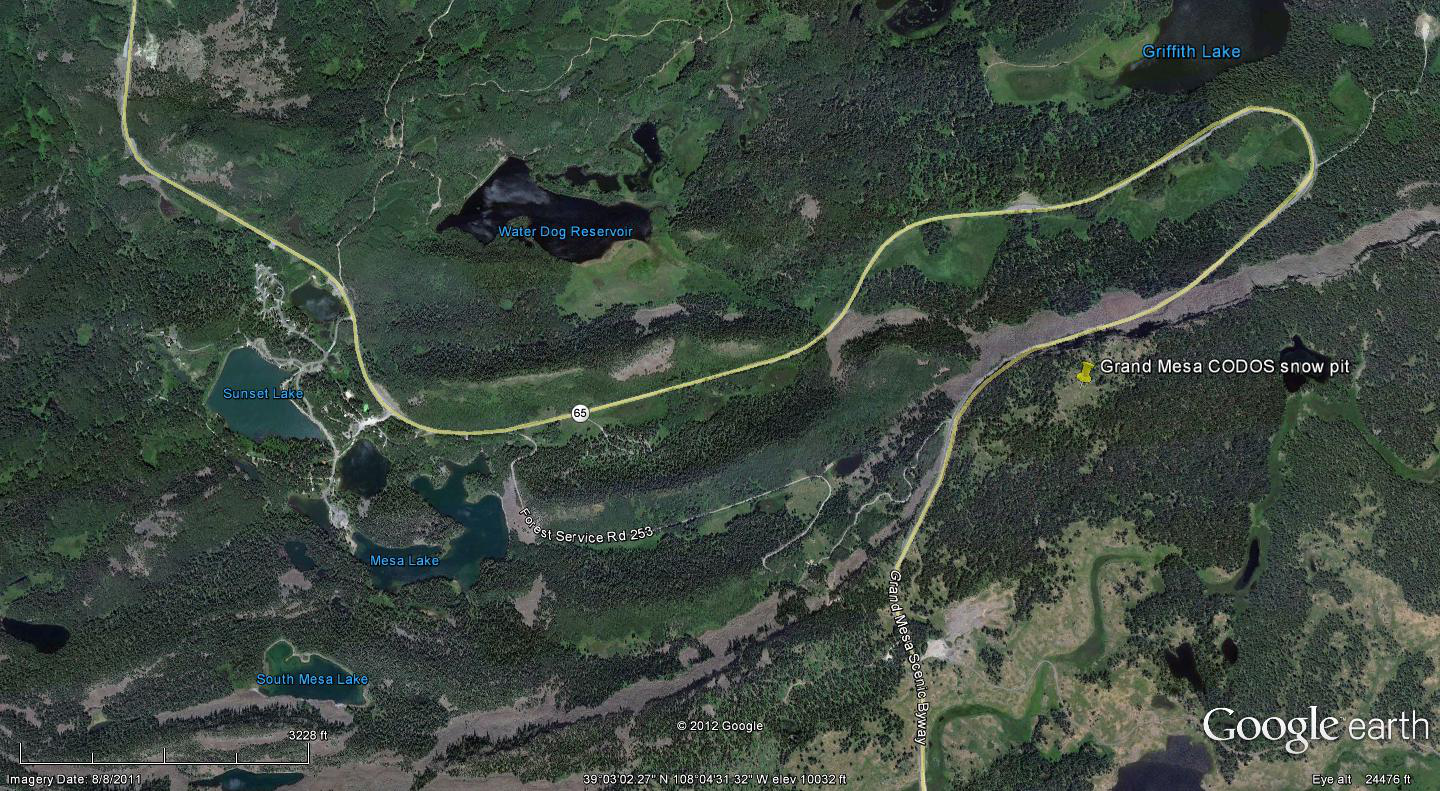
In our March 16th snow profile at our Grand Mesa CODOS site at the Skyway ski trail system, at 10,630’, we found event D4 dust at the surface of the 146 cm (57”) snowpack, with 12 cm of very wet melt/freeze polycrystals at the snowpack surface. The snowpack was already quite warm, retaining minimal cold content, with a mean snowpack temperature of -0.3° C. Total SWE in our CODOS site snowpit was 509 mm (20.0”), versus just 12.2” at the Mesa Lakes Snotel site. The Mesa Lakes Snotel is the nearest Snotel to our CODOS site, 2 miles to the west but 630’ lower in elevation, at 10,000’.
Our next snow profile at the Grand Mesa CODOS site was performed on April 4th to coincide with snow surveys being performed by State and local officials. That day we found the 124 cm (49”) snowpack effectively isothermal at 0° C, with wet snow forms throughout the entire depth. Merged dust layers coinciding with events D4-D6 were just below the snowpack surface, thinly covered with an inch of rapidly melting new snow containing dust event D7, which fell April 1st. Total snowpack SWE was virtually unchanged, at 504 mm (19.8”), but a storm just after our prior snowpit had added at least 0.5” of SWE to the snowpack, indicating that some SWE had been recently lost (as the very wet snowpack also indicated).
Following a period of unsettled weather in mid- and late-April, we performed our final CODOS site snow profile of the season on May 1st. The snowpack remained isothermal and still 82 cm (32”) deep, containing 325 mm (12.8”) of SWE. Dust layers D4-D8 had merged and were substantially reducing snow albedo at the snowpack surface to ~0.52-0.55 (52-55% reflectance). The Mesa Lakes Snotel site would experience SAG just five days later, on May 6th, and the Grand Mesa CODOS site recorded SAG on/about May 15th.
Melt Rate
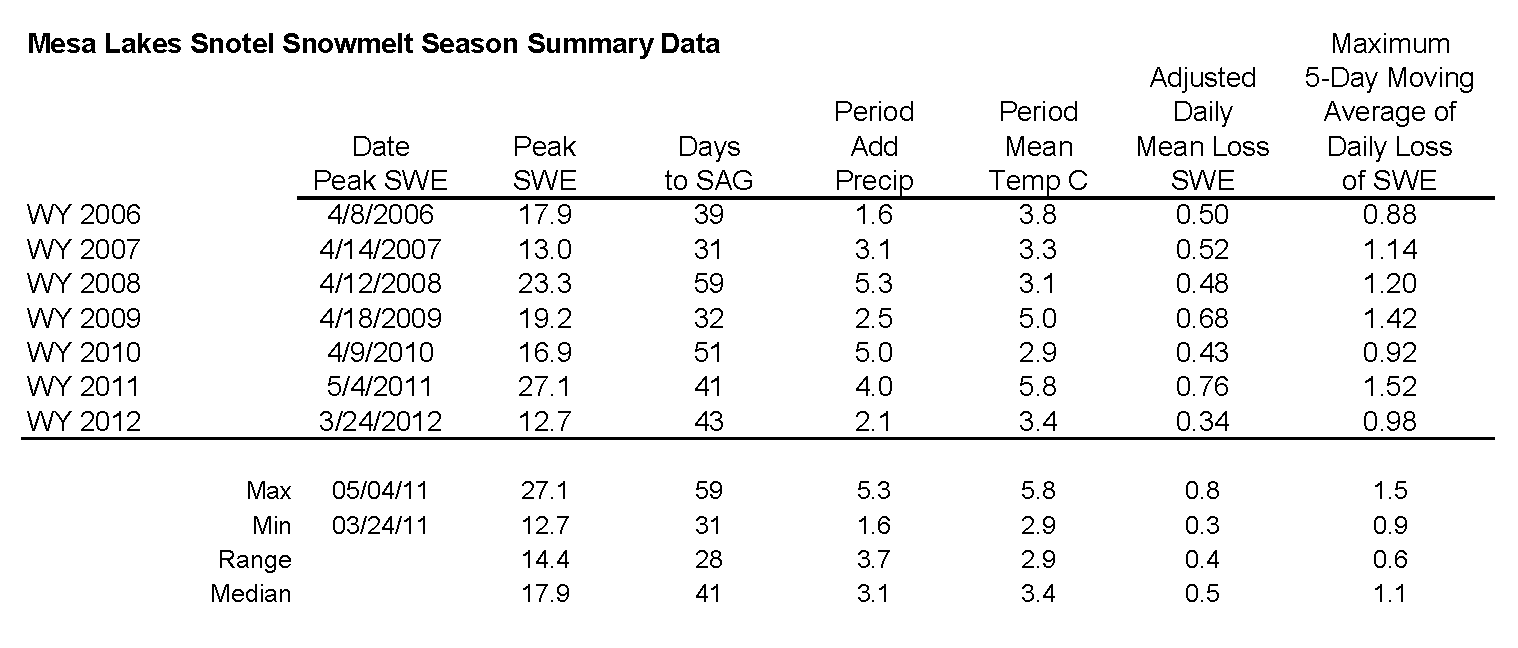
Analysis of Mesa Lakes Snotel data for 2006-2012 snowmelt seasons showing date and quantity of peak SWE, days from peak SWE to “snow all gone” (SAG), total additional precipitation after date of peak SWE, an “adjusted” mean daily rate of snowmelt adding the additional precipitation to the peak SWE total, the maximum five-day moving average of daily melt, and the mean air temperature over the entire snowmelt period, from peak SWE to SAG.
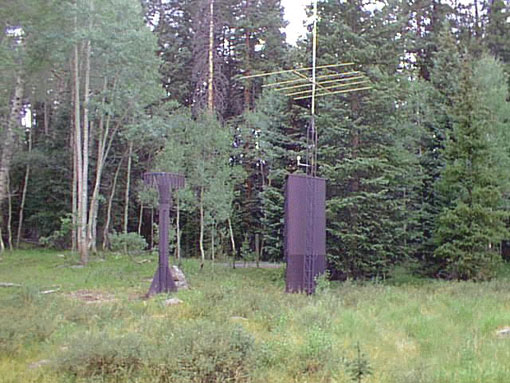
This discussion references CODOS Snotel site data and analyzes rates of snowmelt from Spring 2006 to the present, spanning the period during which we’ve rigorously observed dust-on-snow at our Senator Beck Basin Study Area, at Red Mountain Pass. Since the Snotel network is the only spatially extensive system continuously monitoring snowmelt throughout the Colorado mountains, year-to-year comparisons of Snotel melt rate data may yield insights into dust effects on local watershed-scale processes that our occasional CODOS snowpit measurements can’t reveal.
However, as we often note, many Snotel sites exhibit a radiative regime where surrounding trees reduce the access of incoming solar radiation to snowpack over the SWE measuring snow pillow, and where re-radiation of long wave energy from that vegetation and reduced skyview may inhibit radiant cooling and extend surface snowmelt during nighttime hours. Forest cover around the Mesa Lakes Snotel site is set back and, as a consequence, this site may come closer to experiencing the maximum effects of dust reductions in snow albedo, and snowmelt forcing, that we observe at our CODOS Grand Mesa snowpit site, where solar access is unimpeded.
During WY 2012, three fall and early winter dust storms were observed low in the snowpack at Senator Beck Basin, and D1 and D3 were also discernible at Grand Mesa in our CODOS snow profiles. Later, dust-on-snow events D9-D12, from May 18th-26th, may have had little effect on the Grand Mesa snowmelt cycle, as very little snowpack was left in open terrain at these sub-alpine elevations (the CODOS site was SAG on May 15th).
WY 2012 SWE accumulation and ablation at Mesa Lakes Snotel with upper and lower quartiles of period of record shown in light grey, middle quartiles in dark grey surrounding median trace for period of record, and mean trace for 1971-2000 period.
Even with the early date of WY 2012 peak SWE at Mesa Lakes Snotel, on March 24th, spring 2012 produced a two-step descending limb in the SWE plot similar to the pattern after peak SWE in 2011. In 2012, snowpack ablation gradually accelerated in mid-March until storms in mid-April produced a small rebound in SWE. Then, in late April, under the influence of unseasonably warm temperatures and further reductions in snow albedo from dust, melt rates accelerated again and remained high. Overall, the Mesa Lakes Snotel site required 43 days to ablate 14.8” of SWE (including 2.1” of precipitation after peak SWE), averaging 0.34” of SWE loss per day. However, the final, sustained meltdown from April 20th, at almost 12” of SWE, to SAG on May 6th required just 17 days, averaging a rate of 0.7” SWE loss per day and reaching 1.2” of loss on some days.
Stream Flows
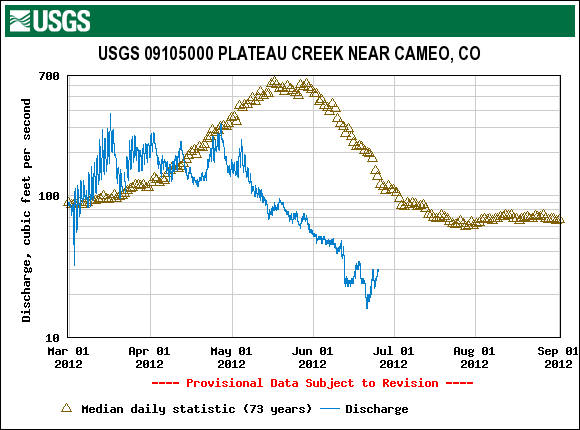
WY 2012 USGS Plateau Creek near Cameo stream gauge data for a 592 sq. mi. drainage area, largely on northern aspects of Grand Mesa, above 4,840’. Natural flow of the stream is affected by storage reservoirs, diversions for irrigation of about 25,000 acres, return flow from irrigated areas, and diversions for power development.
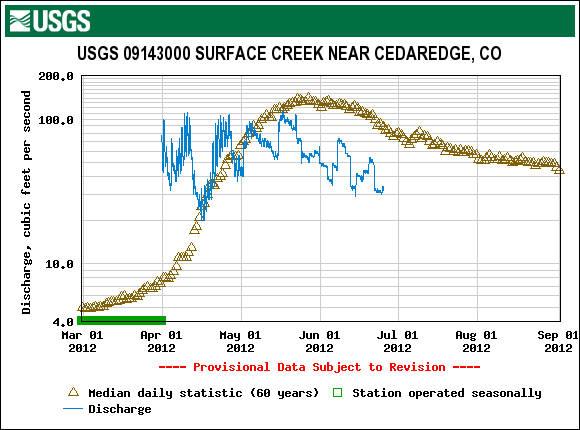
WY 2012 USGS Surface Creek near Cedaredge stream gauge data for a 27 sq. mi. drainage area on southern aspects of Grand Mesa, above 8,261’. Flow is regulated by many small reservoirs. Some water is imported from Leon Lake in the Plateau Creek drainage.
Given the very dry winter and sub-par snowpack on Grand Mesa, below average snowmelt runoff was unsurprising. However, in response to periods of dry, sunny, unseasonably warm weather and sustained exposure of significant dust-on-snow, spring 2012 snowmelt runoff hydrographs also exhibited early onset at unusually high rates, with a corresponding early and steep descending limb.
Although the Surface Creek gauge only began measurements in early April, with flows well underway, both of the above hydrographs show an early start to runoff with substantially above-average flows in Plateau Creek in March and in Surface Creek in April. Then, flows began a steep decline in early May. Flow management thereafter complicates further interpretation of these hydrographs, but flows clearly continued to decline.
In addition to the very warm temperatures associated with prolonged periods of dry and sunny weather in late winter and spring 2012, dust-on-snow events D4 (March 6th) through D8 (April 6th) played a significant role in this early Grand Mesa runoff, reducing snow albedo and hastening the ripening of the snowpack in late March, to isothermal. Dust then continued absorbing and adding solar energy to the snowmelt energy budget during subsequent periods of exposure at the snowpack surface in April and May. Because of the very early dates of SAG at the Mesa Lakes Snotel and at our Grand Mesa CODOS site, subsequent dust events D9-D12, in late May, fell on mostly bare ground in open terrain, with snowpack limited to forested areas, and played little role in late snowmelt behavior. Had late winter of 2011/2012 been more normal, with peak SWE and snowpack ablation following the mean or median timing seen in the Snotel plot above, those late-May dust events could have fallen onto more substantial remaining snowpack and played a significant role in the final stages of snowmelt, as occurred in spring 2011.