 CODOS Update for Park Cone site:
Visited April 9, 2012
Summary | Snowpack | Melt Rate | Stream Flows | Previous Update
Summary
Sustained periods of unseasonably warm air temperatures and exposed dust at the snowpack surface during late March and early April have, together, initiated accelerating rates of snowmelt and SWE loss at some, but not all, CODOS Snotel sites. Some CODOS Snotel sites report significant declines in SWE approaching the lowest values in the period of record (for a given date) or even falling outside of the historic range. Those sites may have experienced Peak SWE for WY 2012 in early or mid-March. Recent CODOS snowpits near those CODOS sites mirror those losses of SWE.
In contrast, other CODOS Snotel sites and CODOS snowpits show only small losses of SWE. At those sites, energy inputs from warm air and direct absorption of solar energy by dust at the snowpack surface was consumed in warming the snowpack towards an isothermal state at 0° C, as a precursor to the loss of SWE and onset of snowmelt runoff. Since our prior site visit on March 14 the snowpack at the Park Cone CODOS site, an open meadow immediately adjacent to the forested Snotel site, has lost all cold content and more than 50% of its SWE.
The National Weather Service expects warming weather in the Central Mountains through Wednesday with strong SW’ly winds developing on Wednesday afternoon ahead of a cooler but largely dry airmass. Somewhat more unsettled and cooler weather will finish the week and run through the weekend, including slight chances for snow showers each day, with temperatures perhaps even falling below seasonal norms by Friday and the weekend.
SnowPack Discussion
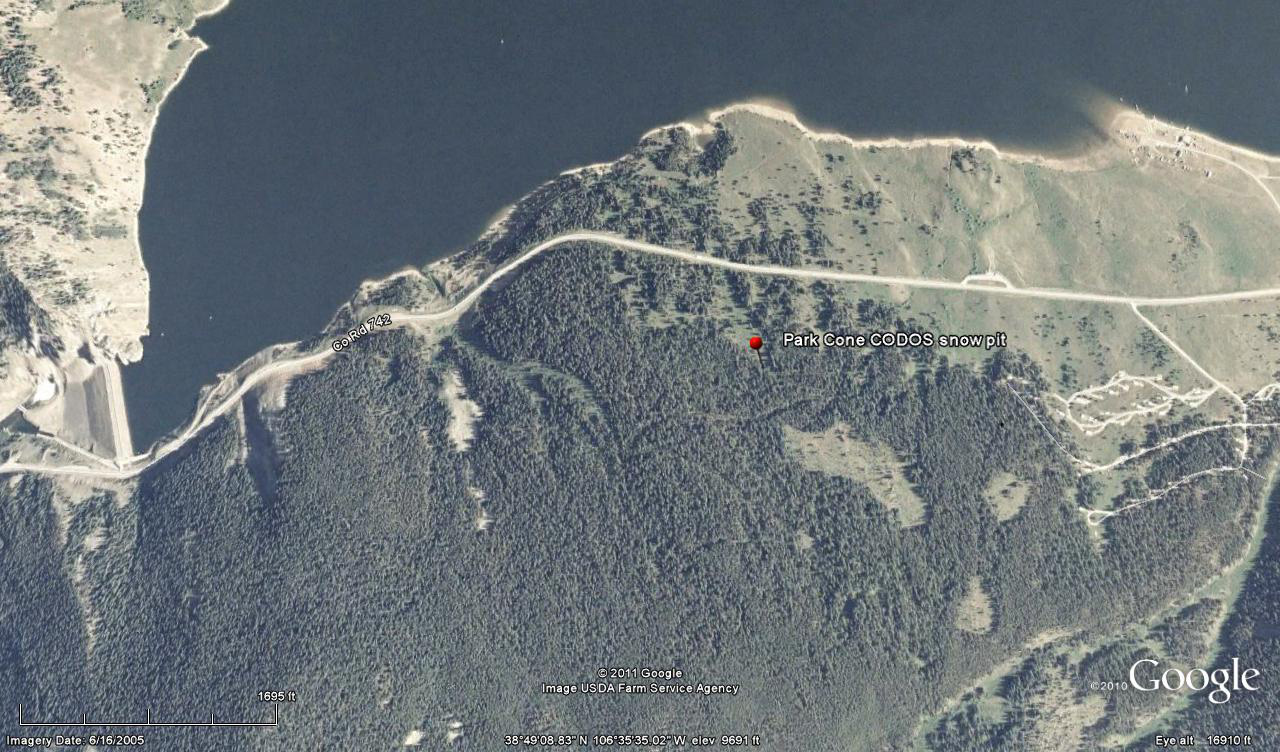
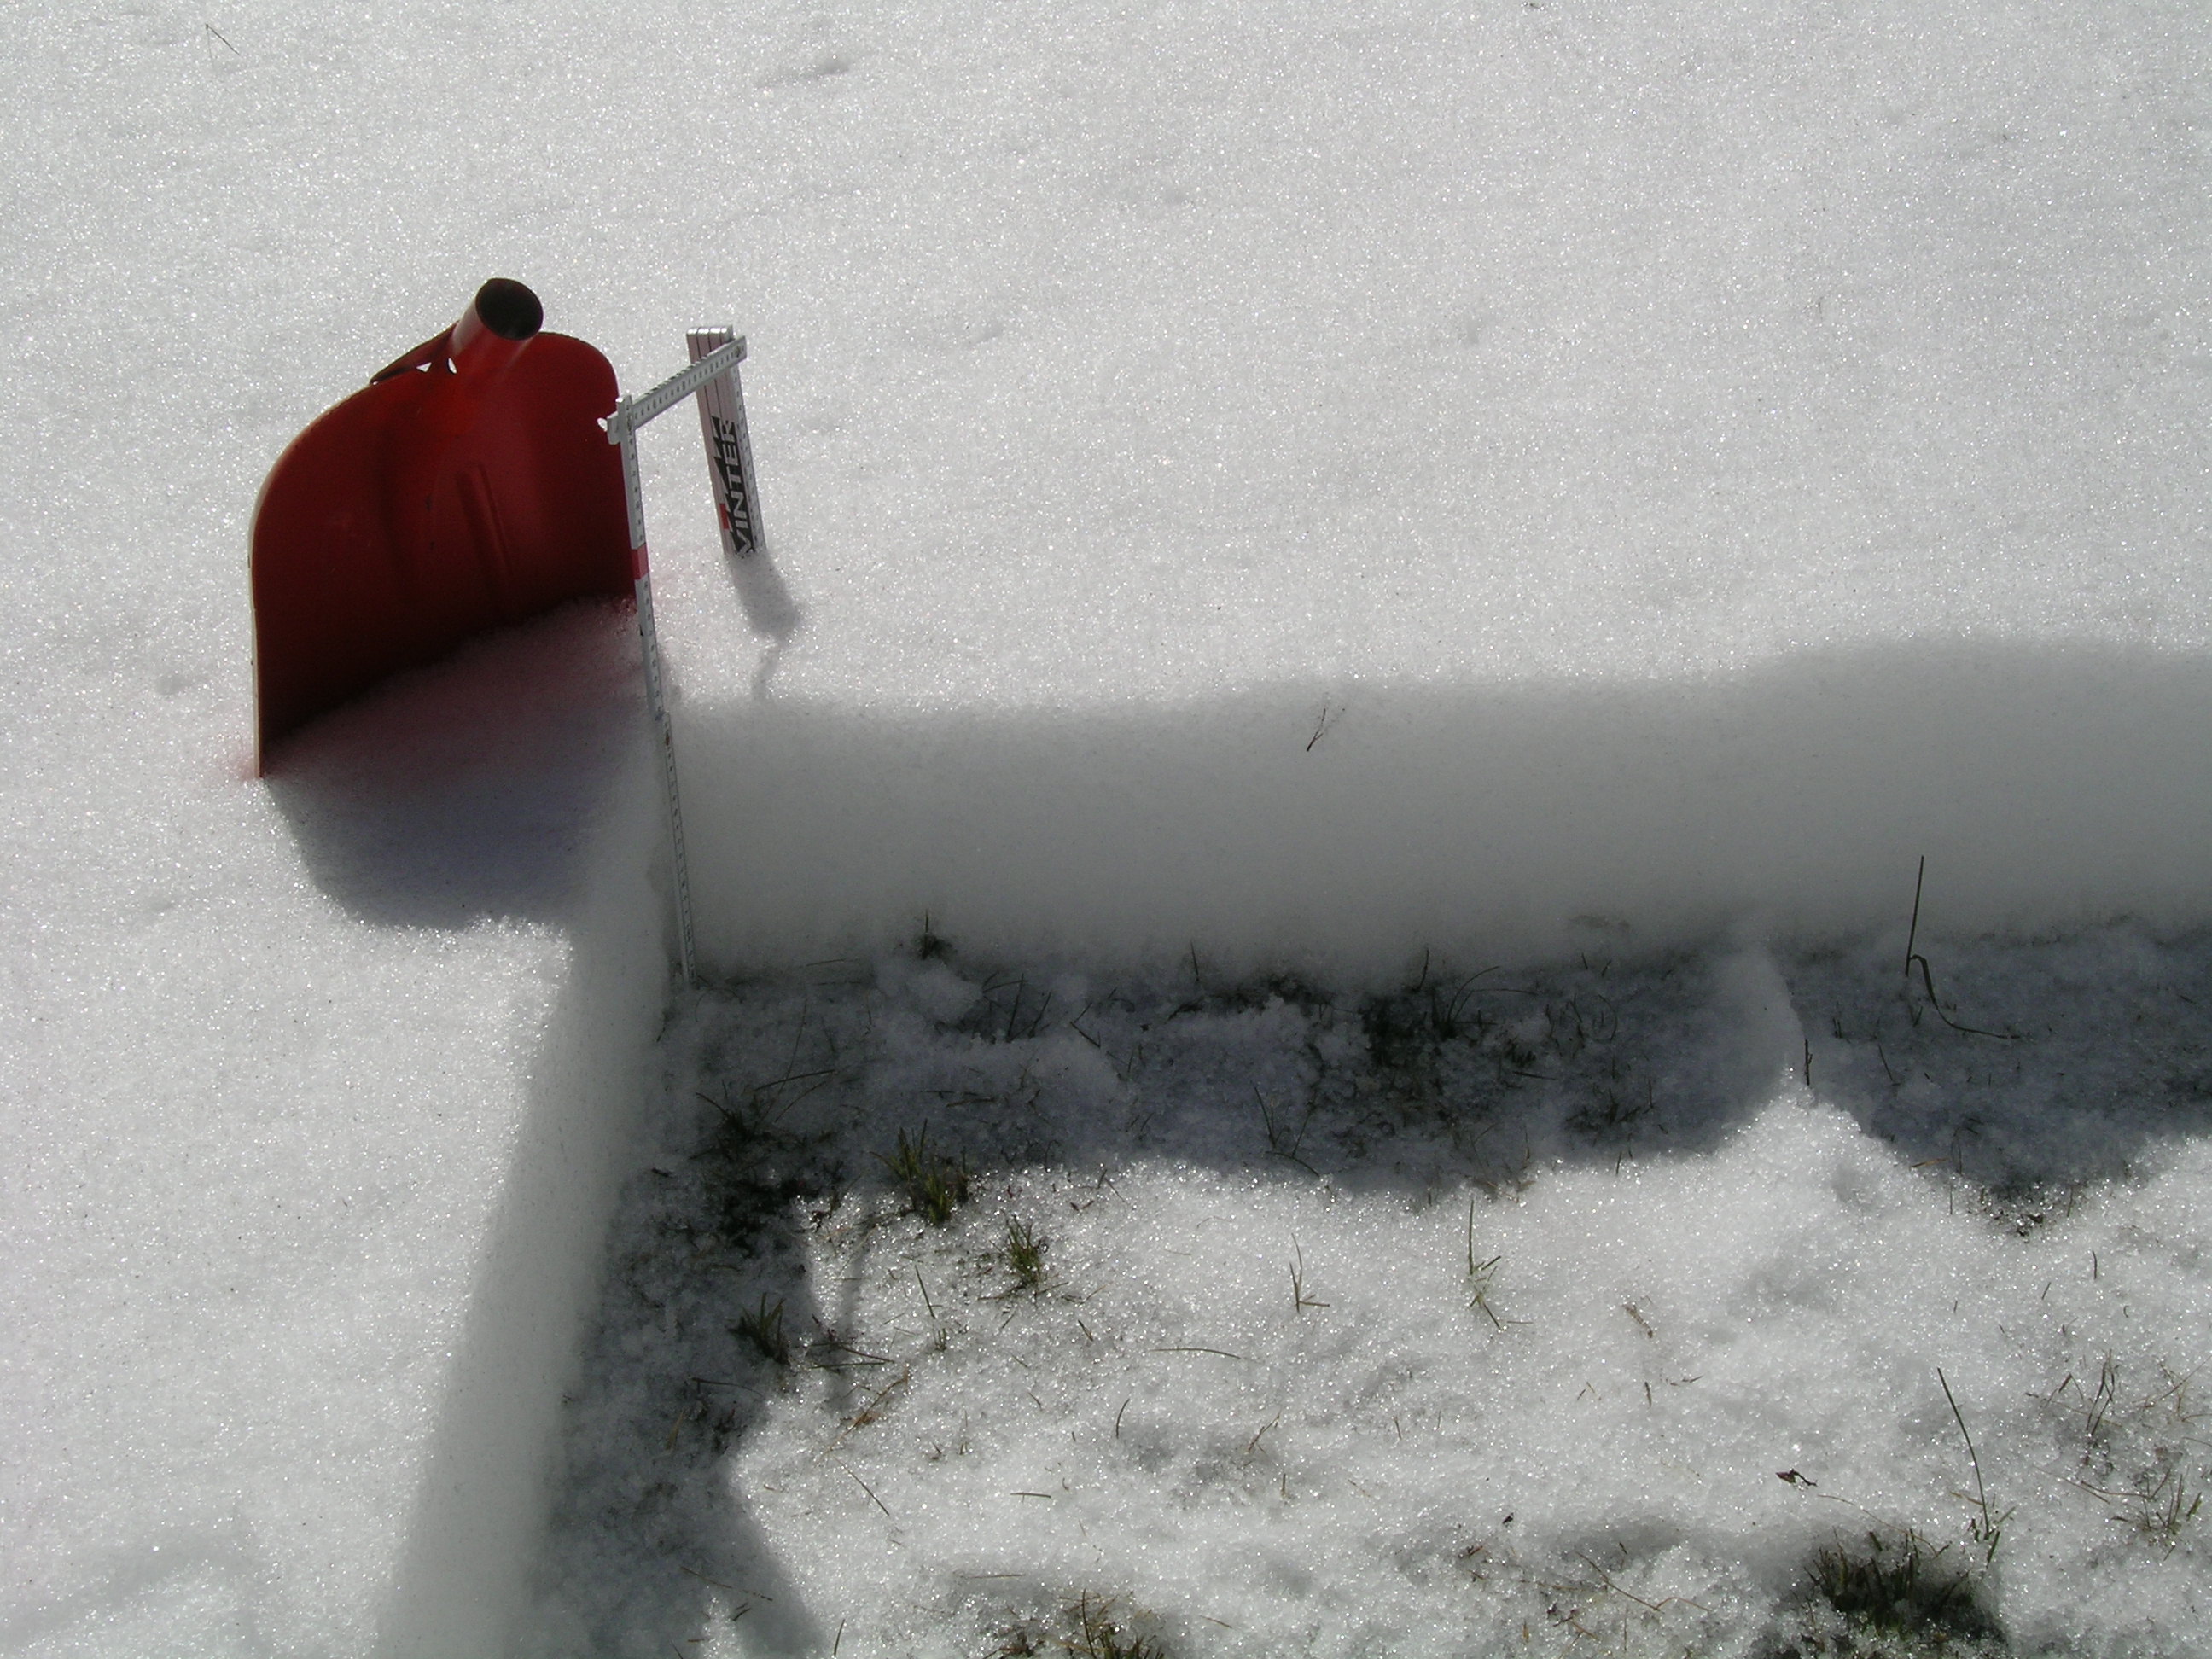
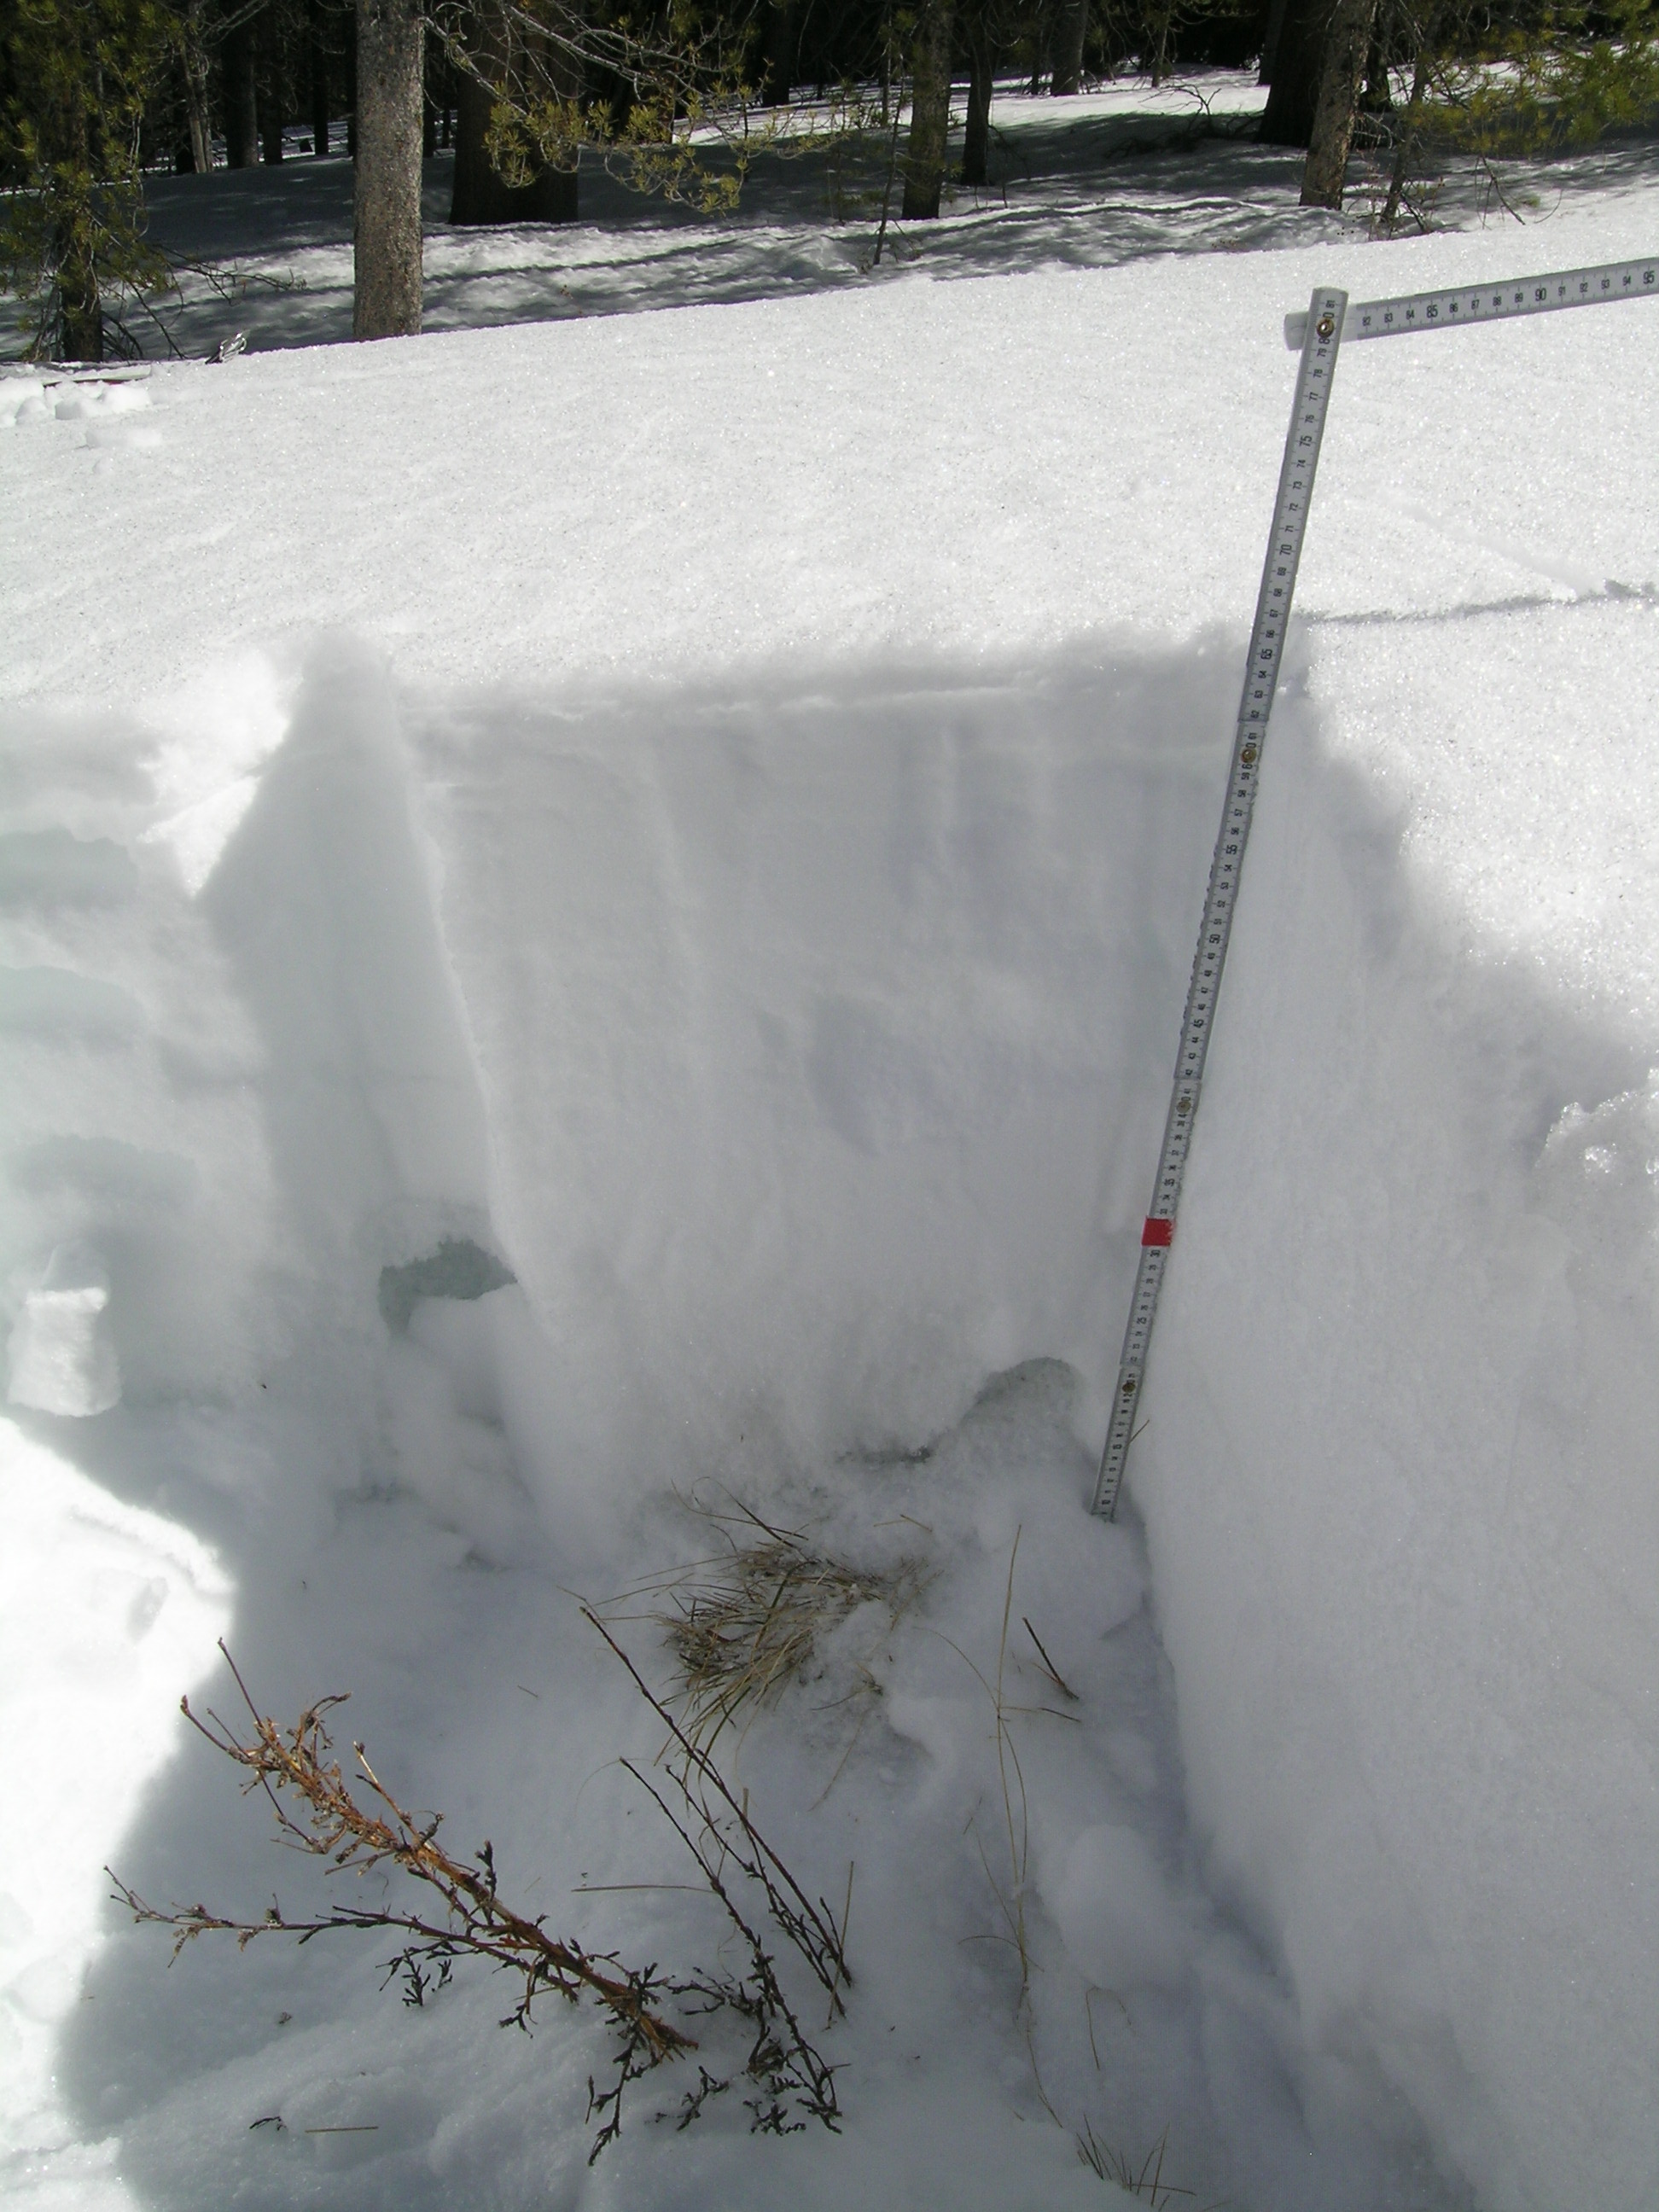
The snowcover at the Park Cone CODOS site, in an open meadow immediately adjacent to the forested Park Cone Snotel site, has undergone complete warming since our March 14 snowpit and is rapidly melting, exposing large patches of open ground between thin patches of remaining snowcover. The site is likely to be snowfree in a matter of days. Dust loading at Park Cone is much less intense than at our Senator Beck Basin study sites but has been sufficient to absorb additional solar energy at the snowpack surface and contribute to this ablation of the snowcover.
On March 14th the snowpack at our CODOS snowpit site was 28” (70 cm) deep and most of the snowpack consisted of very weak “depth hoar” grains; mean snowpack temperature was -3.7° C. Dust event D4 was clearly evident on the snow surface at the snowpit and in terrain around Taylor Reservoir. SWE content in the snowpit was 7.1” (181 mm) and mean density of the snowpack was 238 kg/m3 (23.8% water content). As a result of the subsequent, prolonged period of warm, dry, and sunny weather, and some additional small reductions in snow albedo from additional dust events, the snowpack on April 9th was isothermal (0°C) and contained only 3.15” (80 mm) of SWE, a loss of nearly 4” of SWE (101 mm) since March 14; total snow depth was a scant 9” (23 cm) and density had risen to 333 kg/m3 (33.3%).
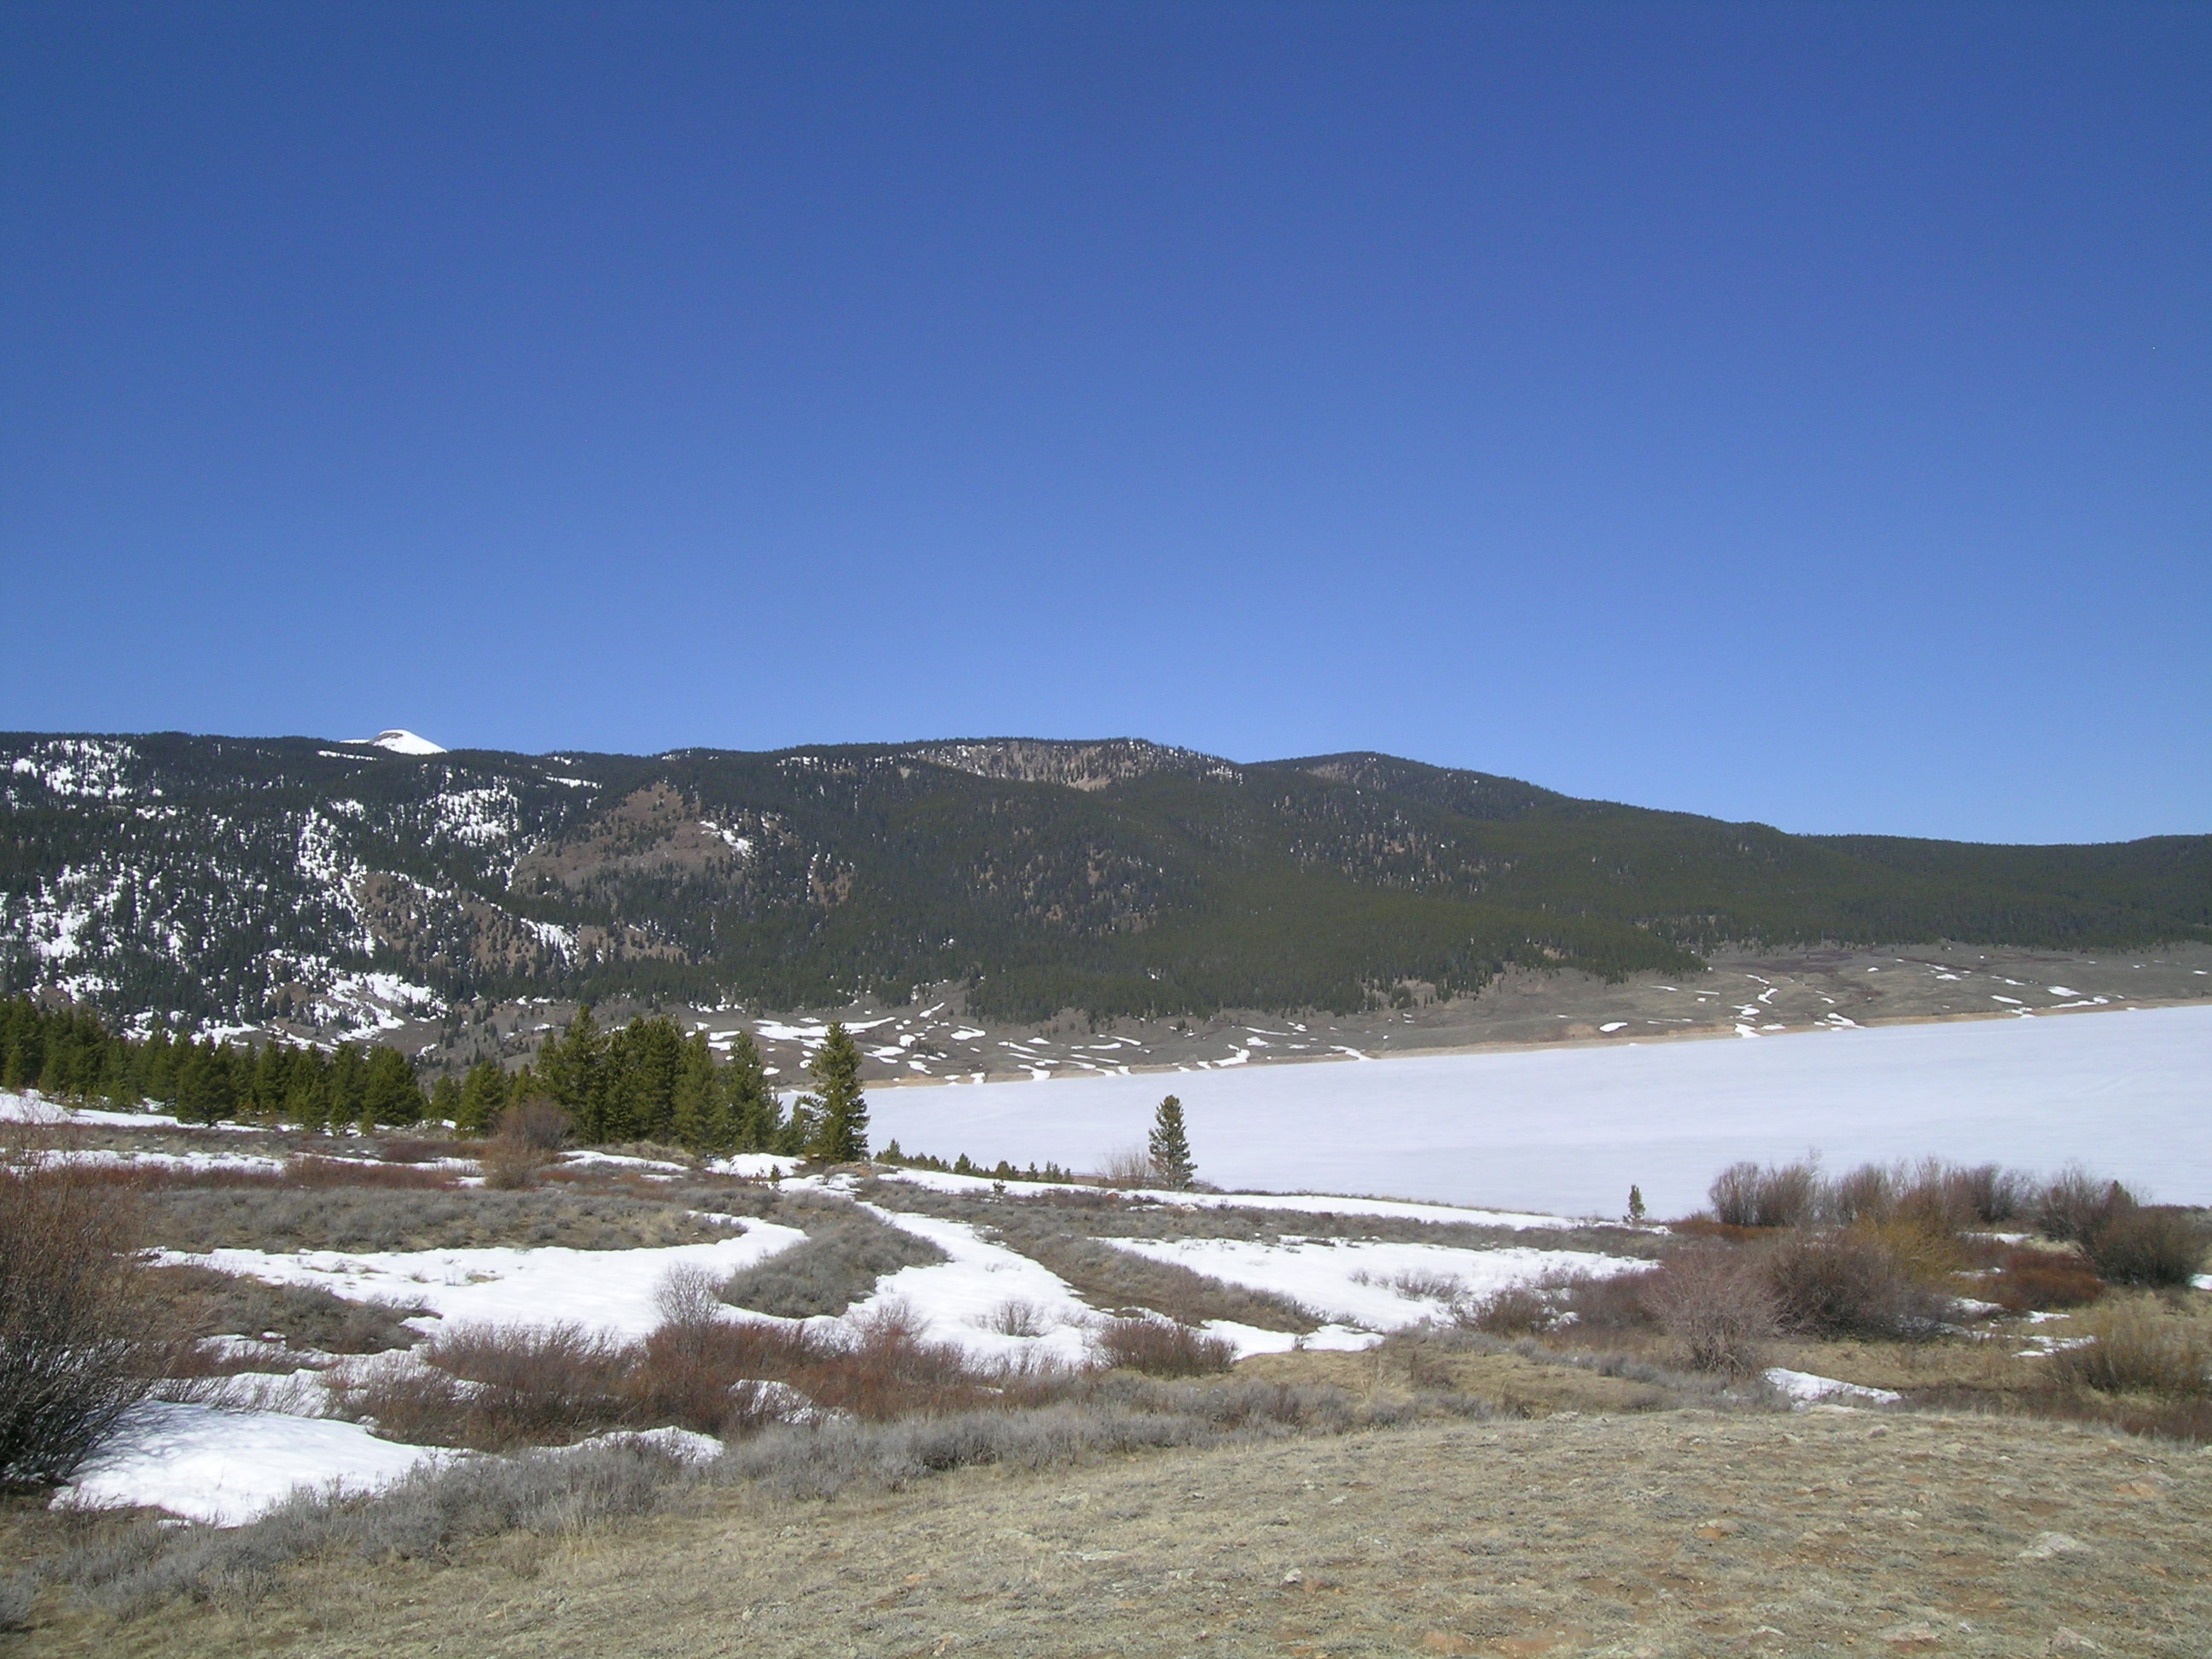
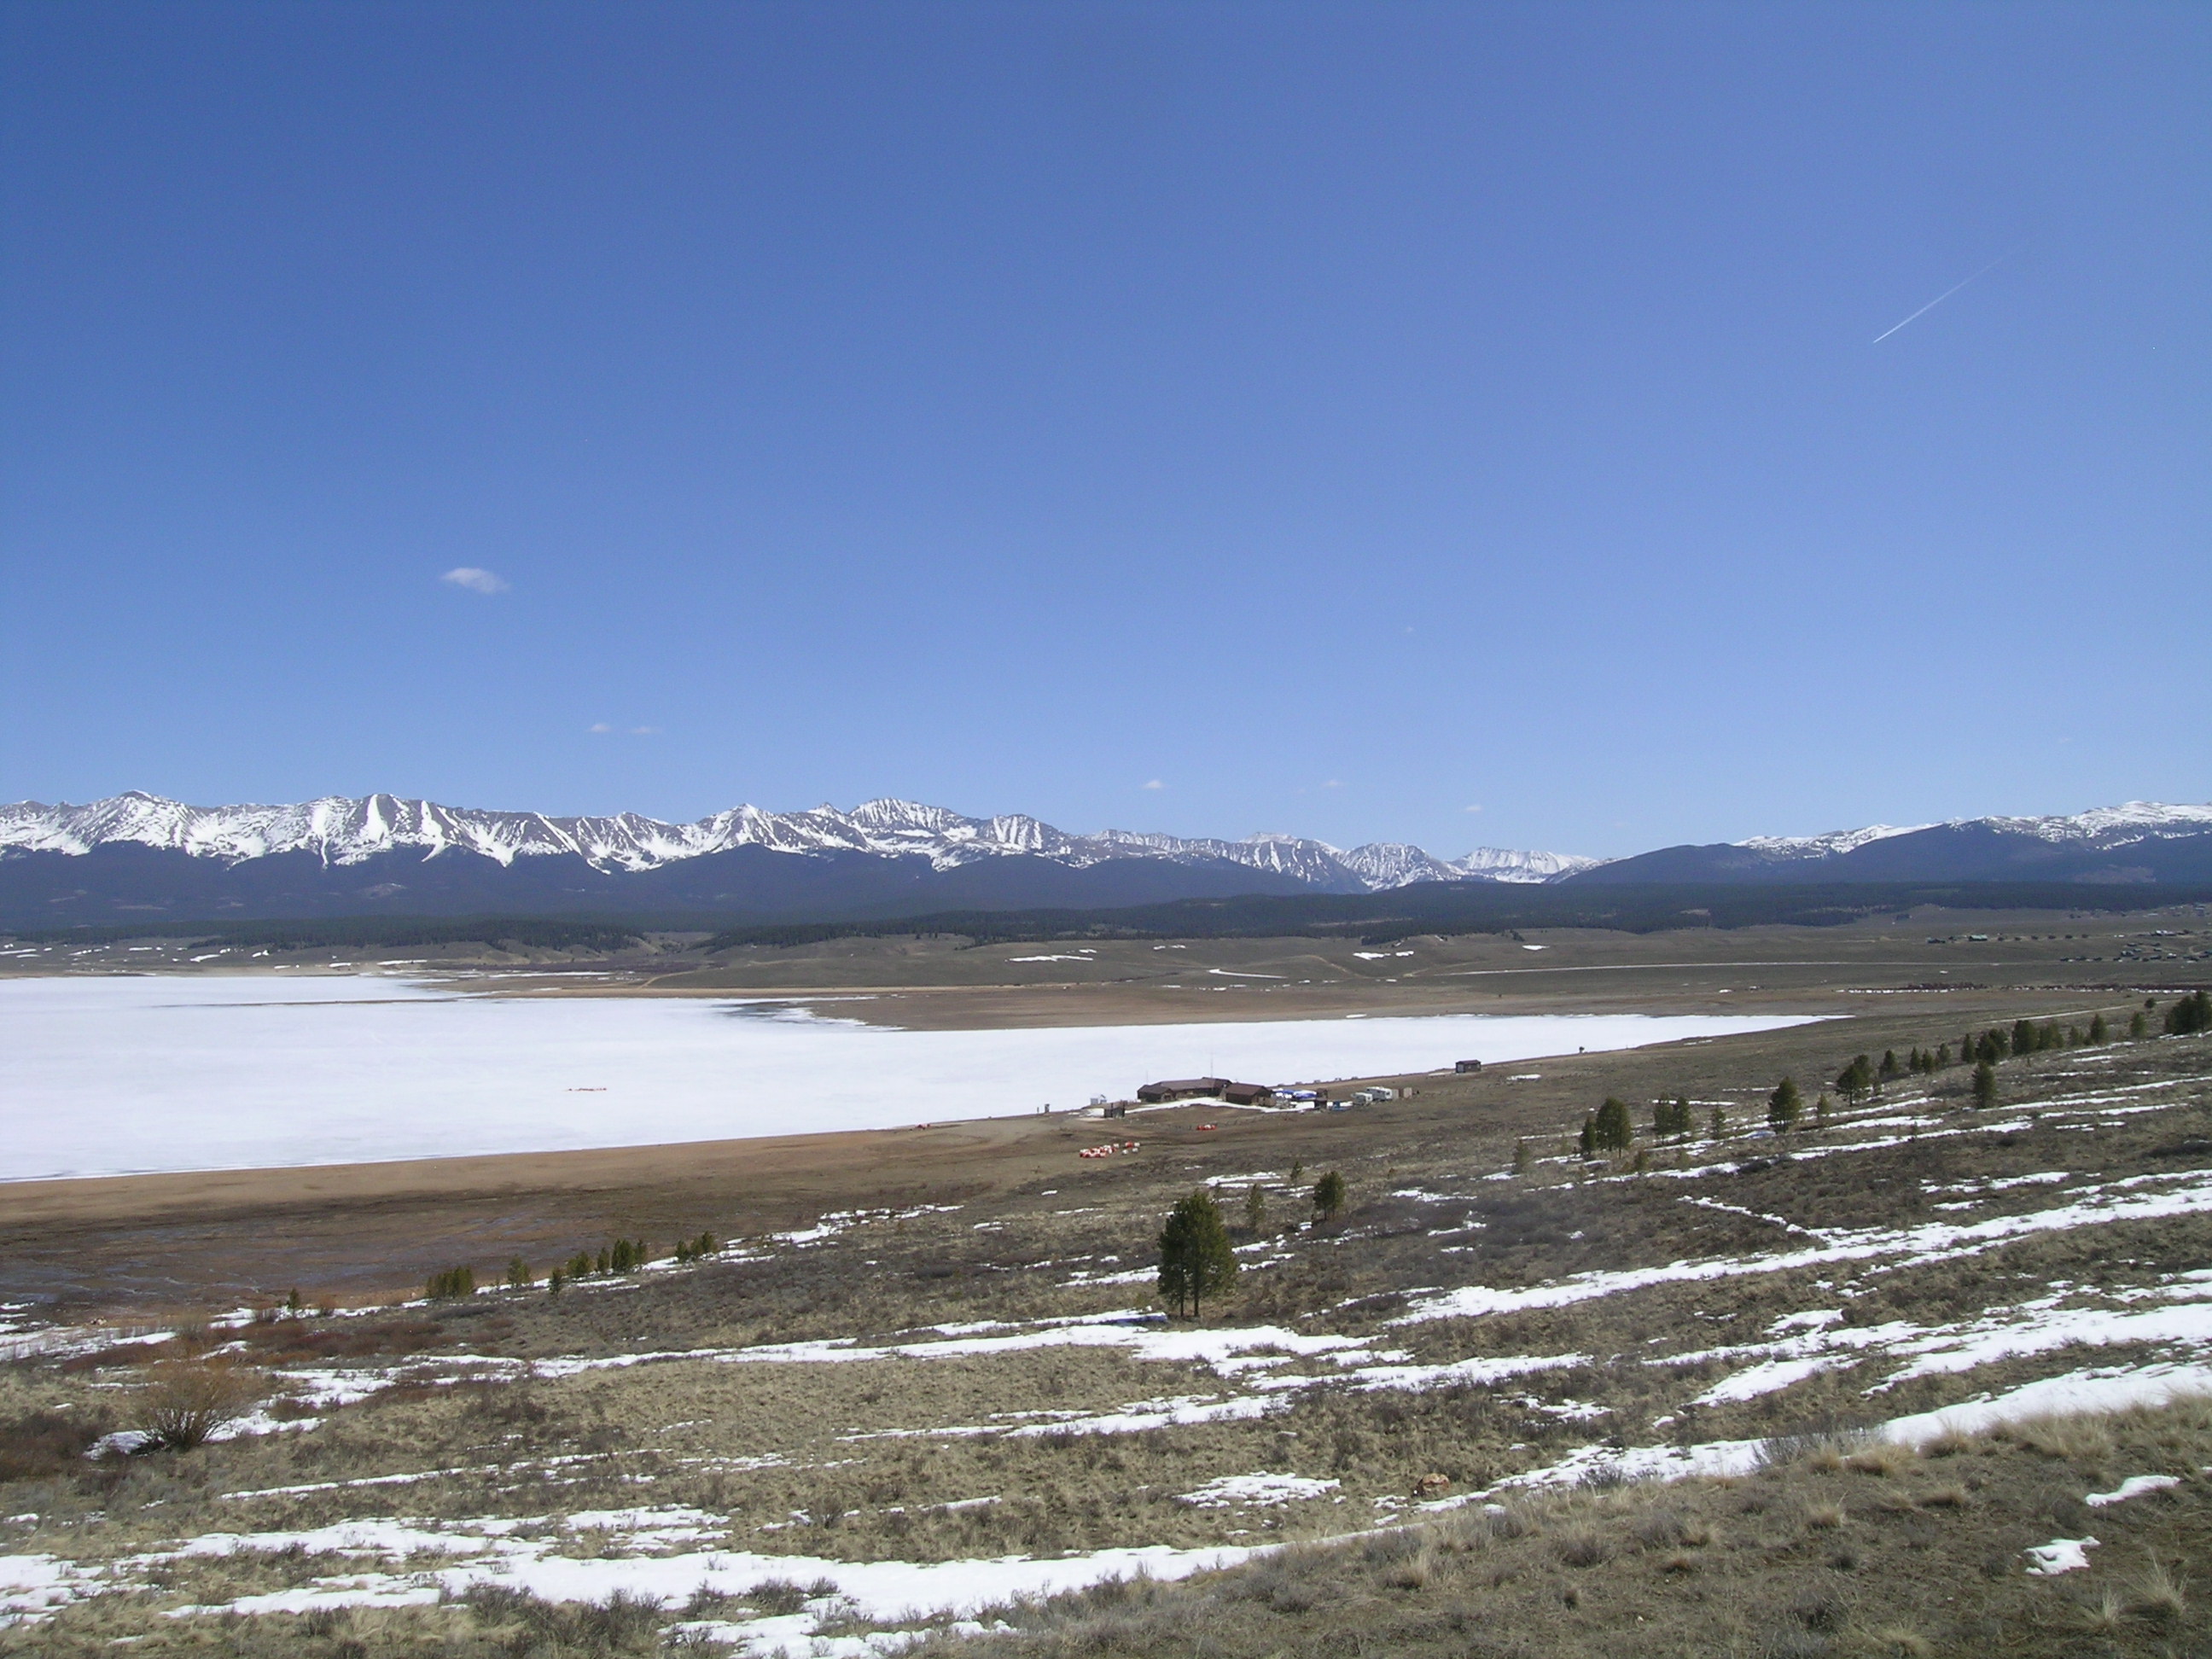
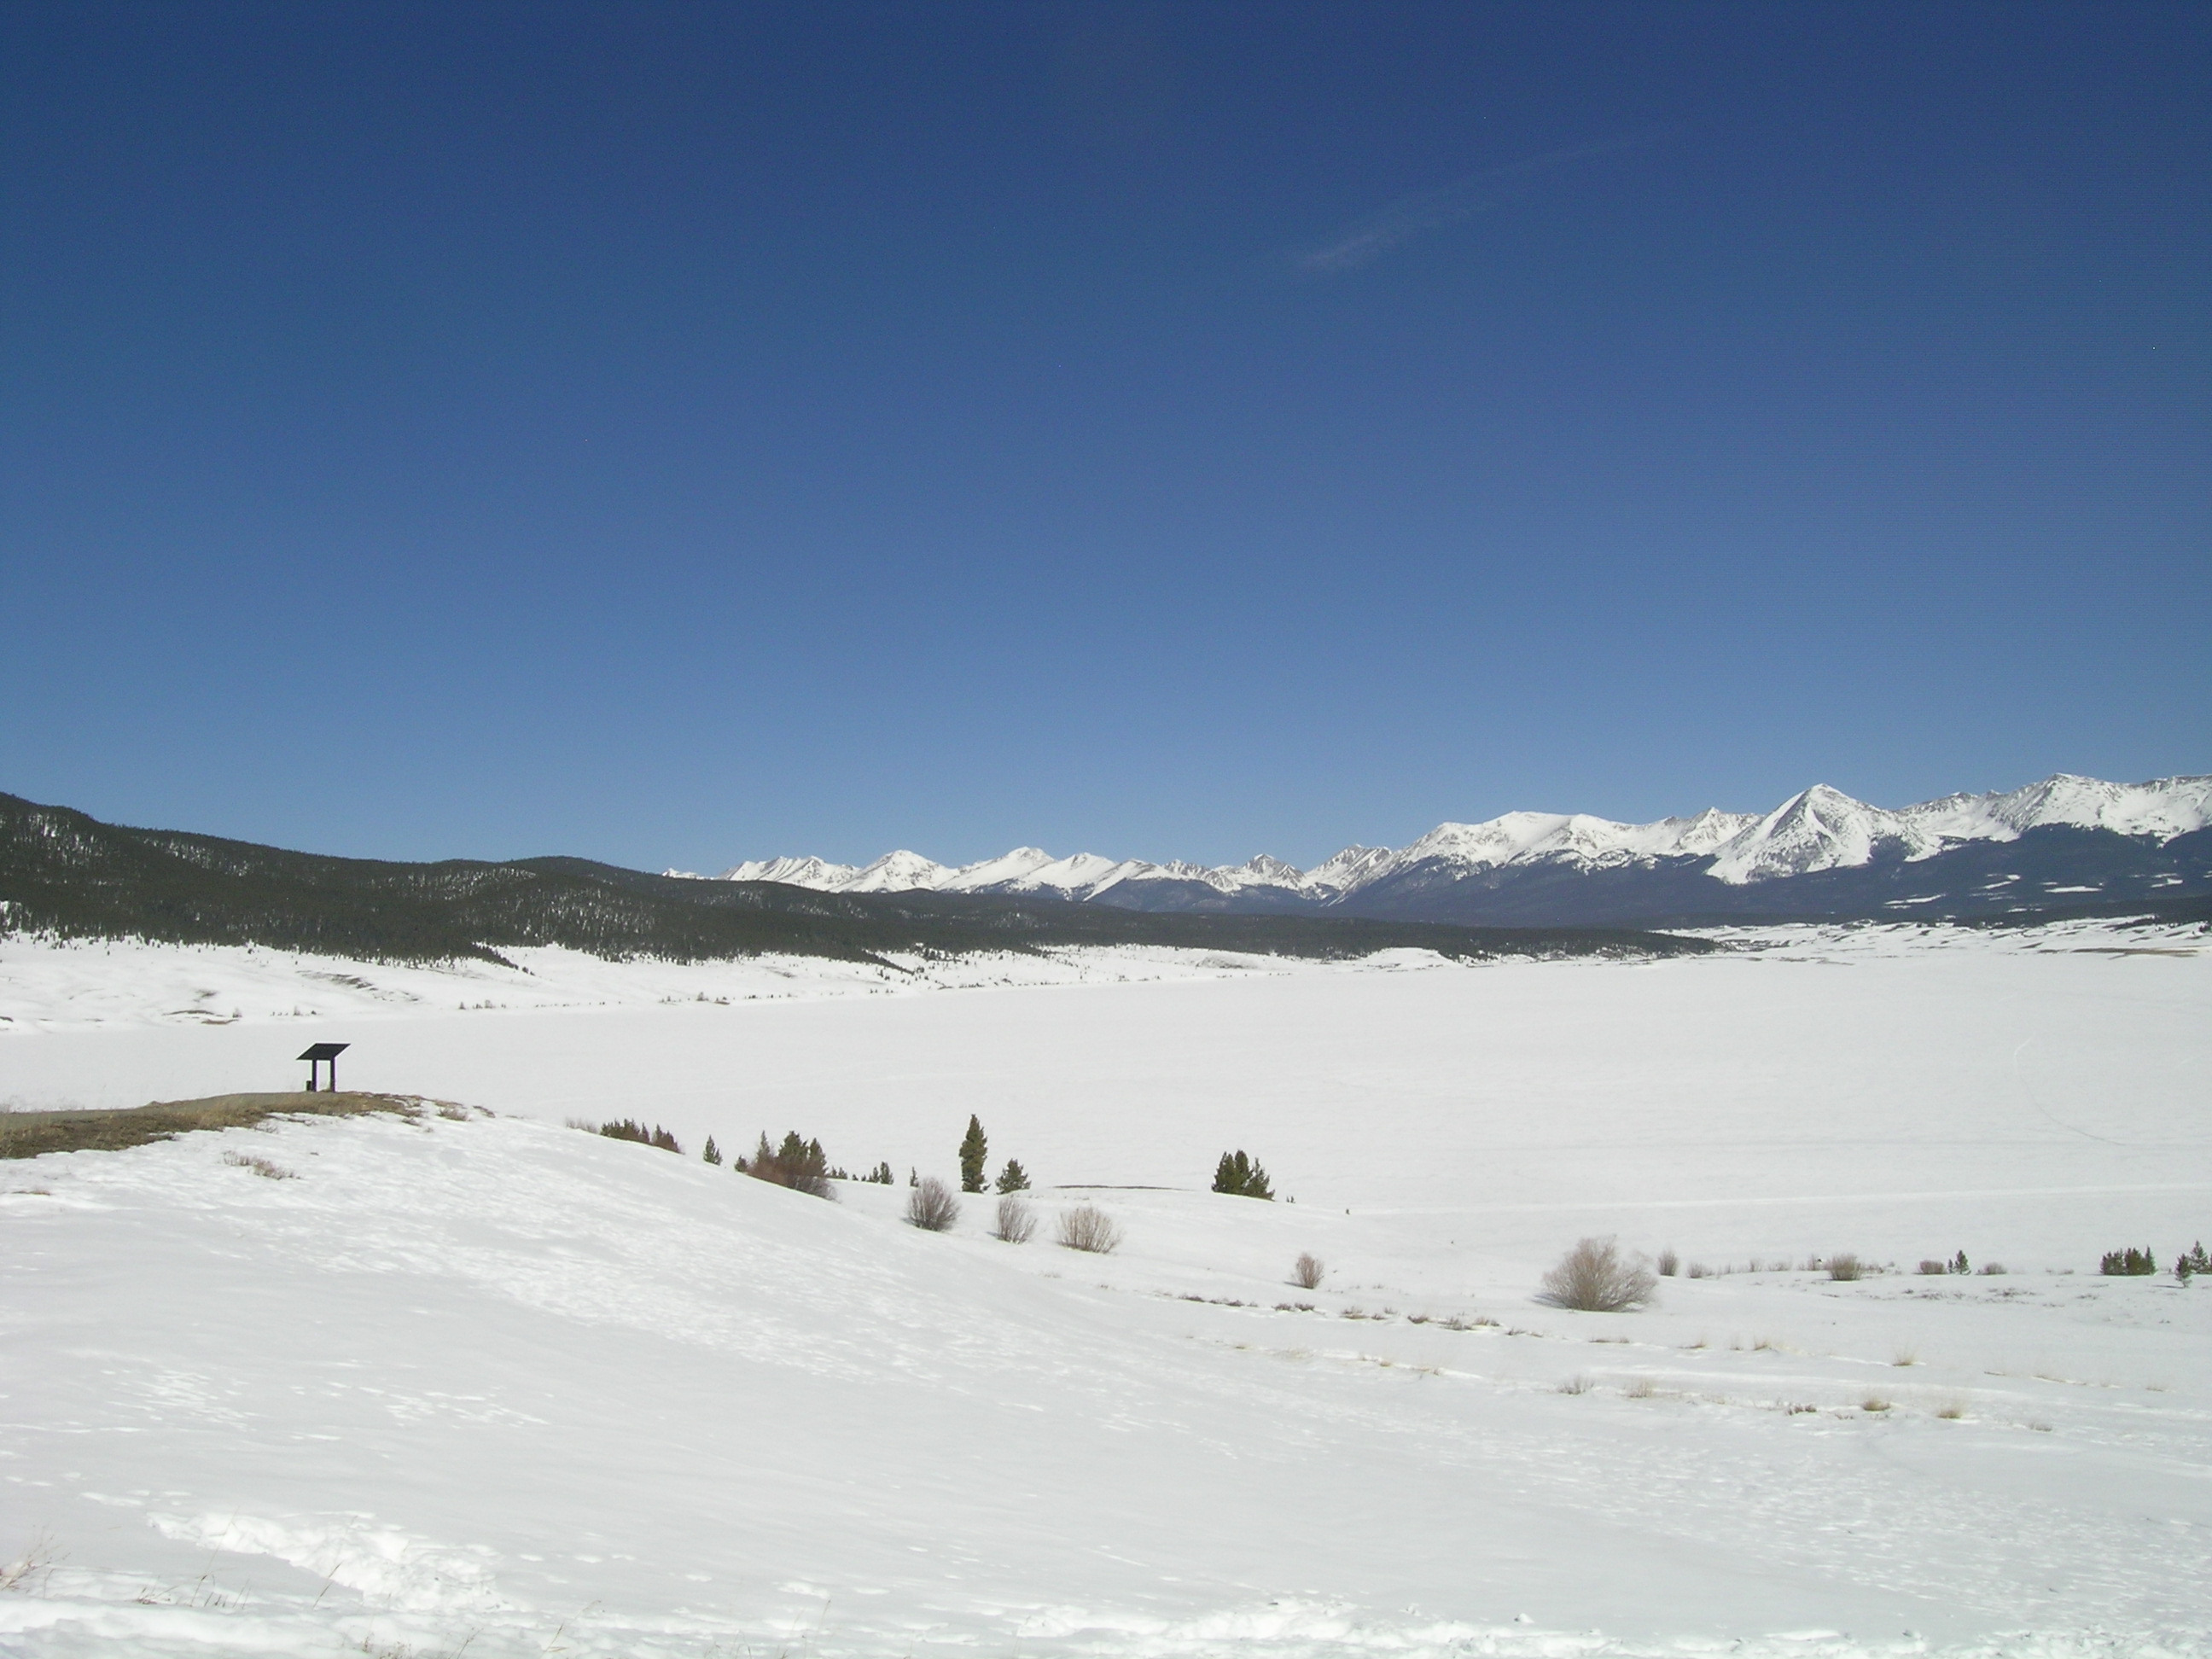
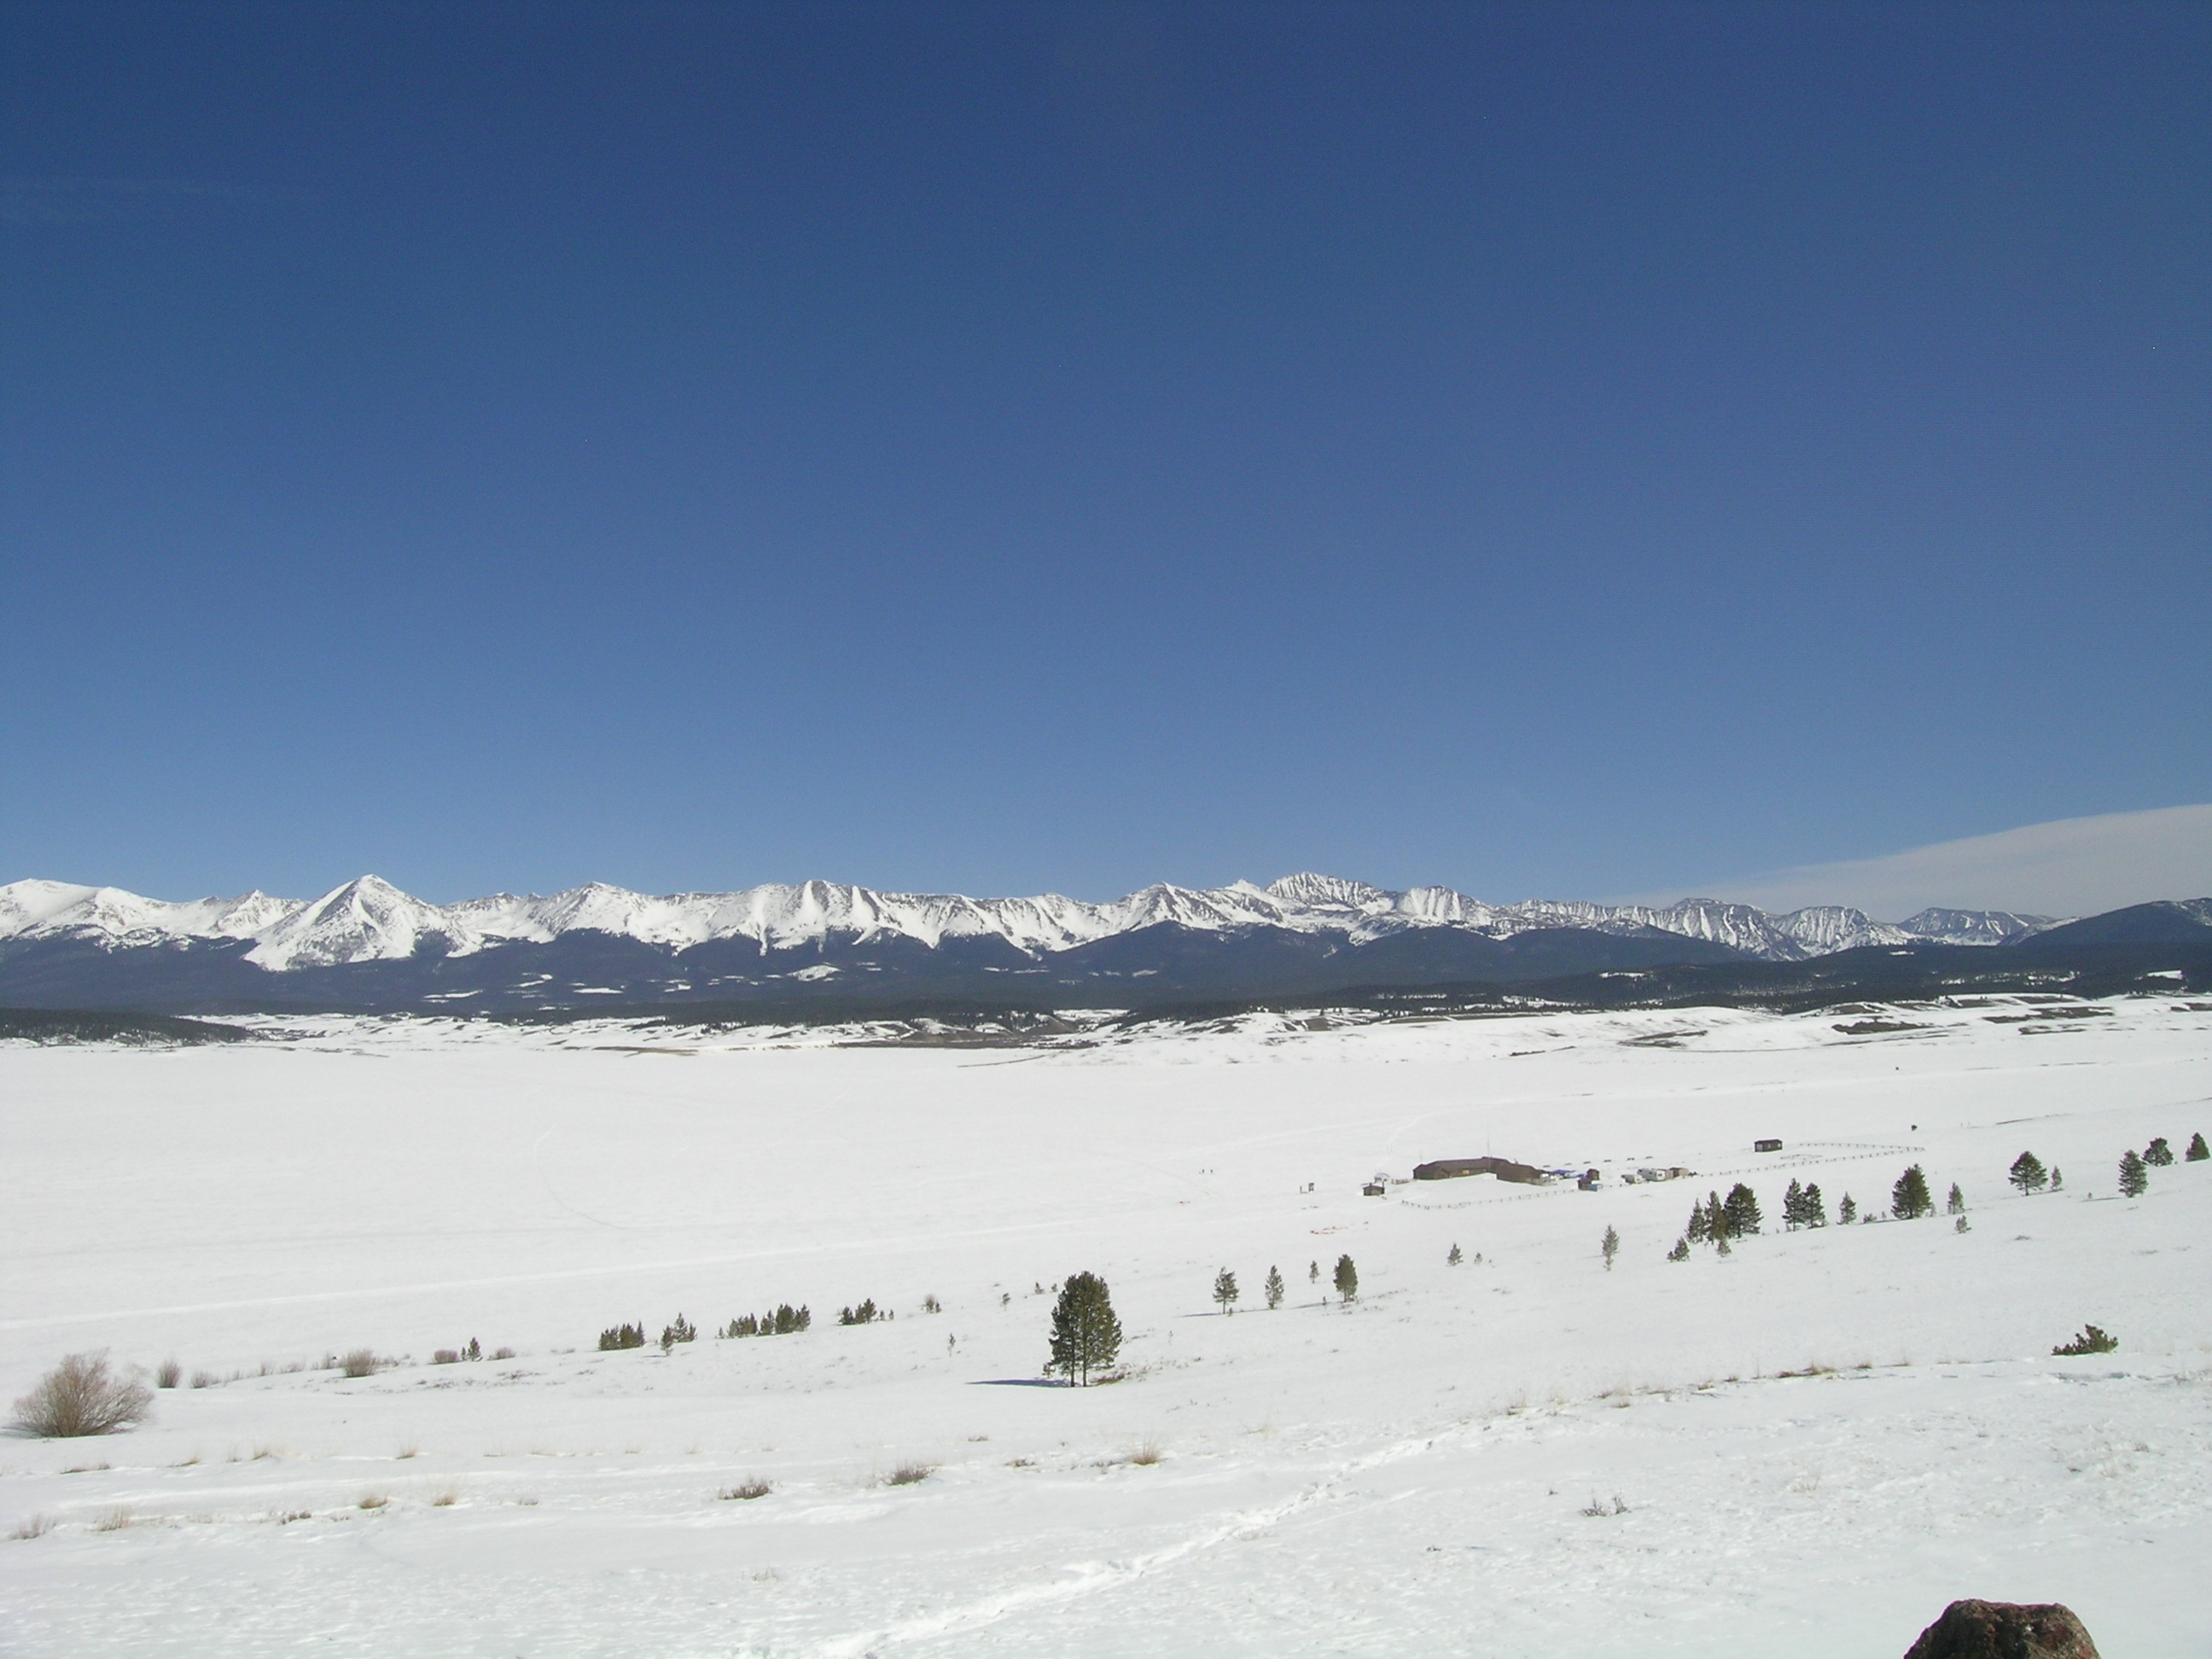
As seen from the overlook of Taylor Reservoir near our CODOS site, the valley floor above the reservoir was essentially snow free, as were south-facing slopes adjoining the reservoir. North-facing terrain still presented extensive but visibly shallow snowcover. The reservoir itself was still iced over.
| April 9, 2012: | |||
 |
 |
 |
 |
April 9th pit profile |
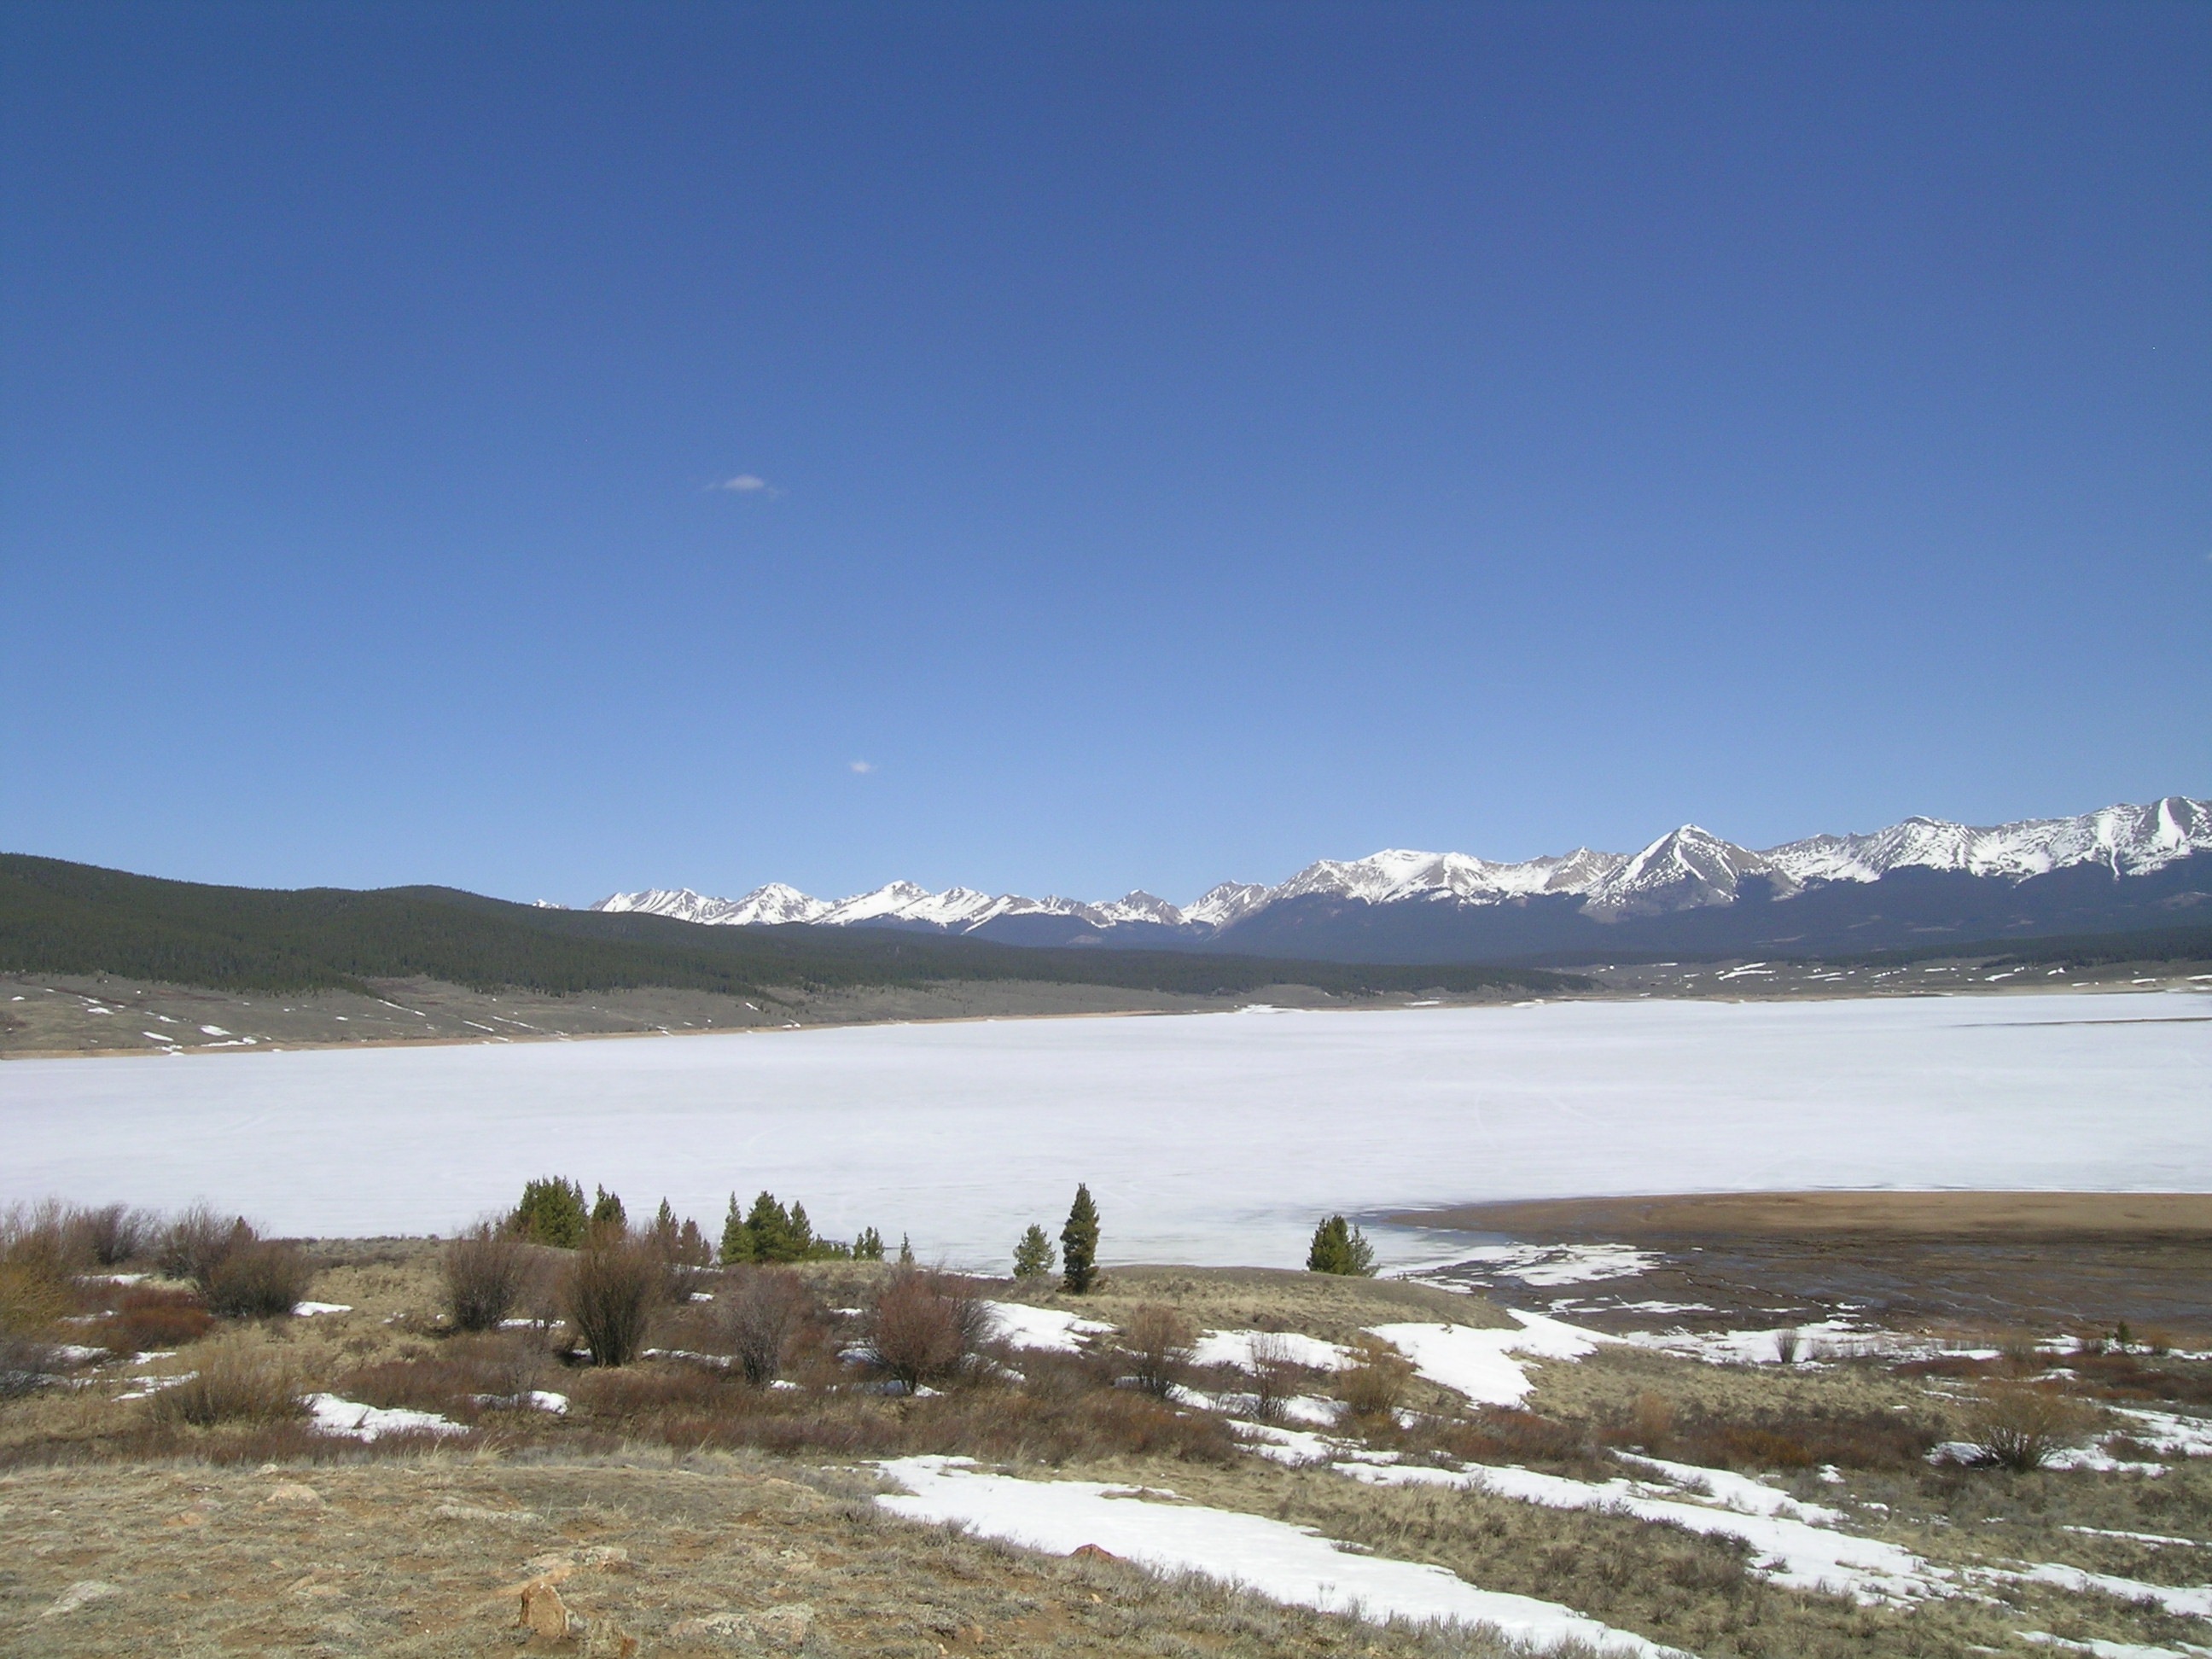
Taylor Reservoir with Sawatch & Collegiate ranges in background |
||
 |
 |
 |
|
April 9th pit |
Frank Kugel at the pit site |
Fillled-in April pit and exposed March pit site |
|
| March 14, 2012: | |||
 |
 |
 |
 |
March 14 pit profile |
Taylor Reservoir with Sawatch & Collegiate ranges in background |
March 14th pit |
|
Melt Rate
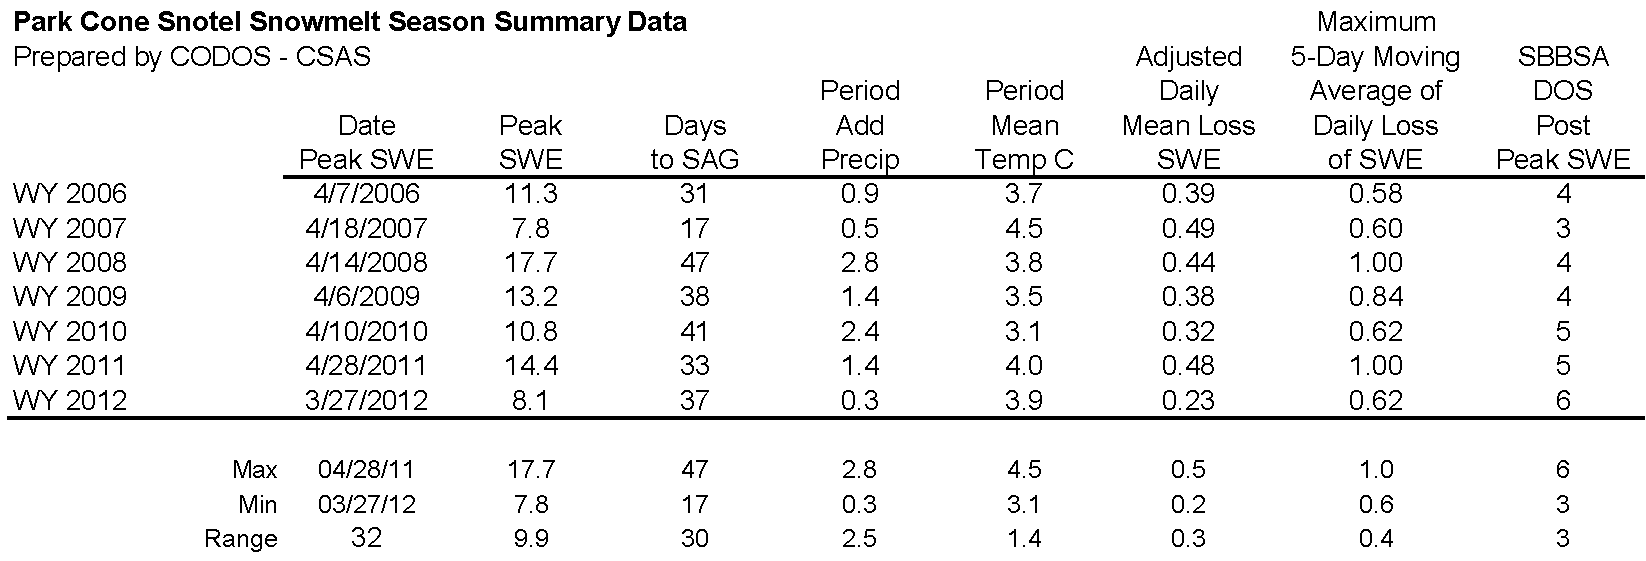
The Park Cone Snotel site, which is partially shaded by adjoining trees, has shown only a 1” loss of SWE since mid-March and retains about 7” of SWE. That melt rate falls well short of mean melt rates in prior seasons. However, as described above, melt rates in the open meadow adjacent to the Snotel station were four times more rapid, with a loss of 4” of SWE in the same period. This differential can be largely explained by the much larger amount of incoming (short wave) solar radiation reaching the snowpack surface (and subsurface) in the open meadow, compared to the tree-shaded Snotel site; actual (measured, rather than perceived) air temperatures in the trees and in the open meadow would not vary greatly between the two sites during daylight hours.
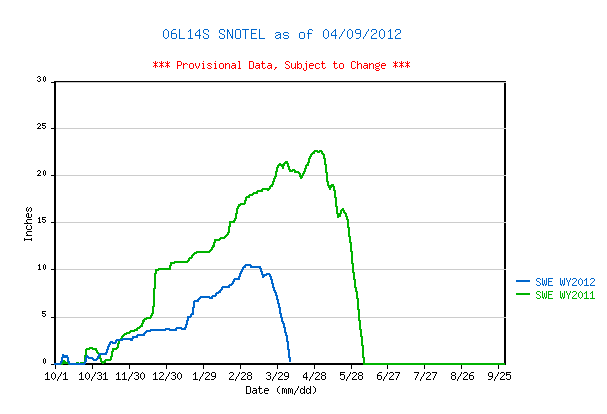
As snowcover becomes thoroughly wetted and thins, solar energy is transmitted efficiently and can reach the ground (or Snotel snow pillow) itself, further accelerating snowmelt rates. Melt rates at the Upper Taylor Snotel farther up the Taylor River valley have been much higher than at Park Cone and have reached snow all gone (SAG), perhaps due to different site characteristics. Higher still, and west of the Taylor River drainage, the Schofield Pass Snotel (see snowmelt analysis table and Snotel graph) has reported smaller losses in SWE since mid-March, following some gain in SWE related to the storm delivering dust event D4 on March 18. These Schofield Pass melt rates fall well short of those shown in the melt rate analysis table for that site. Like our Senator Beck Study Plot, the snowpack at Schofield Pass very likely still retains some cold content and is not yet fully isothermal at 0° C.
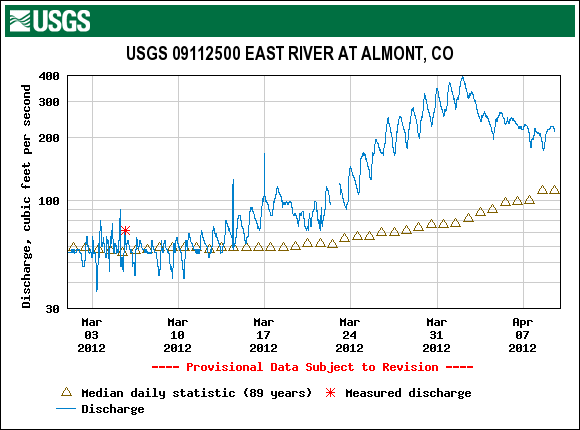
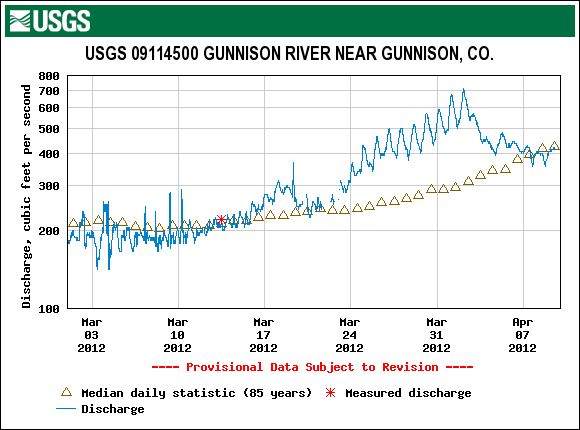
Stream Flows
Streamflow behavior at the USGS Gunnison River near Gunnison and East River at Almont gauges show similar declines in early April, after significant surges in late March reaching very high flows compared to median levels at those gauges, for that period. Unsettled weather on April 2, with snow flurries, ushered in cooler air and cloudier skies for the following several days, with another weak weather system following on the 5th. Interestingly, the East River flows then stabilized flows at roughly double the median values, while the Gunnison near Gunnison was reduced to median flow levels.