CSAS Data: Graphs & Plots
Wind | Air Temps | Precip | Snowpack | Soil | Stream flow | Radiation
|
Water Year
|
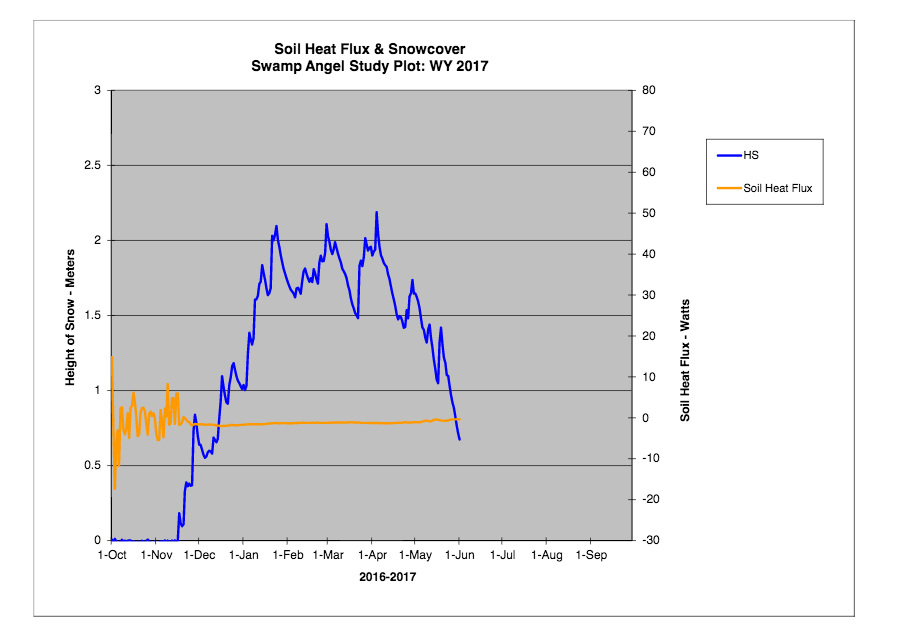
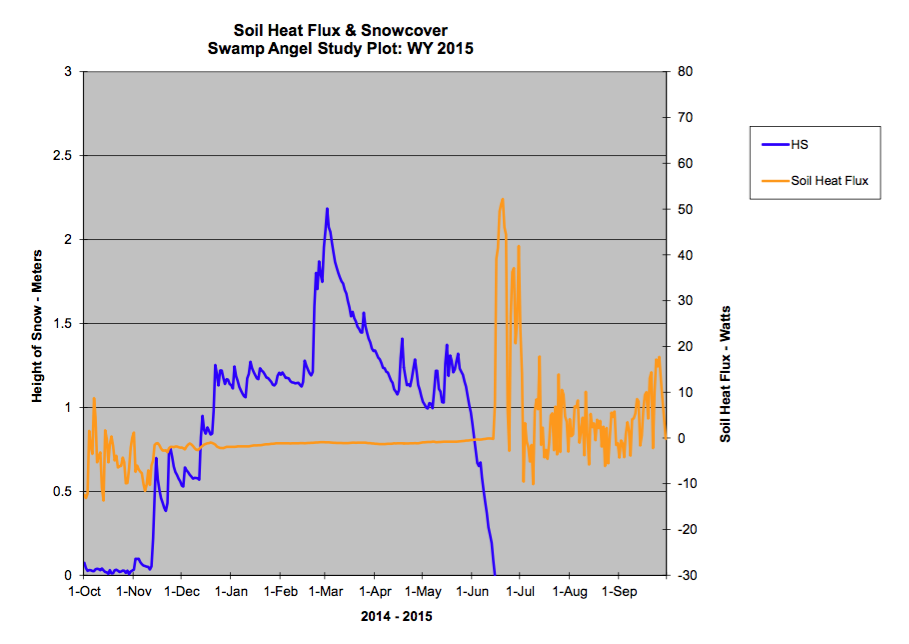
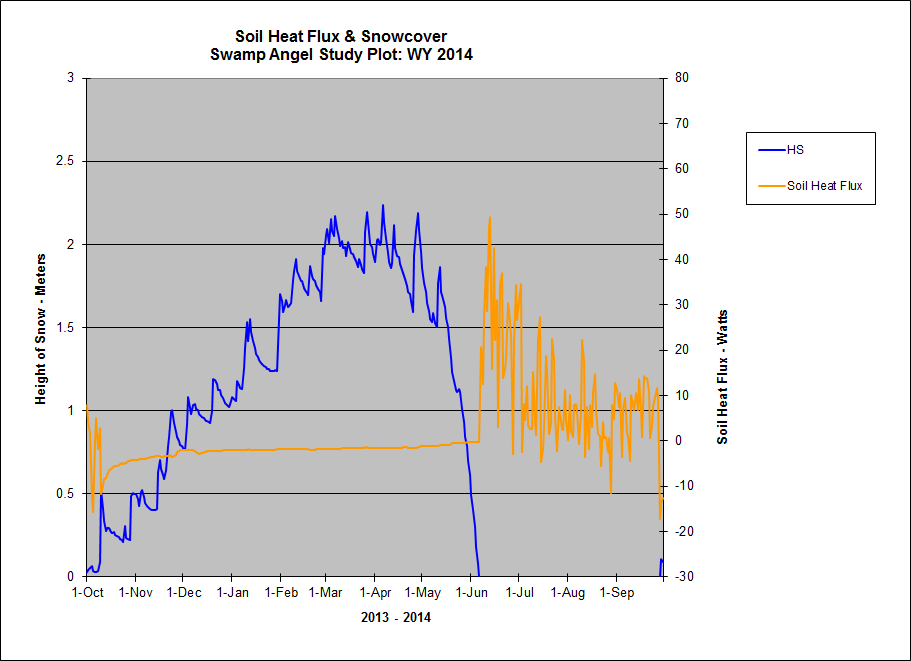
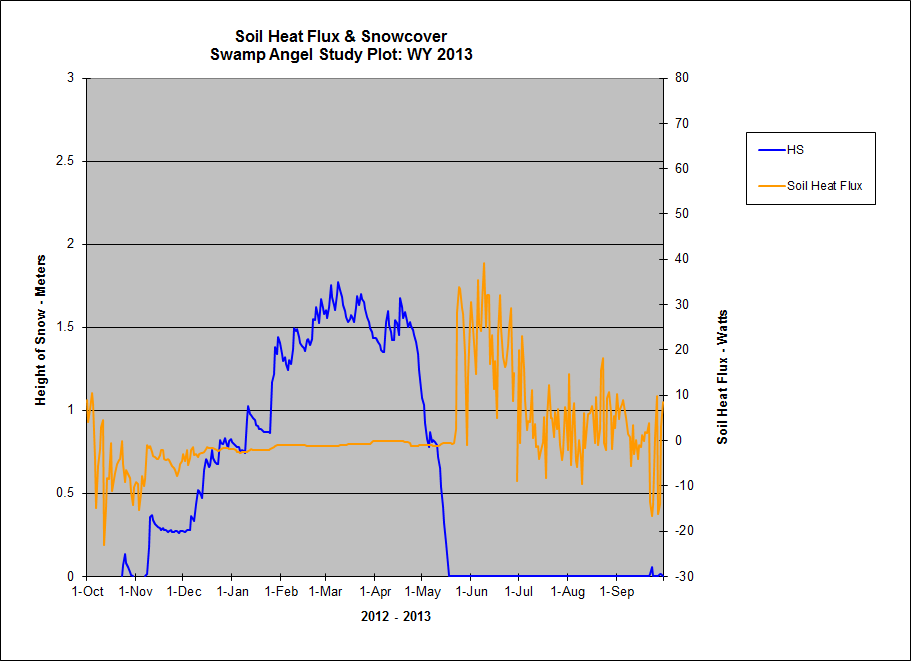
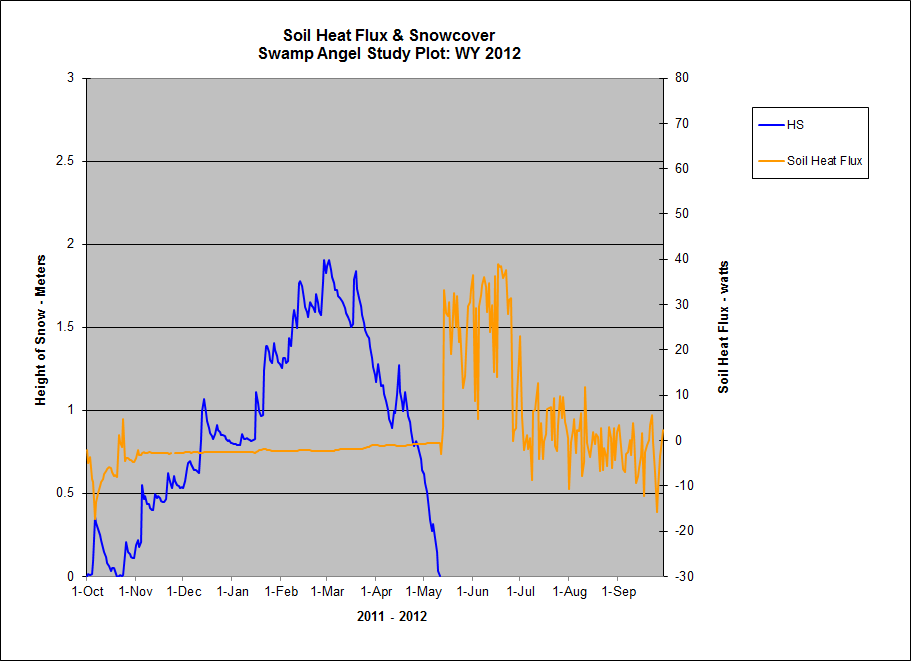
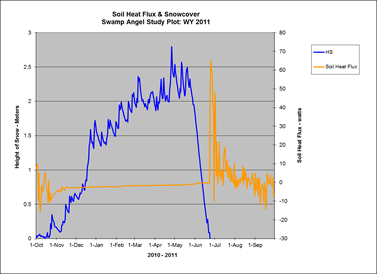
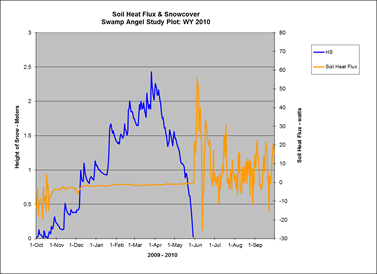
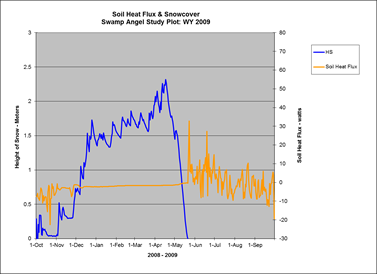
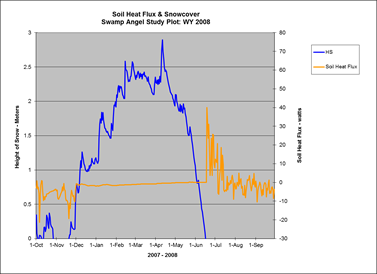
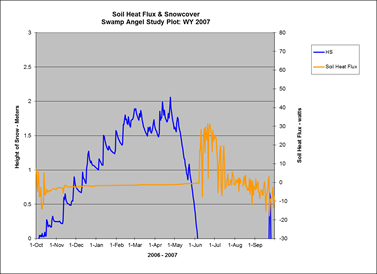
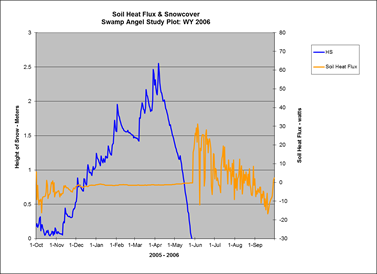
Swamp Angel Study Plot (subalpine)
|
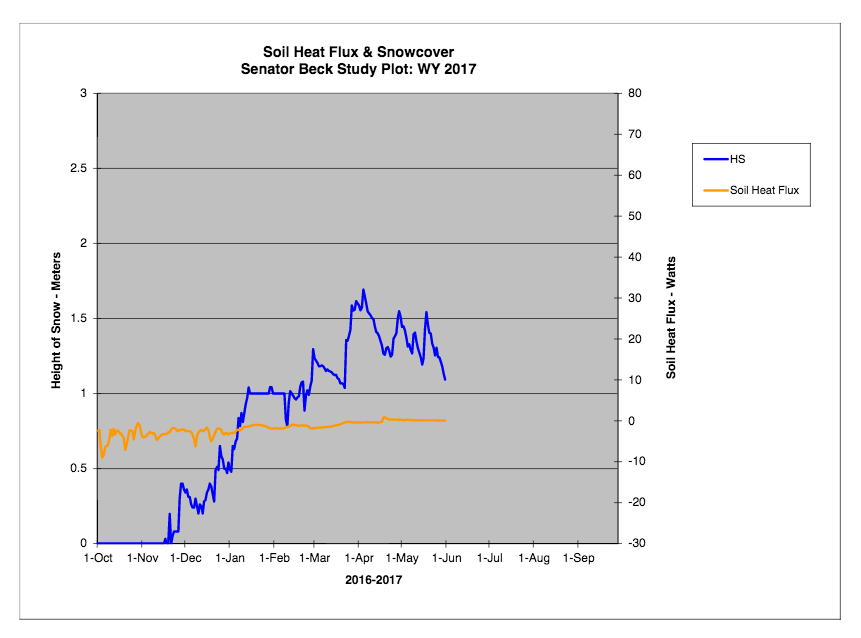
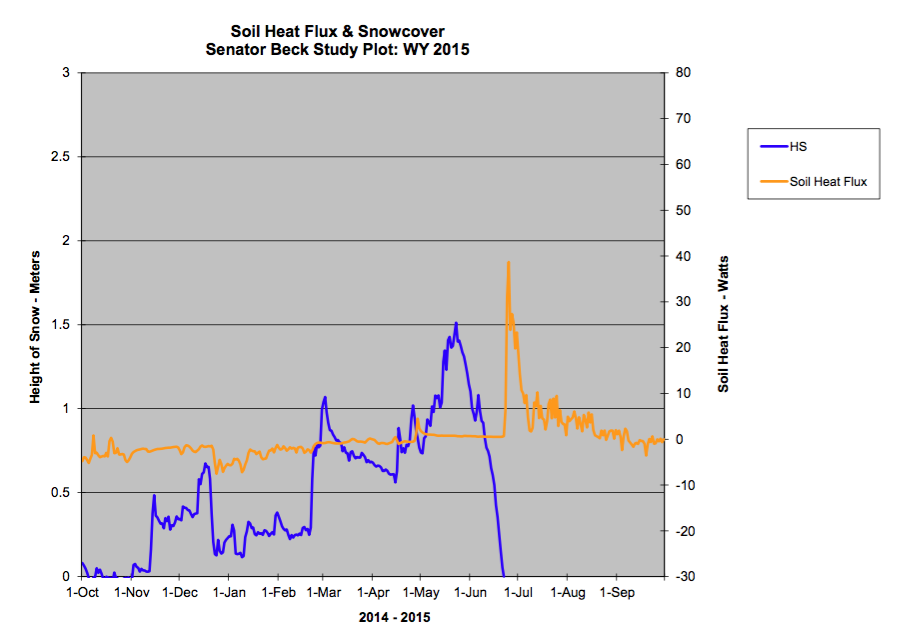
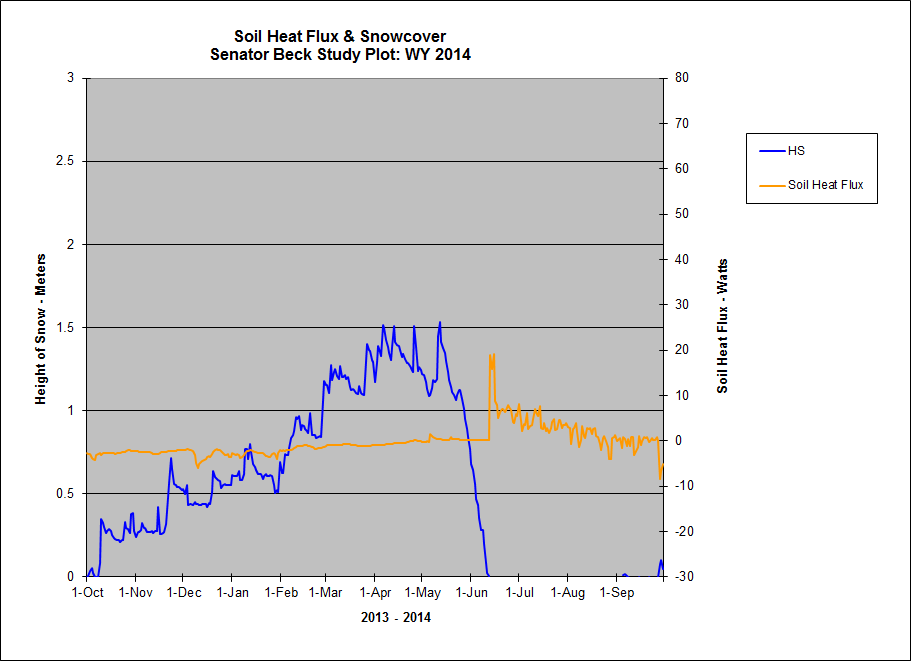
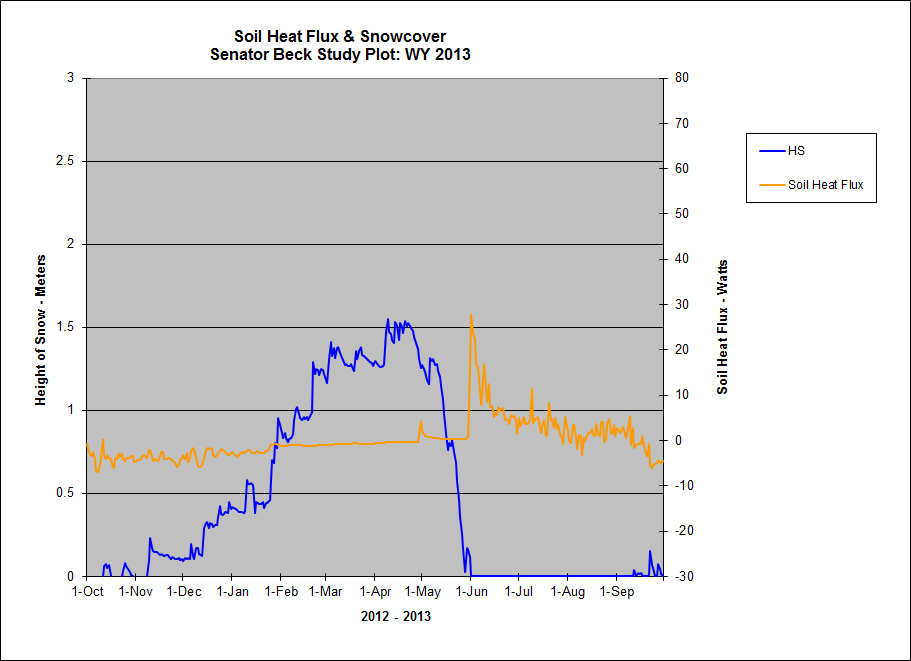
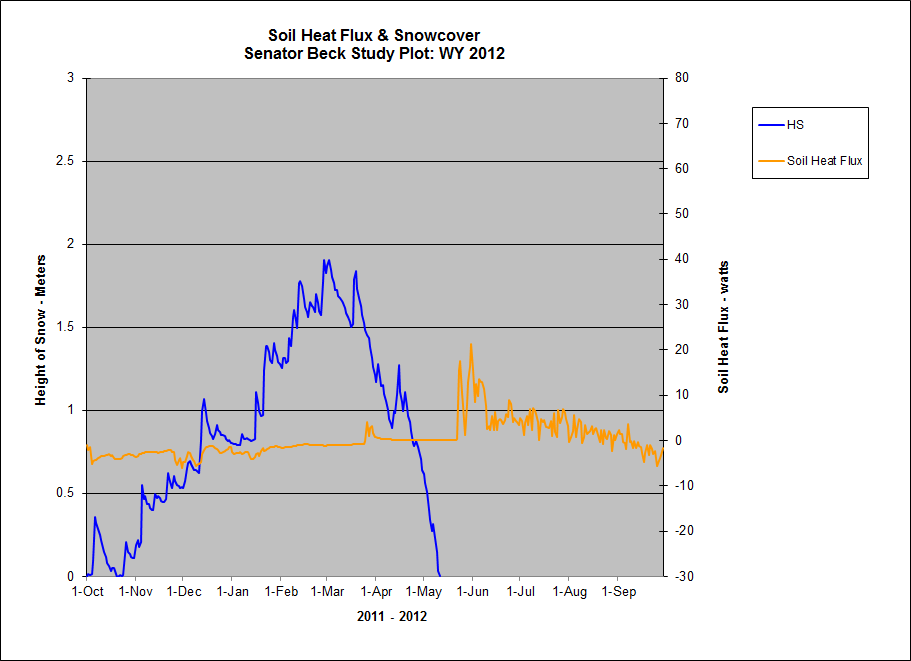
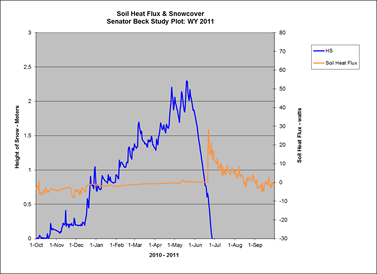
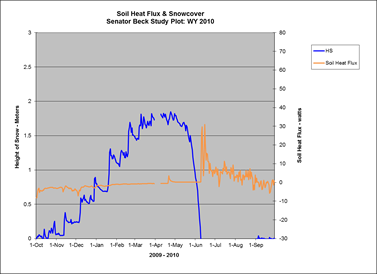
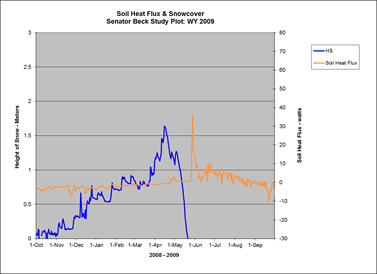
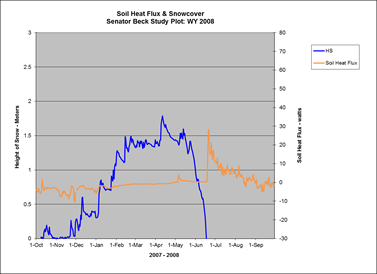
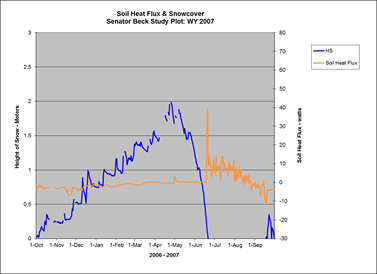
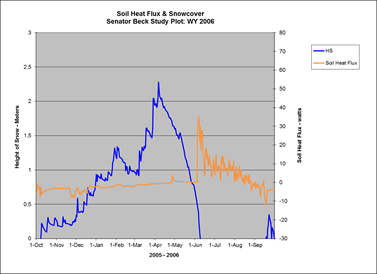
Senator Beck Study Plot (alpine)
|
|
WY 2017
Oct 1, 2016 - Sep 30, 2017 |
||
|
WY 2016
Oct 1, 2015 - Sep 30, 2016 |
||
|
WY 2015
Oct 1, 2014 - Sep 30, 2015 |
||
|
WY 2014
Oct 1, 2013 - Sept 30, 2014 |
||
|
WY 2013
Oct 1, 2012 - Sept 30, 2013 |
||
|
WY 2012
Oct 1, 2011 - Sept 30, 2012 |
||
|
WY 2011
Oct 1, 2010 - Sept 30, 2011 |
||
|
WY 2010
Oct 1, 2009 - Sept 30, 2010 |
||
|
WY 2009
Oct 1, 2008 - Sept 30, 2009 |
||
|
WY 2008
Oct 1, 2007 - Sept 30, 2008 |
||
|
WY 2007
Oct 1, 2006 - Sept 30, 2007 |
||
|
WY 2006
Oct 1, 2005 - Sept 30, 2006 |
See also: Snowpack plotted against soil volumetric water content and soil temperature.
Please contact us if you have questions or are interested in the datasets: jderry@snowstudies.org


