CSAS Data: GRAPHS & PLOTS
WIND | AIR TEMPS | PRECIP | SNOWPACK | SOIL | STREAM FLOW | RADIATION
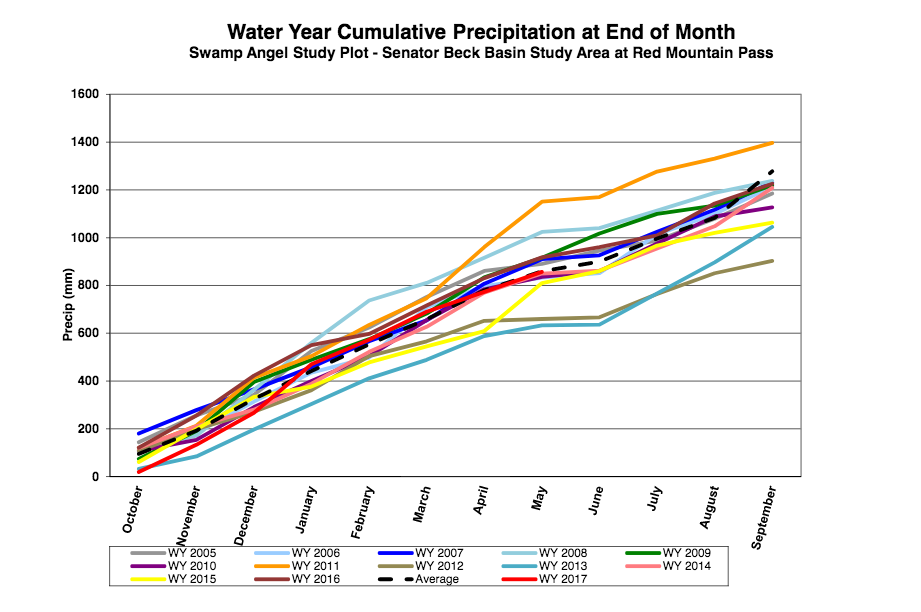
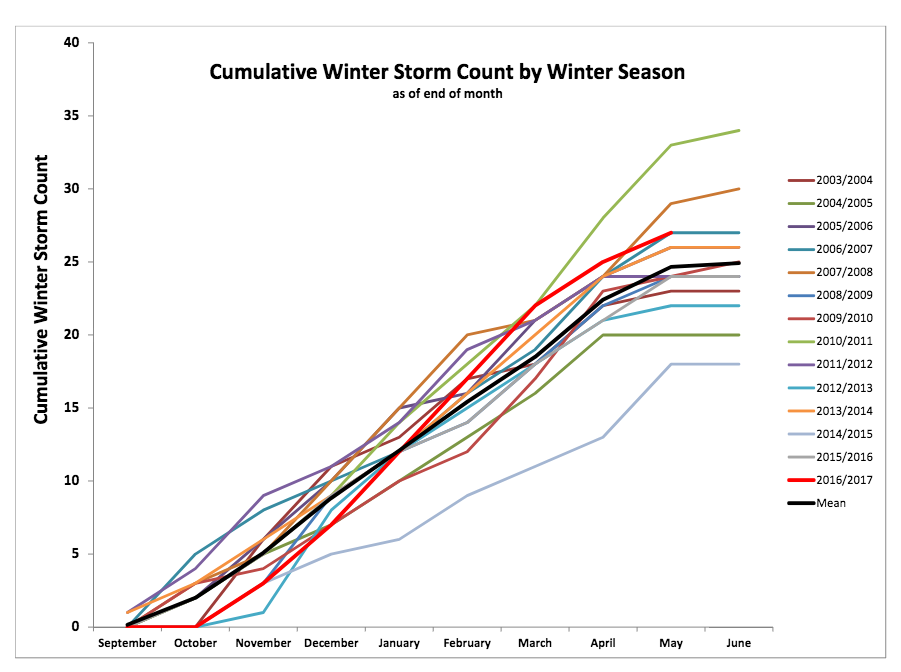
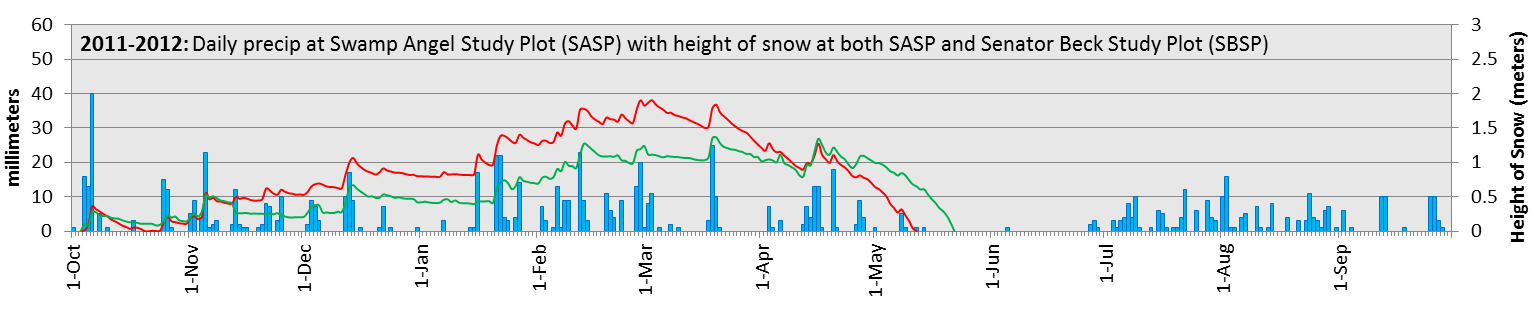
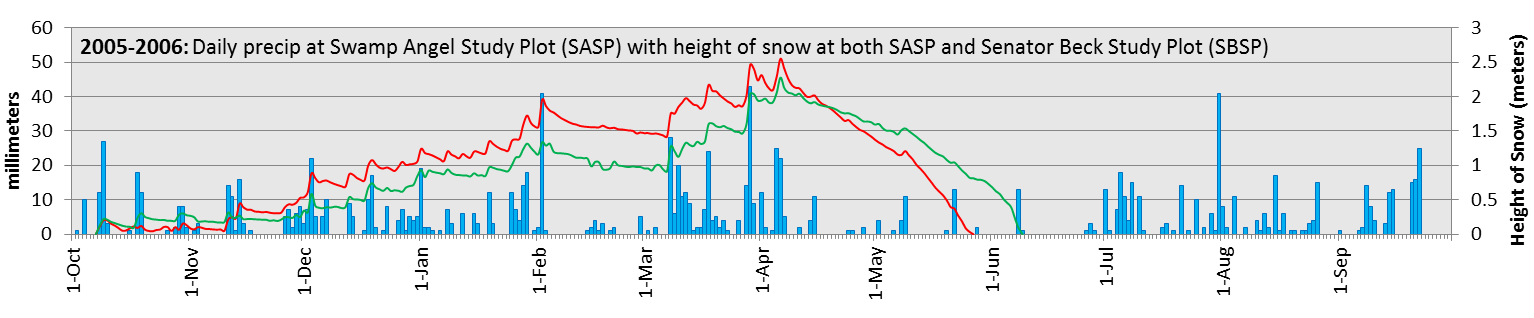
The data for the above graph can be found in our Precip and Storm Report Excel Workbook

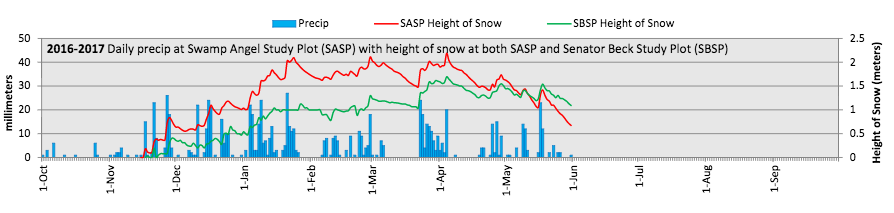
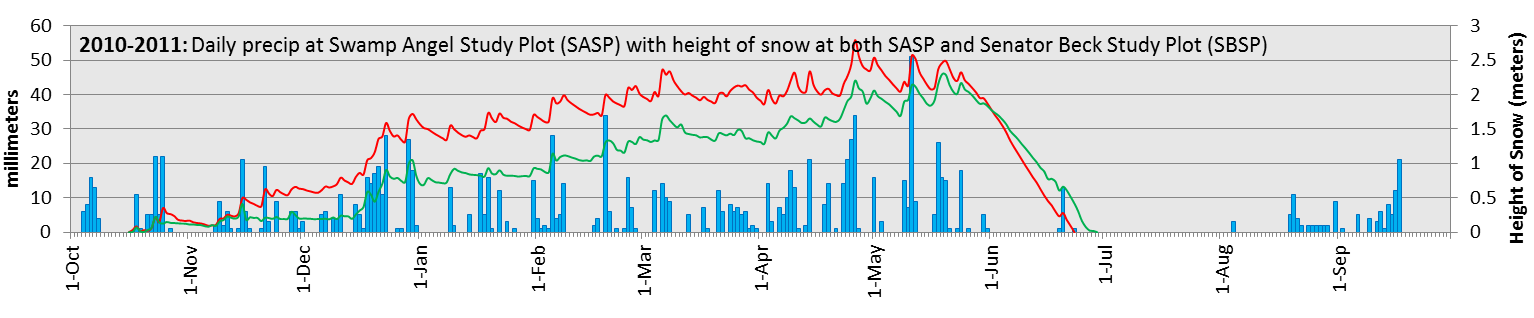
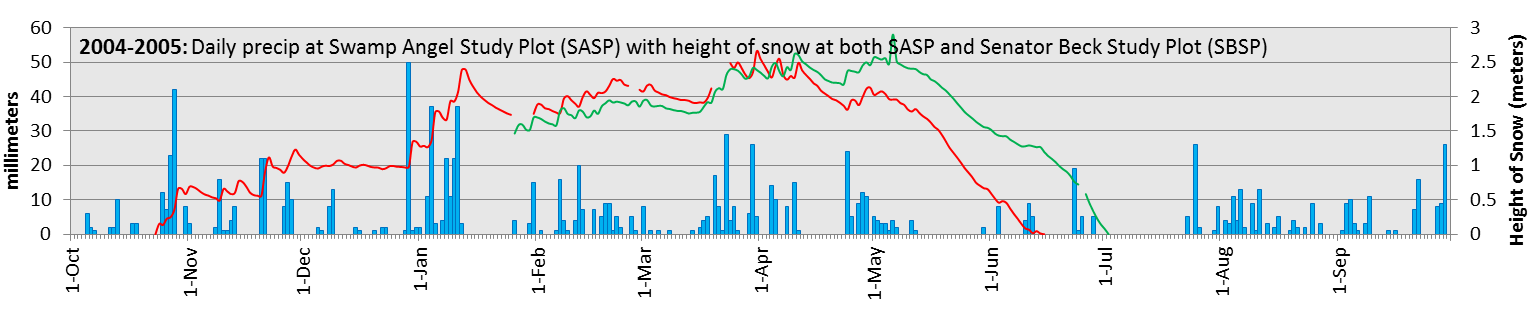
The data for the above graph can be found in our Precip and Storm Report Excel Workbook


We also have all years of snowpack plotted on a single graph, and individual snow pack plotted against soil temp, flux and VWC